OPEN-SOURCE SCRIPT
Aggiornato [blackcat] L2 Votatility of Williams VixFix Risk Assessment
Hey there! I previously wrote an article about the Larry Williams ViX Fix technical indicator. Soon after, friends from the TradingView community told me that this indicator could be combined with the Risk Assessment indicator I wrote about earlier to determine when to go long or short. At the time, I found it a bit cumbersome to use both indicators together, so I came up with a solution: to merge them. This way, we can use one technical indicator to visually see whether we should go long or short. Isn't that cool? The indicator has a very common name: **[blackcat] L2 Votatility of Williams VixFix Risk Assessment, or VoWVRA for short.**
This TradingView Pine Script is a custom indicator based on the Larry Williams ViX Fix technical indicator, designed to help traders with risk assessment and trading decisions. The Larry Williams ViX Fix indicator is derived from the volatility of the S&P 500 index and is mainly used to display changes in current market sentiment. The indicator determines market volatility by calculating the distance between the highest price, the lowest price, and the closing price. The higher the value of the indicator, the more tense the market sentiment, and the higher the market volatility; conversely, the lower the value, the more stable the market sentiment and the lower the market volatility.

The VoWVRA indicator is based on the Larry Williams ViX Fix indicator, combined with technical indicators such as Bollinger Bands and EMA, to assess market risk. The indicator can be customized with input parameters to suit different markets and investor needs. Using the VoWVRA indicator can help traders make wiser choices in risk control and trading decisions.
![[blackcat] L1 Trading Risk Assessment Indicator](https://s3.tradingview.com/v/voeMVZVz_mid.png)
In addition, this TradingView Pine Script also includes a risk assessment indicator. The indicator calculates a series of values and then applies the exponential moving average (EMA) to the percentage change between the closing price and the highest and lowest prices within a certain range to determine the safety level. The safety level is then compared to different thresholds to determine the market's risk level. The risk assessment indicator can be customized with input parameters such as risk length, safety length, and EMA length to suit different market conditions and investor preferences. Using the risk assessment indicator can help traders make wiser decisions in risk management and trading strategies.
By using the VoWVRA and risk assessment indicators, traders can more accurately assess market risk and make wiser choices in trading decisions.
This TradingView Pine Script is a custom indicator based on the Larry Williams ViX Fix technical indicator, designed to help traders with risk assessment and trading decisions. The Larry Williams ViX Fix indicator is derived from the volatility of the S&P 500 index and is mainly used to display changes in current market sentiment. The indicator determines market volatility by calculating the distance between the highest price, the lowest price, and the closing price. The higher the value of the indicator, the more tense the market sentiment, and the higher the market volatility; conversely, the lower the value, the more stable the market sentiment and the lower the market volatility.
The VoWVRA indicator is based on the Larry Williams ViX Fix indicator, combined with technical indicators such as Bollinger Bands and EMA, to assess market risk. The indicator can be customized with input parameters to suit different markets and investor needs. Using the VoWVRA indicator can help traders make wiser choices in risk control and trading decisions.
In addition, this TradingView Pine Script also includes a risk assessment indicator. The indicator calculates a series of values and then applies the exponential moving average (EMA) to the percentage change between the closing price and the highest and lowest prices within a certain range to determine the safety level. The safety level is then compared to different thresholds to determine the market's risk level. The risk assessment indicator can be customized with input parameters such as risk length, safety length, and EMA length to suit different market conditions and investor preferences. Using the risk assessment indicator can help traders make wiser decisions in risk management and trading strategies.
By using the VoWVRA and risk assessment indicators, traders can more accurately assess market risk and make wiser choices in trading decisions.
Note di rilascio
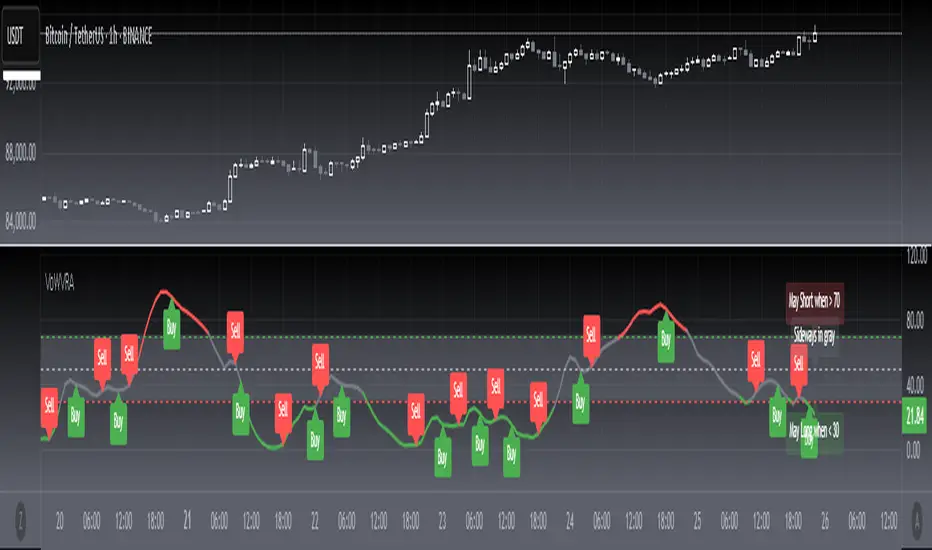
OVERVIEWThe [blackcat] L2 Volatility of Williams VixFix Risk Assessment indicator combines volatility analysis with risk assessment to provide a comprehensive view of market conditions. By integrating the Williams VixFix indicator and custom risk metrics, this tool helps traders identify potential entry and exit points while assessing overall market risk. It plots a merged indicator value along with clear visual cues for buy/sell signals and risk levels 📊💹.
FEATURES
Combines Williams VixFix and custom risk assessment indicators:
Williams VixFix: Analyzes volatility using Bollinger Bands and percentiles.
Risk Assessment: Evaluates market safety levels based on price extremes and EMA.
Normalizes and merges both indicators into a single value for easy interpretation.
Plots the merged indicator value with dynamic colors indicating different risk levels:
Red: High risk (>70).
Green: Low risk (<30).
Gray: Neutral zone (~50).
Displays buy ('Buy') and sell ('Sell') labels based on crossover events 🏷️
Generates alerts for buy and sell signals to notify users of potential trade opportunities 🔔
HOW TO USE
Add the indicator to your TradingView chart by selecting it from the indicators list.
Adjust the parameters for Williams VixFix and Risk Assessment as needed to fine-tune sensitivity ⚙️.
Monitor the plotted merged indicator value and associated labels for trading signals.
Set up alerts based on the generated signals to receive notifications when conditions are met 📲.
Use the risk level indications to manage trades more effectively.
LIMITATIONS
The indicator may generate false signals in highly volatile or ranging markets 🌪️.
Users should combine this indicator with other forms of analysis for more reliable trading decisions.
The effectiveness of the indicator may vary depending on the asset and timeframe being analyzed.
NOTES
Ensure that you have sufficient historical data available for accurate calculations.
Test the indicator thoroughly on demo accounts before applying it to live trading 🔍.
Customize the appearance and parameters as needed to fit your trading strategy.
Script open-source
Nello spirito di TradingView, l'autore di questo script lo ha reso open source, in modo che i trader possano esaminarne e verificarne la funzionalità. Complimenti all'autore! Sebbene sia possibile utilizzarlo gratuitamente, ricordiamo che la ripubblicazione del codice è soggetta al nostro Regolamento.
Declinazione di responsabilità
Le informazioni e le pubblicazioni non sono intese come, e non costituiscono, consulenza o raccomandazioni finanziarie, di investimento, di trading o di altro tipo fornite o approvate da TradingView. Per ulteriori informazioni, consultare i Termini di utilizzo.