OPEN-SOURCE SCRIPT
Stochastic Momentum Index _ UCSgears
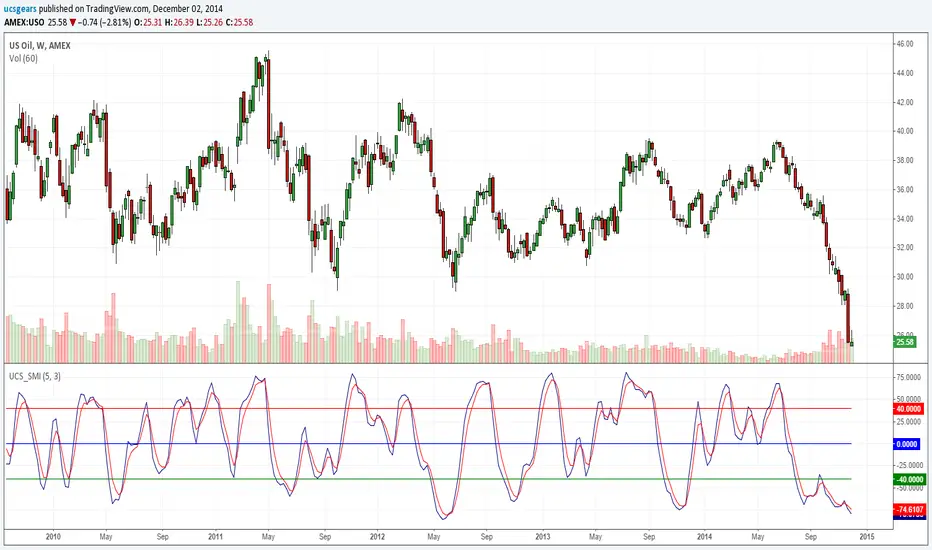
The Stochastic Momentum Index (SMI) was introduced by William Blau in 1993 as a way to clarify the traditional stochastic oscillator. SMI helps you see where the current close has taken place relative to the midpoint of the recent high to low range is based on price change in relation to the range of the price. This is a range based indicator, when used right. It can help momentum changes.
For those looking for help understanding this -
wiki.timetotrade.eu/Stochastic_Momentum_Index
tradingstrategyideas.com/entries/stochastic-momentum-index/
tlc.thinkorswim.com/center/charting/studies/studies-library/R-S/StochasticMomentumIndex.html
sierrachart.com/supportboard/attachment.php?attachmentid=4714&d=1277899234
Script open-source
In pieno spirito TradingView, il creatore di questo script lo ha reso open-source, in modo che i trader possano esaminarlo e verificarne la funzionalità. Complimenti all'autore! Sebbene sia possibile utilizzarlo gratuitamente, ricorda che la ripubblicazione del codice è soggetta al nostro Regolamento.
Uday C Santhakumar
Declinazione di responsabilità
Le informazioni ed i contenuti pubblicati non costituiscono in alcun modo una sollecitazione ad investire o ad operare nei mercati finanziari. Non sono inoltre fornite o supportate da TradingView. Maggiori dettagli nelle Condizioni d'uso.