OPEN-SOURCE SCRIPT
Bostian Intraday Intensity Index (BII)
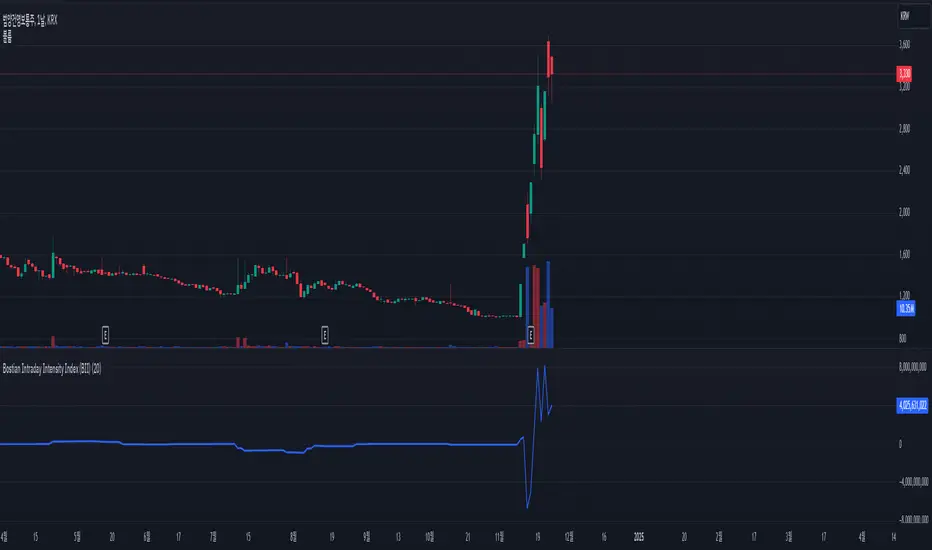
The Bostian Intraday Intensity Index (BII) is a metric used to analyze the trading volume and price movements of a specific stock or asset, measuring the strength and pressure of the market. BII captures buy and sell signals by examining the relationship between trading volume and price fluctuations. Below is an explanation of the key components and calculation method for BII:
○ BII Formula:
sum(V*((C-L)^2-(H-C)^2))/(H-L)))
○ Meaning of the Indicator:
○ How to Use:
The BII indicator is useful for analyzing the strength and pressure of the market through the correlation of price movements and trading volume. It helps investors capture buy and sell signals to make better investment decisions.
○ BII Formula:
sum(V*((C-L)^2-(H-C)^2))/(H-L)))
- V (Volume): Trading volume
- C (Close): Closing price
- L (Low): Lowest price
- H (High): Highest price
○ Meaning of the Indicator:
- Positive Values: When BII is positive, it indicates strong buying pressure. The closer the closing price is to the high, the stronger the buying pressure.
- Negative Values: When BII is negative, it indicates strong selling pressure. The closer the closing price is to the low, the stronger the selling pressure.
○ How to Use:
- Buy Signal: When the BII value is positive and trending upwards, it may be considered a buying opportunity.
- Sell Signal: When the BII value is negative and trending downwards, it may be considered a selling opportunity.
The BII indicator is useful for analyzing the strength and pressure of the market through the correlation of price movements and trading volume. It helps investors capture buy and sell signals to make better investment decisions.
Script open-source
Nello spirito di TradingView, l'autore di questo script lo ha reso open source, in modo che i trader possano esaminarne e verificarne la funzionalità. Complimenti all'autore! Sebbene sia possibile utilizzarlo gratuitamente, ricordiamo che la ripubblicazione del codice è soggetta al nostro Regolamento.
Declinazione di responsabilità
Le informazioni e le pubblicazioni non sono intese come, e non costituiscono, consulenza o raccomandazioni finanziarie, di investimento, di trading o di altro tipo fornite o approvate da TradingView. Per ulteriori informazioni, consultare i Termini di utilizzo.