OPEN-SOURCE SCRIPT
Whisker Reversal Oscillator [SpiritualHealer117]
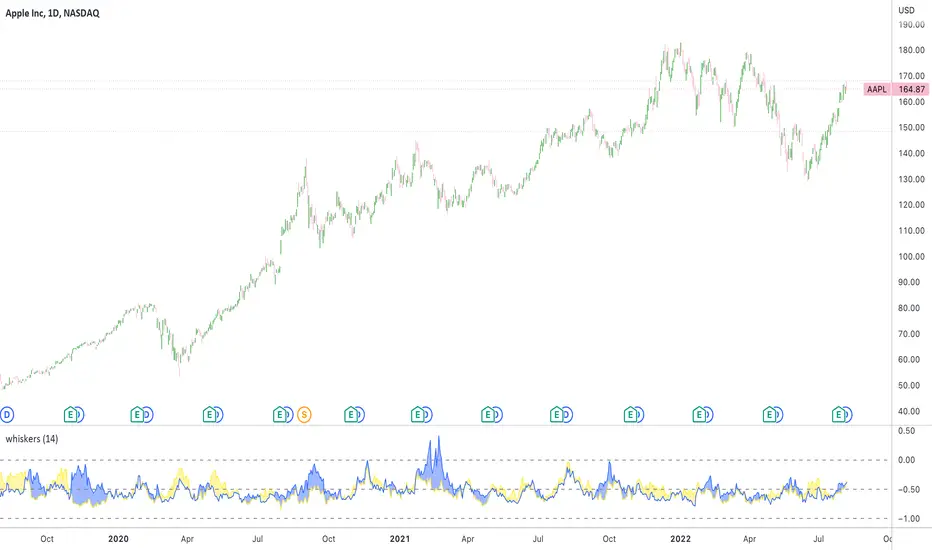
The Whisker Reversal Oscillator can be used to spot strength or weakness in trends. It is designed for stocks, commodities and forex trading, and is intended to be calculated from the high, close, low, and open over a given length.
Features:
The Whisker Reversal Oscillator shows the average length of the top and bottom whiskers on candlesticks over a defined length. It plots the percentage difference between the whiskers and the length of the body, with the yellow line representing the average length of the top whisker, and the bottom line indicating the average length of the bottom whisker.
Interpreting the signals:
The Whisker Reversal Oscillator is interpreted in the same way as a candlestick reversal pattern, where it being bullish or bearish depends on the trend. In a bull trend, if the yellow line passes above the blue line, it means the top whiskers are longer on average than the bottom whiskers, which may show that bulls were too weak to hold a rally, and signal a reversal. On the other hand, in a bear trend, if the yellow line is above the blue line, it indicates that the bulls were able to push the price up, which would be bullish. If the blue line crosses over the yellow line in an uptrend, it's often a bearish sign, but if it happens in a downtrend, its a bullish sign.
Generally speaking, a cross in the lines is indicative of a potential reversal, and when the lines cross over 1, it means that the whiskers were bigger than the candlestick bodies over your selected length, indicating that a big swing will come.
Script open-source
In pieno spirito TradingView, il creatore di questo script lo ha reso open-source, in modo che i trader possano esaminarlo e verificarne la funzionalità. Complimenti all'autore! Sebbene sia possibile utilizzarlo gratuitamente, ricorda che la ripubblicazione del codice è soggetta al nostro Regolamento.
Declinazione di responsabilità
Le informazioni ed i contenuti pubblicati non costituiscono in alcun modo una sollecitazione ad investire o ad operare nei mercati finanziari. Non sono inoltre fornite o supportate da TradingView. Maggiori dettagli nelle Condizioni d'uso.