OPEN-SOURCE SCRIPT
Indexogram
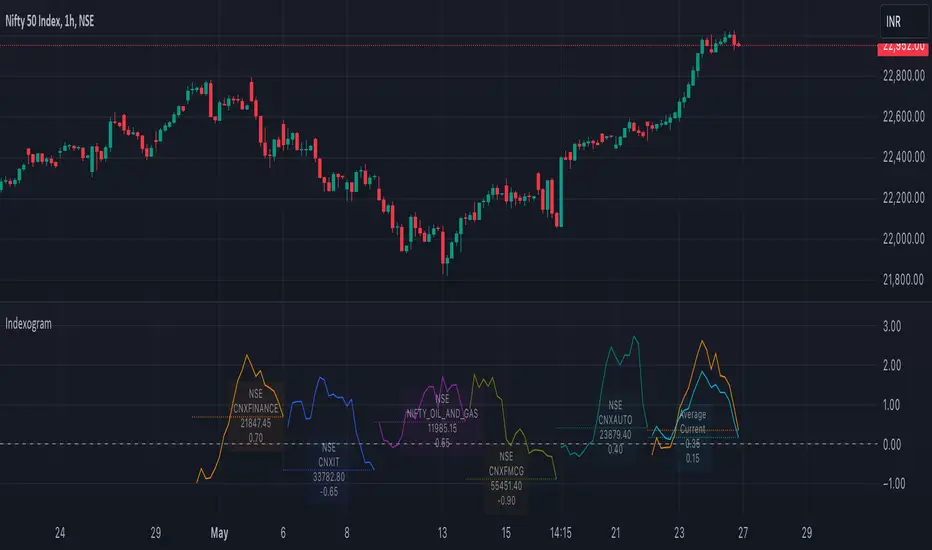
Indexogram is a platform designed to help traders analyze the Commitment of Traders (COT) report data. It specifically focuses on the Rate Of Change (ROC) of the COT data, visualized using a unique polyline plotting technique.
Commitments of Traders % Rate Of Change (%ROC):
The COT %ROC indicates the momentum of trader positions over a specified period. This measure is crucial for understanding shifts in market sentiment and potential future price movements.
Unique Polyline Plotting Technique:
Unlike traditional line or bar charts, the polyline plotting technique used in Indexogram offers a more nuanced and detailed view of the %ROC data.
Multiple Ticker Monitoring:
Indexogram allows the setup of up to five different tickers. Traders can assign different weightages to these tickers, enabling a customized and weighted view of their %ROC data. This feature is beneficial for tracking a diversified portfolio or comparing different assets.
Average ROI Plot:
An additional feature is the Average ROI plot, which provides the average return on investment (ROI) of the five selected tickers. This plot helps traders quickly assess the overall performance of their monitored assets.
Strategy for Traders
Diversified Monitoring:
By setting up five different tickers with varying weightages, traders can diversify their monitoring efforts across different assets or markets. This diversification helps in reducing risk and identifying opportunities in different sectors or asset classes.
Weightage Customization:
Assign weightages based on market conditions or personal trading strategy. For example, if a trader believes that commodities are likely to outperform equities in the near term, they can assign a higher weightage to commodities-related tickers.
Analyzing %ROC Trends:
Use the polyline plots to identify significant %ROC trends. A rising %ROC might indicate increasing momentum and a potential buying opportunity, while a falling %ROC could signal decreasing momentum and a potential selling opportunity.
Average ROI Analysis:
Use the Average ROI plot to gauge the overall performance of the selected assets. If the average ROI is positive and trending upwards, it indicates a generally favorable market condition for the monitored assets.
Tactical Adjustments:
Regularly review and adjust the selected tickers and their weightages based on changing market conditions, news, and personal insights. This flexibility allows traders to adapt their strategy in response to new information.
Important Notes:
Indexogram is a tool to identify potential tradings, not a guaranteed predictor of future price movements.
Script open-source
Nello spirito di TradingView, l'autore di questo script lo ha reso open source, in modo che i trader possano esaminarne e verificarne la funzionalità. Complimenti all'autore! Sebbene sia possibile utilizzarlo gratuitamente, ricordiamo che la ripubblicazione del codice è soggetta al nostro Regolamento.
Declinazione di responsabilità
Le informazioni e le pubblicazioni non sono intese come, e non costituiscono, consulenza o raccomandazioni finanziarie, di investimento, di trading o di altro tipo fornite o approvate da TradingView. Per ulteriori informazioni, consultare i Termini di utilizzo.