OPEN-SOURCE SCRIPT
Aggiornato Student's T-Distribution Bollinger Bands
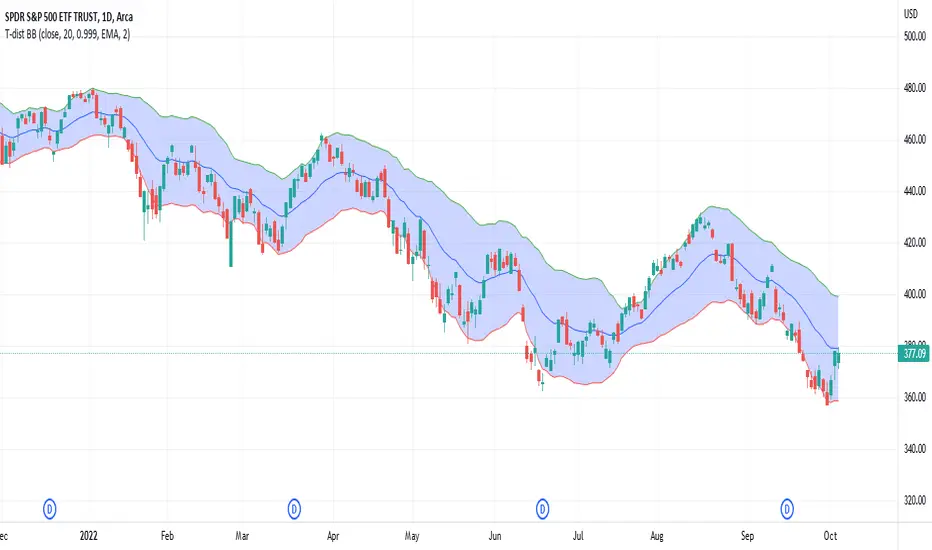
This study shows the prediction interval as Bollinger Bands using Student's T-distribution. This means that the bands will be wider when the data features higher variation, as well as when the sample size (in the form of length) is smaller. The bands will also be wider when the confidence level is lower. The opposite is also true. Assuming we set a confidence level of 0.99 and a source set to the close price, we could reasonably expect that 99% of the time the close price would fall between the upper and lower bounds. Because this is a general statistical method which requires a lot of math, the script has a tendency to be relatively slow, but should be eligible to be used in a wide variety of situations.
Note di rilascio
Updated int types to floats so floor division doesn't cause bands to failScript open-source
In pieno spirito TradingView, il creatore di questo script lo ha reso open-source, in modo che i trader possano esaminarlo e verificarne la funzionalità. Complimenti all'autore! Sebbene sia possibile utilizzarlo gratuitamente, ricorda che la ripubblicazione del codice è soggetta al nostro Regolamento.
Declinazione di responsabilità
Le informazioni ed i contenuti pubblicati non costituiscono in alcun modo una sollecitazione ad investire o ad operare nei mercati finanziari. Non sono inoltre fornite o supportate da TradingView. Maggiori dettagli nelle Condizioni d'uso.
Script open-source
In pieno spirito TradingView, il creatore di questo script lo ha reso open-source, in modo che i trader possano esaminarlo e verificarne la funzionalità. Complimenti all'autore! Sebbene sia possibile utilizzarlo gratuitamente, ricorda che la ripubblicazione del codice è soggetta al nostro Regolamento.
Declinazione di responsabilità
Le informazioni ed i contenuti pubblicati non costituiscono in alcun modo una sollecitazione ad investire o ad operare nei mercati finanziari. Non sono inoltre fornite o supportate da TradingView. Maggiori dettagli nelle Condizioni d'uso.