OPEN-SOURCE SCRIPT
true trend
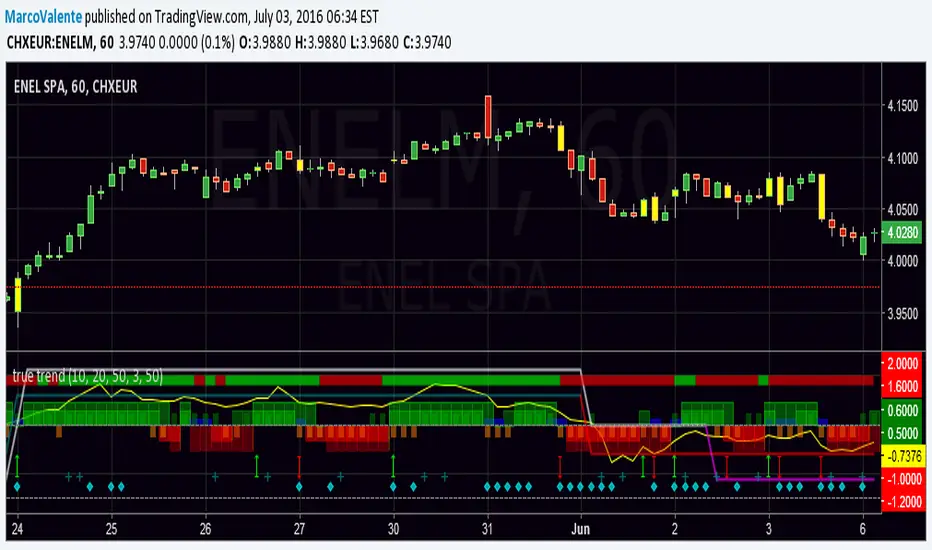
Easy way to look at the Trend , but still accurate. Top bar is DI +, DI - , bars change in yellow when a swing happen, histogram show the increase/decrease of Min and Max and Open-Close; 2 lines moving between +1 and - 1 folloiwng 3 Ema crossing ; a Dot (diamond shape) appear on the botton when volatility increase and finally a " + " show when volume are much bigger the usually. Yellow line on top is Willams % and help us to find top and bottom of the market.
Script open-source
Nello spirito di TradingView, l'autore di questo script lo ha reso open source, in modo che i trader possano esaminarne e verificarne la funzionalità. Complimenti all'autore! Sebbene sia possibile utilizzarlo gratuitamente, ricordiamo che la ripubblicazione del codice è soggetta al nostro Regolamento.
Declinazione di responsabilità
Le informazioni e le pubblicazioni non sono intese come, e non costituiscono, consulenza o raccomandazioni finanziarie, di investimento, di trading o di altro tipo fornite o approvate da TradingView. Per ulteriori informazioni, consultare i Termini di utilizzo.