OPEN-SOURCE SCRIPT
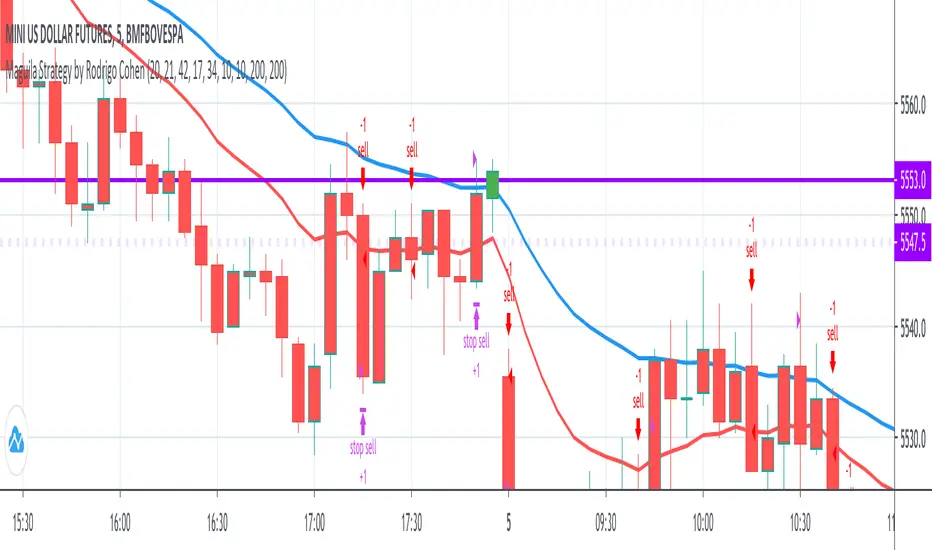
Maguila Strategy by Rodrigo Cohen
READ BEFORE USE!!!
FUTURES: WIN,
WIN,  WDO
WDO
TIME FRAME: 1 Minute (also works in 5 minutes)
INDICATORS: McGinley Dynamic accompanied by the Exponential Moving Average coloring rule of 21 and 42 periods
MARKET TYPE: In trend (up or down)
INPUT:
1. When buying (long) = Market in an upward trend, the average of 21 crosses that of 42 upwards. When the price returns to the average of 21, wait for a positive candle in the Maguila's color and buy a break from the maximum of this signal candle.
*2. On sale (short) = Downtrend market, the average of 21 crosses that of 42 downwards. When the price returns to the average of 21, wait for a negative candle in the Maguila's color and sell when the minimum of this signal candle breaks.
GAIN and LOSS are technical.
DEFAULT VALUES:
Averages:
- 1 minute - EMA 21 and EMA 42
- 5 minute - EMA 17 and EMA 34
Gains and Loss:
-WDO - 10 points
-WIN - 200 points
- !!!ALERT!!!! THIS CODE ONLY WORKS WITH WDO AND WIN, BOTH WITH TIMEFRAMES 1 MINUTE AND 5 MINUTE.
- This is a test to the Maguila strategy created by Rodrigo Cohen.
- This code MUST be validaded by Rodrigo Cohen, use ONLY for tests.
- Some results are different from Cohen's videos, so the McGuinley indicator needs some ajustments.
FUTURES:
TIME FRAME: 1 Minute (also works in 5 minutes)
INDICATORS: McGinley Dynamic accompanied by the Exponential Moving Average coloring rule of 21 and 42 periods
MARKET TYPE: In trend (up or down)
INPUT:
1. When buying (long) = Market in an upward trend, the average of 21 crosses that of 42 upwards. When the price returns to the average of 21, wait for a positive candle in the Maguila's color and buy a break from the maximum of this signal candle.
*2. On sale (short) = Downtrend market, the average of 21 crosses that of 42 downwards. When the price returns to the average of 21, wait for a negative candle in the Maguila's color and sell when the minimum of this signal candle breaks.
GAIN and LOSS are technical.
DEFAULT VALUES:
Averages:
- 1 minute - EMA 21 and EMA 42
- 5 minute - EMA 17 and EMA 34
Gains and Loss:
-
-
Script open-source
Nello spirito di TradingView, l'autore di questo script lo ha reso open source, in modo che i trader possano esaminarne e verificarne la funzionalità. Complimenti all'autore! Sebbene sia possibile utilizzarlo gratuitamente, ricordiamo che la ripubblicazione del codice è soggetta al nostro Regolamento.
Declinazione di responsabilità
Le informazioni e le pubblicazioni non sono intese come, e non costituiscono, consulenza o raccomandazioni finanziarie, di investimento, di trading o di altro tipo fornite o approvate da TradingView. Per ulteriori informazioni, consultare i Termini di utilizzo.