OPEN-SOURCE SCRIPT
FIRST-HOUR TOOL V.1.8.08.23
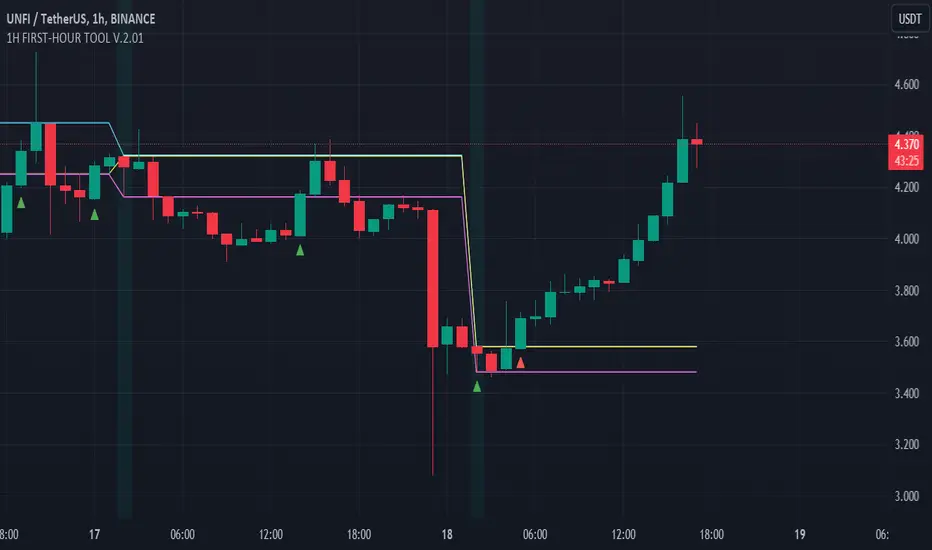
Three horizontal lines are drawn on the chart to represent session prices. These prices are calculated based on the user-specified session:
"FirstHour Session High" represents the highest price reached during the firsthour session.
"FirstHour Session Open" represents the opening price of the firsthour session
"FirstHour Session Low" represents the lowest price reached during the firsthour session.
These prices are respectively colored with light blue, light yellow, and light pink.
The chart background can change color based on whether the current time is within the specified session. If the current time is within the session, the background will be colored in semi-transparent aqua green. Otherwise, it will remain transparent.
Upward-pointing triangle markers are used to highlight points where the closing price crosses above (crossover) or below (crossunder) the session levels.
These markers appear below the corresponding bar.
They are colored based on the type of crossover:
Yellow for crossover above the "FirstHour High"
Red for crossover above the "FirstHour Open"
Green for crossover above the "FirstHour Low"
Alerts:
Alert messages are generated when crossovers or crossunders of the closing price relative to the session levels occur.
The alerts appear once per bar. Alerts are generated for the following events:
Crossover of the price above the "Session High" with the message "High First Hour Crossover."
Crossunder of the price below the "Session Open" with the message "Open First Hour Crossunder."
Crossunder of the price below the "Session Low" with the message "Low First Hour Crossunder."
Crossover of the price above the "Session Low" with the message "Low First Hour Crossover."
In summary, this indicator provides a visual representation of session prices and events, helping traders spot significant crossovers and crossunders relative to key price levels.
Author tumiza999
Script open-source
Nello spirito di TradingView, l'autore di questo script lo ha reso open source, in modo che i trader possano esaminarne e verificarne la funzionalità. Complimenti all'autore! Sebbene sia possibile utilizzarlo gratuitamente, ricordiamo che la ripubblicazione del codice è soggetta al nostro Regolamento.
Declinazione di responsabilità
Le informazioni e le pubblicazioni non sono intese come, e non costituiscono, consulenza o raccomandazioni finanziarie, di investimento, di trading o di altro tipo fornite o approvate da TradingView. Per ulteriori informazioni, consultare i Termini di utilizzo.