PROTECTED SOURCE SCRIPT
Aggiornato Daily Gain/Loss Statistics by Day of Week
Daily Gain/Loss Statistics by Day of Week
Overview
This Pine Script indicator analyzes historical price data to provide comprehensive day-of-week performance statistics, helping traders identify patterns and optimize their trading strategies based on which days historically perform better or worse.
Key Features
📊 Day-of-Week Analysis
7-day breakdown showing Monday through Sunday statistics
Average Gain % - Average percentage gains on winning days for each day of the week
Average Loss % - Average percentage losses on losing days (displayed with minus sign)
Median High % - Typical percentage move from open to daily high
Median Low % - Typical percentage move from open to daily low
🎯 Visual Performance Indicators
🚀 Rocket symbol - Marks the best performing day (highest average gains)
🔻 Red triangle down - Marks the worst performing day (lowest average gains)
Current day highlighting - Today's row highlighted in yellow (#ffdd444b)
⚡ Real-Time Session Tracking
Current Session row - Shows today's performance percentage in real-time
Color-coded gains/losses - Green for positive, red for negative
🎨 Professional Themes
⚙️ Customization Options
Date range selection - Choose specific time periods for analysis
Table positioning - 9 different screen positions
Table sizing - 6 size options from tiny to huge
Timeframe protection - Works only on 1D timeframe with user-friendly warnings
How It Works
Data Collection - Analyzes daily OHLC data within your selected date range
Day Classification - Categorizes each trading day by day of the week
Statistical Calculation - Computes averages and medians for each day type
Performance Ranking - Identifies best and worst performing days
Real-Time Display - Shows current session performance vs historical patterns
Trading Applications
Entry/Exit Timing - Identify optimal days for opening/closing positions
Risk Management - Avoid trading on historically poor-performing days
Strategy Optimization - Align trading strategies with day-of-week patterns
Market Timing - Understand weekly market cycles and seasonality
This indicator transforms raw price data into actionable intelligence, helping traders make more informed decisions based on proven historical day-of-week performance patterns.
Note di rilascio
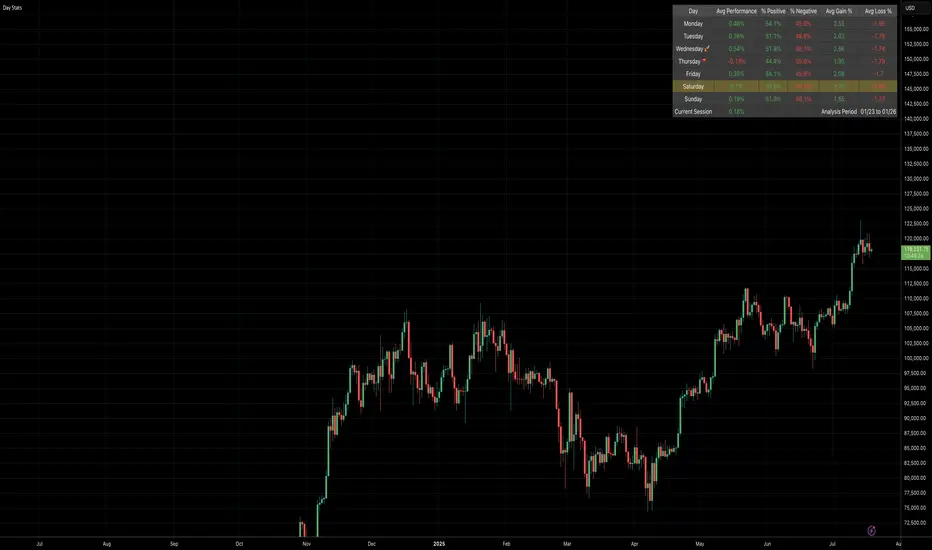
Added "Analysis Period" into the table so you can easily identify the rangeNote di rilascio
🎯 Core Statistics Displayed:1. Best/Worst Day Indicators:
🚀 Rocket: Day with highest overall average performance
🔻 Red Triangle: Day with lowest overall average performance
Based on net average daily performance (gains + losses combined)
2. Essential Columns (Default ON):
Day: Day of week with performance indicators
Avg Performance: Net daily performance including all gains/losses
% Positive: Percentage of time each day ends positive
% Negative: Percentage of time each day ends negative
Avg Gain %: Average gain when day is positive
Avg Loss %: Average loss when day is negative
3. Optional Intraday Columns (Default OFF):
Median High %: Median daily high vs open
Median Low %: Median daily low vs open
Note di rilascio
.Script protetto
Questo script è pubblicato come codice protetto. Tuttavia, è possibile utilizzarle liberamente e senza alcuna limitazione – ulteriori informazioni qui.
Declinazione di responsabilità
Le informazioni e le pubblicazioni non sono intese come, e non costituiscono, consulenza o raccomandazioni finanziarie, di investimento, di trading o di altro tipo fornite o approvate da TradingView. Per ulteriori informazioni, consultare i Termini di utilizzo.
Script protetto
Questo script è pubblicato come codice protetto. Tuttavia, è possibile utilizzarle liberamente e senza alcuna limitazione – ulteriori informazioni qui.
Declinazione di responsabilità
Le informazioni e le pubblicazioni non sono intese come, e non costituiscono, consulenza o raccomandazioni finanziarie, di investimento, di trading o di altro tipo fornite o approvate da TradingView. Per ulteriori informazioni, consultare i Termini di utilizzo.