OPEN-SOURCE SCRIPT
Standard Deviation W/Q/M Pivots
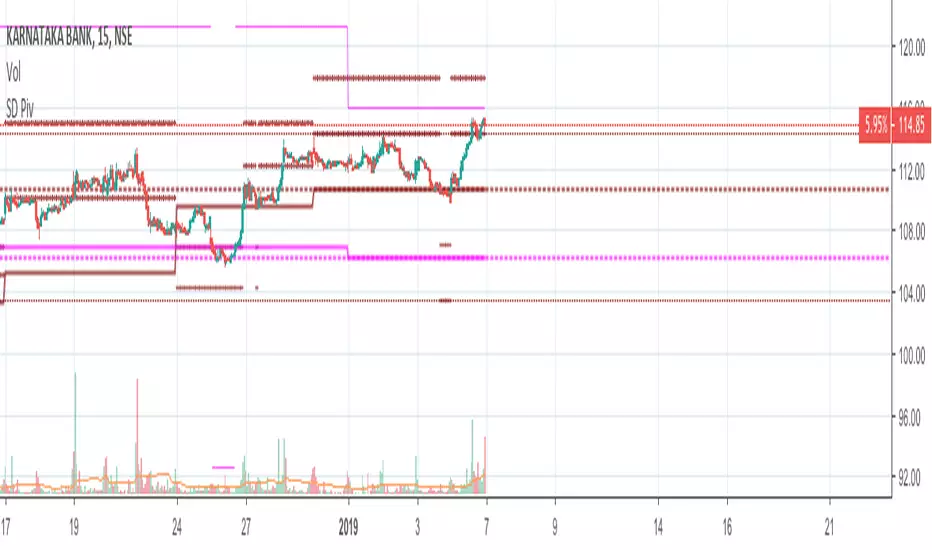
This is a re-iteration of the standard deviation of daily pivots with the pivots applied on weekly, monthly, quarterly and yearly levels. For intraday traders the weekly pivot points will act as a major support resistance levels. Quarterly and monthly pivot points are useful for short-term positions while the yearly pivot determines the stock's long term support-resistance levels and useful in determining if the stock is in a bullish/bearish leg.
Script open-source
Nello spirito di TradingView, l'autore di questo script lo ha reso open source, in modo che i trader possano esaminarne e verificarne la funzionalità. Complimenti all'autore! Sebbene sia possibile utilizzarlo gratuitamente, ricordiamo che la ripubblicazione del codice è soggetta al nostro Regolamento.
Declinazione di responsabilità
Le informazioni e le pubblicazioni non sono intese come, e non costituiscono, consulenza o raccomandazioni finanziarie, di investimento, di trading o di altro tipo fornite o approvate da TradingView. Per ulteriori informazioni, consultare i Termini di utilizzo.