OPEN-SOURCE SCRIPT
Tops & Bottoms - Day of Week Report
█ OVERVIEW
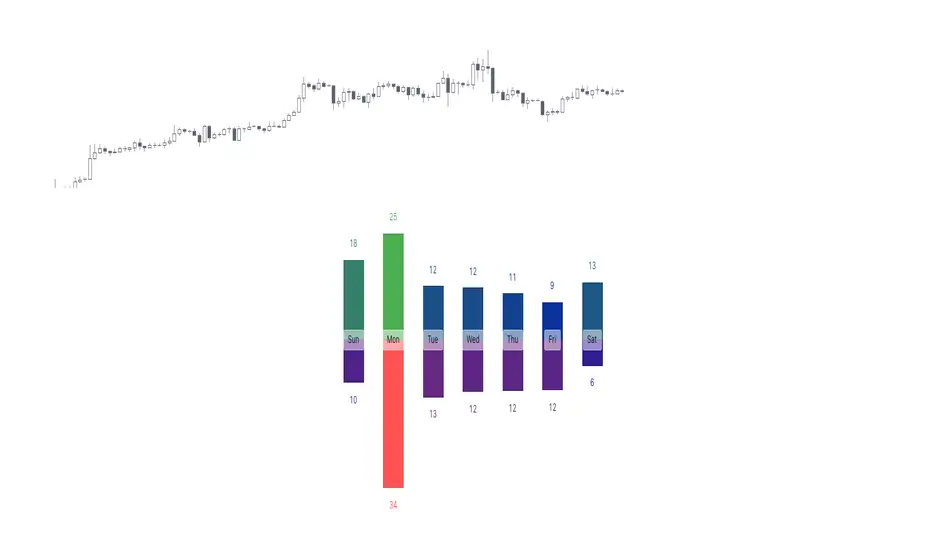
The indicator tracks when the weekly tops and bottoms occur and reports the statistics by the days of the week.
█ CONCEPTS
Not all the days of the week are equal, and the market dynamic can follow through or shift over the trading week. Tops and bottoms are vital when entering a trade, as they will decide if you are catching the train or being straight offside. They are equally crucial when exiting a position, as they will determine if you are closing at the optimal price or seeing your unrealized profits vanish.
This indicator is before all for educational purposes. It aims to make the knowledge available to all traders, facilitate understanding of the various markets, and ultimately get to know your trading pairs by heart (and saving a lot of your time backtesting!).

USDJPY tops and bottoms percentages on any given week.

USDJPY tops and bottoms percentages on up weeks versus down weeks.
█ FEATURES
Custom interval
By default, the indicator uses the weekly interval defined by the symbol (e.g., Monday to Sunday). This option allows you to specify your custom interval.
Weekly interval type filter
Analyze the weekly interval on any weeks, up weeks, or down weeks.
Configurable time range filter
Select the period to report from.
█ NOTES
Trading session
The indicator analyzes the days of the week from the daily chart. The daily trading sessions are defined by the symbol (e.g., 17:00 - 17:00 on EURUSD).
Extended/electronic trading session
The indicator can include the extended hours when activated on the chart, using the 24-hour or 1440-minute timeframe.
█ HOW TO USE
Plot the indicator and navigate on the 1-day or 24-hour timeframe.
The indicator tracks when the weekly tops and bottoms occur and reports the statistics by the days of the week.
█ CONCEPTS
Not all the days of the week are equal, and the market dynamic can follow through or shift over the trading week. Tops and bottoms are vital when entering a trade, as they will decide if you are catching the train or being straight offside. They are equally crucial when exiting a position, as they will determine if you are closing at the optimal price or seeing your unrealized profits vanish.
This indicator is before all for educational purposes. It aims to make the knowledge available to all traders, facilitate understanding of the various markets, and ultimately get to know your trading pairs by heart (and saving a lot of your time backtesting!).
USDJPY tops and bottoms percentages on any given week.
USDJPY tops and bottoms percentages on up weeks versus down weeks.
█ FEATURES
Custom interval
By default, the indicator uses the weekly interval defined by the symbol (e.g., Monday to Sunday). This option allows you to specify your custom interval.
Weekly interval type filter
Analyze the weekly interval on any weeks, up weeks, or down weeks.
Configurable time range filter
Select the period to report from.
█ NOTES
Trading session
The indicator analyzes the days of the week from the daily chart. The daily trading sessions are defined by the symbol (e.g., 17:00 - 17:00 on EURUSD).
Extended/electronic trading session
The indicator can include the extended hours when activated on the chart, using the 24-hour or 1440-minute timeframe.
█ HOW TO USE
Plot the indicator and navigate on the 1-day or 24-hour timeframe.
Script open-source
In pieno spirito TradingView, il creatore di questo script lo ha reso open-source, in modo che i trader possano esaminarlo e verificarne la funzionalità. Complimenti all'autore! Sebbene sia possibile utilizzarlo gratuitamente, ricorda che la ripubblicazione del codice è soggetta al nostro Regolamento.
🌟 Listed as "Trusted Pine Programmer"
👨💻 Coding services: sbtnc.dev/hire-pine-script-developer
🔒 Premium indicators: sbtnc.gumroad.com
☕️ Tip: buymeacoffee.com/sbtnc
👨💻 Coding services: sbtnc.dev/hire-pine-script-developer
🔒 Premium indicators: sbtnc.gumroad.com
☕️ Tip: buymeacoffee.com/sbtnc
Declinazione di responsabilità
Le informazioni ed i contenuti pubblicati non costituiscono in alcun modo una sollecitazione ad investire o ad operare nei mercati finanziari. Non sono inoltre fornite o supportate da TradingView. Maggiori dettagli nelle Condizioni d'uso.