The Minervini Qualifier indicator calculates the qualifying conditions from Mark Minervini’s book “Trade like a Stock Market Wizard”.
The condition matching is been shown as fill color inside an SMA 20day envelope curve.
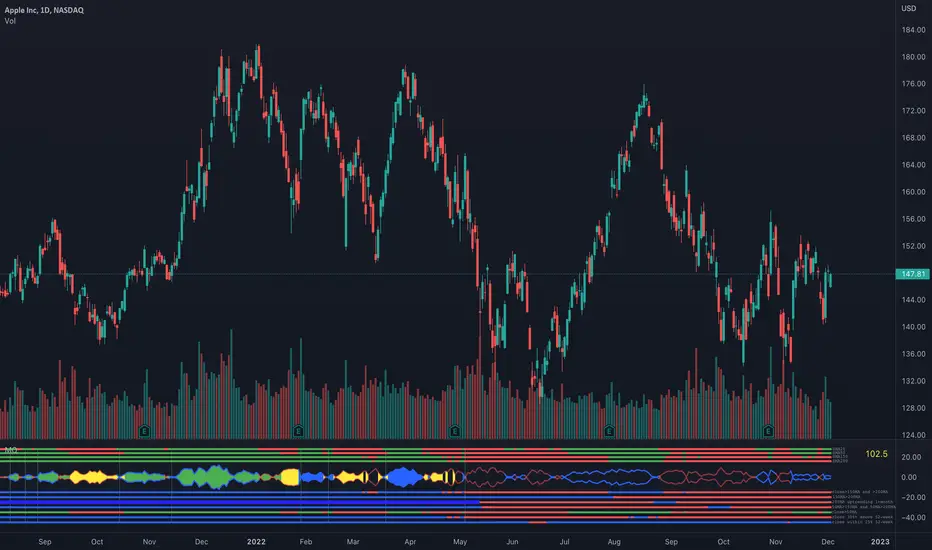
If the envelope color is red, current close price is below the SMA20 and when blue, current close price is above the SMA20. The fill color can be transparent (not matching qualifying conditions), yellow (matching all conditions except close is still below SMA50), green (all conditions match, SMA200 trending for at least one month up) or blue (all conditions match, SMA200 trending up for at least 5 months)
As I wanted also to see which of the qualifying conditions match over time, I’ve added add. lines, each representing one conditions. If it matches, line color is blue, or red if not. Use the data windows (right side), so you know what line represents which condition. Can be turned on/off (default:on)
In addition, a relative strength is been calculated, to compare the stock to a reference index. It is just one possible way to calculate it, might be different to what Mark Minervini is using. If the shown value (top right) is above 100, stock performs better compared to reference index (can be set in settings), when below 100, stock performs worse compared to reference index. Can be turned on/off (default:on)
How to use it:
For more details, read Mark’s book and watch his videos.
Limitations:
It gives only useful information on daily timeframe
(No financial advise, for testing purposes only)
The condition matching is been shown as fill color inside an SMA 20day envelope curve.
If the envelope color is red, current close price is below the SMA20 and when blue, current close price is above the SMA20. The fill color can be transparent (not matching qualifying conditions), yellow (matching all conditions except close is still below SMA50), green (all conditions match, SMA200 trending for at least one month up) or blue (all conditions match, SMA200 trending up for at least 5 months)
As I wanted also to see which of the qualifying conditions match over time, I’ve added add. lines, each representing one conditions. If it matches, line color is blue, or red if not. Use the data windows (right side), so you know what line represents which condition. Can be turned on/off (default:on)
In addition, a relative strength is been calculated, to compare the stock to a reference index. It is just one possible way to calculate it, might be different to what Mark Minervini is using. If the shown value (top right) is above 100, stock performs better compared to reference index (can be set in settings), when below 100, stock performs worse compared to reference index. Can be turned on/off (default:on)
How to use it:
For more details, read Mark’s book and watch his videos.
Limitations:
It gives only useful information on daily timeframe
(No financial advise, for testing purposes only)
Note di rilascio
New revision:- added SMA20 (configurable), SMA50, SMA150 and SMA200 lines above the envelope curve.
Color coding: green means close is above SMA, red means close is below SMA. Can be turned on/off.
- some code cleanup
Note di rilascio
- added some alerts - when Minervini conditions are met
- when Minervini conditions are not met any longer
- potential buy signal - SMA200 crossover and Minervini conditions (at least light) are met
- strong uptrend signal when close is xx% (setting) above 52week low
- Potential buy signal is drawn as vertical green line (can be switched on/off, default on)
- added label (can be switched on/off, default off) next to the vertical lines for better understanding / identification
- changed default Reference ticker IDs
Note di rilascio
Typo correction
Known bug: label doesn't stay stable left aligned on the lines below the envelope curve (no idea why this is the case)
Script open-source
In pieno spirito TradingView, il creatore di questo script lo ha reso open-source, in modo che i trader possano esaminarlo e verificarne la funzionalità. Complimenti all'autore! Sebbene sia possibile utilizzarlo gratuitamente, ricorda che la ripubblicazione del codice è soggetta al nostro Regolamento.
Declinazione di responsabilità
Le informazioni ed i contenuti pubblicati non costituiscono in alcun modo una sollecitazione ad investire o ad operare nei mercati finanziari. Non sono inoltre fornite o supportate da TradingView. Maggiori dettagli nelle Condizioni d'uso.