PROTECTED SOURCE SCRIPT
Aggiornato 📱 Mobile EMA + V2L5 (edegrano)
User Manual: Mobile EMA + V2 (edegrano)
Overview
This TradingView indicator combines EMA bias analysis and multi-timeframe linear regression trendlines with key crossover signals, displayed both on the chart and summarized in a colour-coded table for quick decision-making on mobile devices or desktops.
Inputs
Input Name Description Default
Custom EMA Timeframe Timeframe used to calculate EMA 50, 100, 200 "1" (1m)
Show EMAs on Chart Toggle to plot EMAs (50-blue, 100-black, 200-red) true
Linear Regression Length Period length for linear regression trendlines 20
Show EMA 50 > EMA 200 Bias Show EMA bias row in the table (Bullish/Bearish) true
Show Trendline Slope Bias Show trendline slope bias row in the table true
Price Distance % from Cross Percentage distance used to calculate above/below cross prices in table 2.0
What It Shows
On Chart:
EMA 50 (blue), EMA 100 (black), EMA 200 (red) lines
Vertical lines at EMA 50/200 crossover bars (blue for bullish, red for bearish)
Labels “Bull Cross” or “Bear Cross” on crossover bars
Signal dots (up to 3 consecutive strong buy or sell signals)
Table (bottom-left corner):
Row Description
EMA 50 > EMA 200 Bullish if EMA 50 is above EMA 200, Bearish otherwise (colored green/red text)
Trendline slope Bullish if all 1m, 3m, 5m regression slopes are up, Bearish if all down, Neutral otherwise (green/red/gray text)
Last EMA Cross Price Price where EMA 50 and EMA 200 last crossed (light blue text)
+% Above Cross Price percentage above last EMA cross price (dark orange text)
-% Below Cross Price percentage below last EMA cross price (red text)
Final Suggestion Overall signal: “Strong Buy 💎”, “Strong Sell 💎”, or “Mixed / Neutral” with green/red/gray background
How To Use
Set your preferred timeframe for EMA calculations using the Custom EMA Timeframe input. The default is 1 minute.
Enable or disable EMAs and table rows as you prefer with toggles.
Watch the table for quick bias and trend signals with color-coded text for easy interpretation.
Use the Last EMA Cross Price and the above/below percentage price points to identify key levels for entries, stops, or take profits.
Monitor the chart for EMA crossover vertical lines and labels to confirm signals visually.
Strong Buy or Sell dots indicate good entry opportunities — limited to 3 per consecutive trend.
Tips
Adjust the Price Distance % input to increase/decrease sensitivity of above/below price levels.
Combine this indicator with volume, price action, or other tools for best results.
Use on mobile or desktop with the compact table to stay informed without clutter.
Note di rilascio
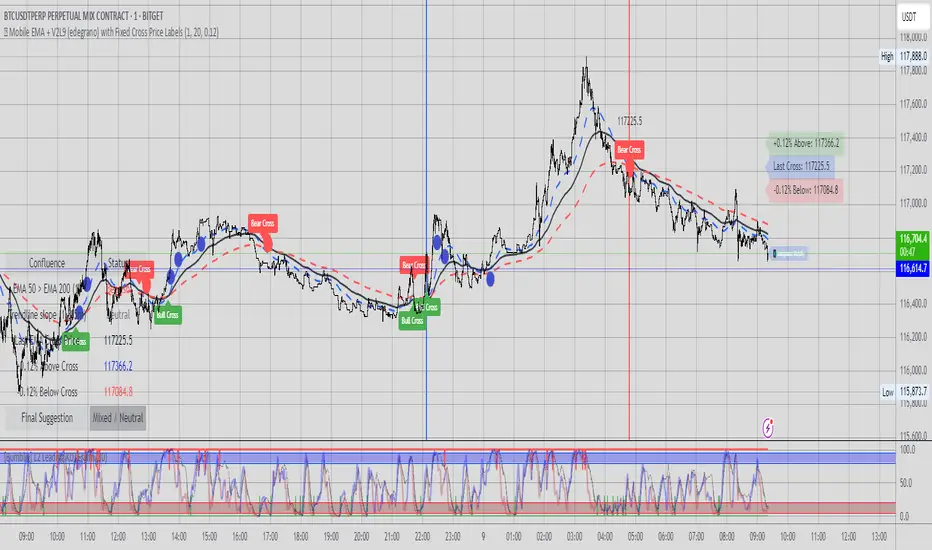
User Manual for 📱 Mobile EMA + V2L8 (edegrano)Overview
This TradingView indicator combines EMA crossover signals, multi-timeframe regression trendlines, and price annotations for your trading convenience. It’s designed to work well on mobile and desktop.
Inputs
Custom EMA Timeframe (userTF)
Select the timeframe for calculating EMA 50, 100, and 200 (default: 1-minute).
Show EMAs on Chart (showEMA)
Toggle to display or hide the EMA lines on the chart.
Linear Regression Length (regLen)
Number of bars used in calculating linear regression trendlines (default: 20).
Show EMA 50 > EMA 200 Bias (showRowEMA50)
Toggle to show the EMA bias status in the info table.
Show Trendline Slope Bias (showRowTrend)
Toggle to show the combined slope bias of three regression lines (1, 3, 5-minute).
Price Distance % from Cross (percentDist)
Sets the percentage distance above and below the last EMA cross price to calculate the “above” and “below” reference prices (default: 0.12%).
Features
EMA 50, 100, 200 lines plotted on your selected timeframe.
Linear Regression Trendlines calculated on fixed 1, 3, and 5-minute timeframes to help identify slope bias.
EMA Crossover Detection:
Bull Cross: EMA 50 crosses above EMA 200
Bear Cross: EMA 50 crosses below EMA 200
Fixed Price Labels on the chart showing:
Last EMA Cross price
Price above last cross by the specified %
Price below last cross by the specified %
These labels are anchored 5 bars to the left and stay fixed at those prices for reference.
Vertical Lines and Labels marking crossover bars:
Blue vertical line and “Bull Cross” label on bullish EMA crosses
Red vertical line and “Bear Cross” label on bearish EMA crosses
Signal Dots: Up to 3 "Strong Buy" or "Strong Sell" dots plotted below/above bars when EMA bias and trendline bias align strongly.
Info Table: Displays all key confluences, last cross price, above/below prices, and final suggestion in an easy-to-read format at the bottom left corner.
How to Use
Set your preferred EMA timeframe (usually your trading timeframe or 1-minute for scalping).
Adjust percentDist to set how far the "above" and "below" price levels should be from the last cross price.
Toggle visibility of EMAs, EMA bias, and trendline slope bias info in the table.
Watch the chart for EMA crosses:
Vertical lines and labels highlight the exact crossover bars.
Fixed price labels show your reference levels for stop loss or entry zones.
Use the signal dots and final suggestion in the table as additional confirmation for potential entries/exits.
The info table summarizes all critical confluences and updates on the latest bar.
Notes
The fixed price labels are anchored 5 bars to the left of the current bar, so they stay visible but don’t clutter the latest price action.
The indicator is optimized for mobile view but also fully functional on desktop.
Adjust input settings to suit your trading style and timeframe.
Script protetto
Questo script è pubblicato come codice protetto. Tuttavia, è possibile utilizzarle liberamente e senza alcuna limitazione – ulteriori informazioni qui.
Declinazione di responsabilità
Le informazioni e le pubblicazioni non sono intese come, e non costituiscono, consulenza o raccomandazioni finanziarie, di investimento, di trading o di altro tipo fornite o approvate da TradingView. Per ulteriori informazioni, consultare i Termini di utilizzo.