OPEN-SOURCE SCRIPT
Aggiornato Diagonal Support and Resistance Trend Lines
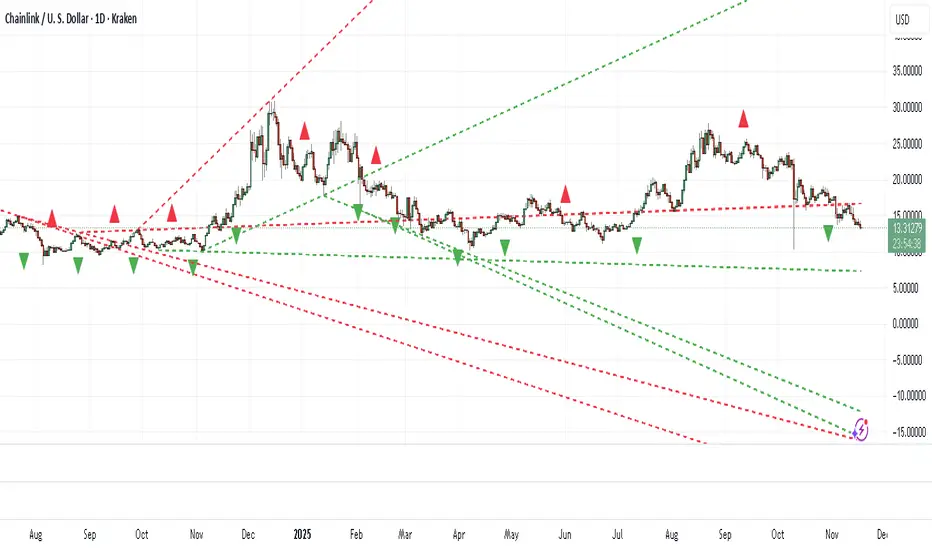
A simple indicator to plot trend lines.
1. Adjust the "Pivot Lookback" (default: 20) to control pivot sensitivity. Larger values detect more significant pivots.
2. Adjust the "Max Trend Lines" (default: 4) to control how many support/resistance lines are drawn.
The indicator will plot:
1. Red dashed lines for resistance (based on pivot highs).
2. Green dashed lines for support (based on pivot lows).
3. Small red triangles above bars for pivot highs and green triangles below bars for pivot lows.
Note di rilascio
Updated to v6 and added option to display dotted, dash, or solid lines.Note di rilascio
EditNote di rilascio
You can now set the thickness of trend line.Script open-source
Nello spirito di TradingView, l'autore di questo script lo ha reso open source, in modo che i trader possano esaminarne e verificarne la funzionalità. Complimenti all'autore! Sebbene sia possibile utilizzarlo gratuitamente, ricordiamo che la ripubblicazione del codice è soggetta al nostro Regolamento.
Declinazione di responsabilità
Le informazioni e le pubblicazioni non sono intese come, e non costituiscono, consulenza o raccomandazioni finanziarie, di investimento, di trading o di altro tipo fornite o approvate da TradingView. Per ulteriori informazioni, consultare i Termini di utilizzo.
Script open-source
Nello spirito di TradingView, l'autore di questo script lo ha reso open source, in modo che i trader possano esaminarne e verificarne la funzionalità. Complimenti all'autore! Sebbene sia possibile utilizzarlo gratuitamente, ricordiamo che la ripubblicazione del codice è soggetta al nostro Regolamento.
Declinazione di responsabilità
Le informazioni e le pubblicazioni non sono intese come, e non costituiscono, consulenza o raccomandazioni finanziarie, di investimento, di trading o di altro tipo fornite o approvate da TradingView. Per ulteriori informazioni, consultare i Termini di utilizzo.