OPEN-SOURCE SCRIPT
Aggiornato Normalized Dist from 4H MA200 + Chart Highlights
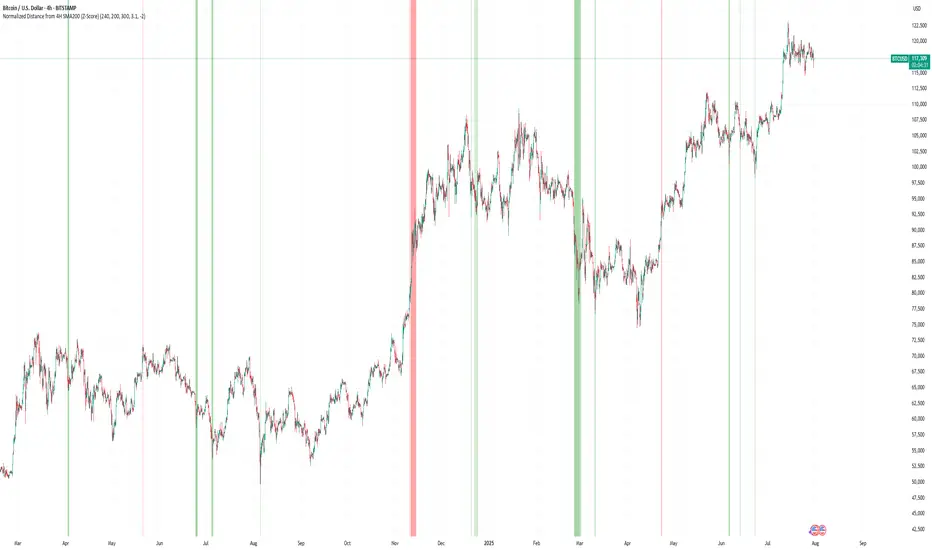
Normalized Distance from 4H EMA200 + Highlighting Extremes
This indicator measures the distance between the current price and the 4-hour EMA200, normalized into a z-score to detect statistically significant deviations.
🔹 The lower pane shows the normalized z-score.
🔹 Green background = price far below EMA200 (z < -2).
🔹 Red background = price far above EMA200 (z > 3.1).
🔹 These thresholds are user-configurable.
🔹 On the main chart:
🟥 Red candles indicate overheated prices (z > upper threshold)
🟩 Green candles signal oversold conditions (z < lower threshold)
The EMA200 is always taken from a fixed 4H timeframe, regardless of your current chart resolution.
Note di rilascio
Normalized Distance from 4H EMA200 + Highlighting ExtremesThis indicator measures the distance between the current price and the 4-hour EMA200, normalized into a z-score to detect statistically significant deviations.
🔹 The lower pane shows the normalized z-score.
🔹 Green background = price far below EMA200 (z < -2).
🔹 Red background = price far above EMA200 (z > 3.1).
🔹 These thresholds are user-configurable.
🔹 On the main chart:
🟥 Red candles indicate overheated prices (z > upper threshold)
🟩 Green candles signal oversold conditions (z < lower threshold)
The EMA200 is always taken from a fixed 4H timeframe, regardless of your current chart resolution.
Script open-source
Nello spirito di TradingView, l'autore di questo script lo ha reso open source, in modo che i trader possano esaminarne e verificarne la funzionalità. Complimenti all'autore! Sebbene sia possibile utilizzarlo gratuitamente, ricordiamo che la ripubblicazione del codice è soggetta al nostro Regolamento.
Declinazione di responsabilità
Le informazioni e le pubblicazioni non sono intese come, e non costituiscono, consulenza o raccomandazioni finanziarie, di investimento, di trading o di altro tipo fornite o approvate da TradingView. Per ulteriori informazioni, consultare i Termini di utilizzo.