OPEN-SOURCE SCRIPT
sma RSI & sudden buy and sell Strategy v1
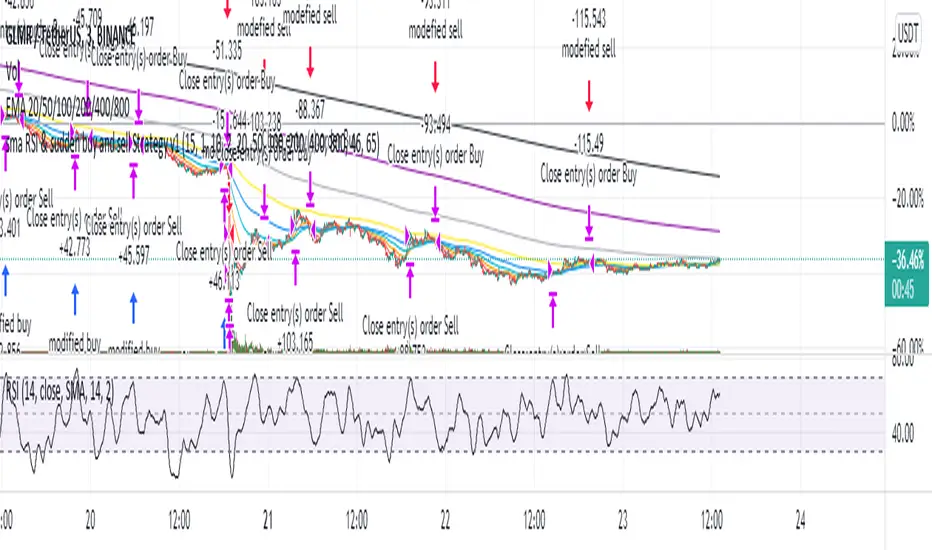
This strategy uses mostly three things:-
1. average RSI (sma rsi over a period)
2. sudden buy and sudden sell (usually to infer the change in trend or direction)
3. various EMAs ( used as a filter)
I mostly build it to work on a 3min crypto chart but it should work on any timeframe or any symbol.
Settings - Length -RSI length (hardly needed to be changed but sometimes it doubles the net profit)(+/-2)
instant length - a sudden increase or decrease in the price calculated by the length of RSI (+/-10)
Bars - No of candles to verify before starting /closing the strategy (+/-20)
Lookbackno2- another variable to verify ema opening/closing (hardly needed to change)
emas - values of different EMAs (you can change if you want but I don't recommend it though)
over40 and over60 - the value of overbuying and overselling(+/-10)
In future, I will probably add ADX or use machine learning to filter out results
It works well considering 0.05% commission per entry and exit (total of 1% per trade)
you can message me for any query or suggestions.
Script open-source
Nello spirito di TradingView, l'autore di questo script lo ha reso open source, in modo che i trader possano esaminarne e verificarne la funzionalità. Complimenti all'autore! Sebbene sia possibile utilizzarlo gratuitamente, ricordiamo che la ripubblicazione del codice è soggetta al nostro Regolamento.
Declinazione di responsabilità
Le informazioni e le pubblicazioni non sono intese come, e non costituiscono, consulenza o raccomandazioni finanziarie, di investimento, di trading o di altro tipo fornite o approvate da TradingView. Per ulteriori informazioni, consultare i Termini di utilizzo.