OPEN-SOURCE SCRIPT
WiseOwl Indicator - 1.0
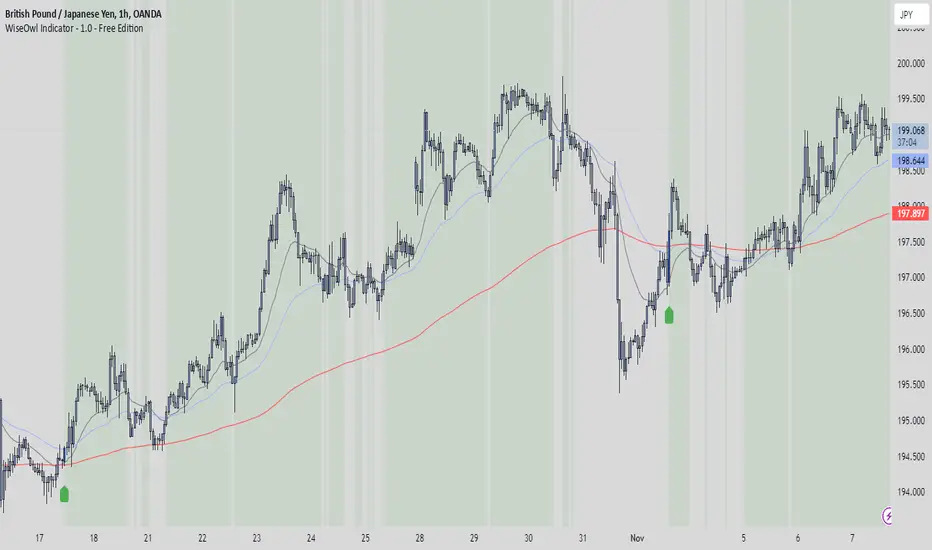
The WiseOwl Indicator - 1.0 is a technical analysis tool designed to help traders identify potential entry points and market trends based on Exponential Moving Averages (EMAs) across multiple timeframes. It focuses on providing clear visual cues for bullish and bearish market conditions, as well as potential breakout opportunities.
Key Features
Multi-Timeframe EMA Analysis: Calculates EMAs on the current timeframe, Daily timeframe, and 15-minute timeframe to confirm trends.
Bullish and Bearish Market Identification: Determines market conditions based on the 200-period EMA on the Daily timeframe.
Directional Candle Coloring: Highlights candles based on their position relative to EMAs to provide immediate visual feedback.
Entry Signals: Plots buy and sell signals on the chart when specific conditions are met on the 1-hour and 4-hour timeframes.
Breakout Candle Highlighting: Colors candles differently when significant price movements occur, indicating potential breakout opportunities.
How It Works
Market Condition Determination:
Bullish Market: When the close price is above the 200-period EMA on the Daily timeframe.
Bearish Market: When the close price is below the 200-period EMA on the Daily timeframe.
Directional Candle Coloring:
Green Background: Applied when the close is above the 50-period EMA and the market is not bearish.
Red Background: Applied when the close is below the 50-period EMA and the market is not bullish.
Uses the Average True Range (ATR) to define a range threshold.
Suppresses signals when EMAs are within this range, indicating a sideways market.
Plotting Entry Signals:
Plots arrows on the chart for potential long and short entries on the 1-hour and 4-hour timeframes.
Breakout Candle Coloring:
Colors candles blue when a bullish breakout condition is met.
Colors candles orange when a bearish breakout condition is met.
How to Use
Trend Identification: Use the background coloring to quickly identify the overall market trend.
Green Background: Suggests bullish conditions; consider looking for long opportunities.
Red Background: Suggests bearish conditions; consider looking for short opportunities.
Entry Signals: Look for plotted arrows on the chart.
Green Upward Arrow: Indicates a potential long entry signal on the 1-hour or 4-hour timeframe.
Red Downward Arrow: Indicates a potential short entry signal on the 1-hour or 4-hour timeframe.
Breakout Opportunities: Watch for candles colored blue or orange.
Blue Candles: Highlight significant upward price movements.
Orange Candles: Highlight significant downward price movements.
Avoiding Ranging Markets: Be cautious when signals are suppressed due to ranging conditions; the market may not have a clear direction.
Example Usage
Identifying a Bullish Market:
The background turns green.
Price crosses above the 50 EMA.
A green upward arrow appears below a candle on the 1-hour or 4-hour chart.
Identifying a Bearish Market:
The background turns red.
Price crosses below the 50 EMA.
A red downward arrow appears above a candle on the 1-hour or 4-hour chart.
Notes
Open-Source Code: The script is open-source, allowing users to review and understand the logic behind the indicator.
Educational Purpose: This indicator is intended to aid in technical analysis and should not be used as the sole basis for trading decisions.
Disclaimer
This indicator is for educational purposes only and does not constitute financial advice. Trading involves risk, and you should consult with a qualified financial advisor before making any investment decisions.
Script open-source
Nello spirito di TradingView, l'autore di questo script lo ha reso open source, in modo che i trader possano esaminarne e verificarne la funzionalità. Complimenti all'autore! Sebbene sia possibile utilizzarlo gratuitamente, ricordiamo che la ripubblicazione del codice è soggetta al nostro Regolamento.
🌟 Join our trading community for insights, strategies, and market updates! 🚀 discord.gg/eWPngqQsZS 🌐
Declinazione di responsabilità
Le informazioni e le pubblicazioni non sono intese come, e non costituiscono, consulenza o raccomandazioni finanziarie, di investimento, di trading o di altro tipo fornite o approvate da TradingView. Per ulteriori informazioni, consultare i Termini di utilizzo.