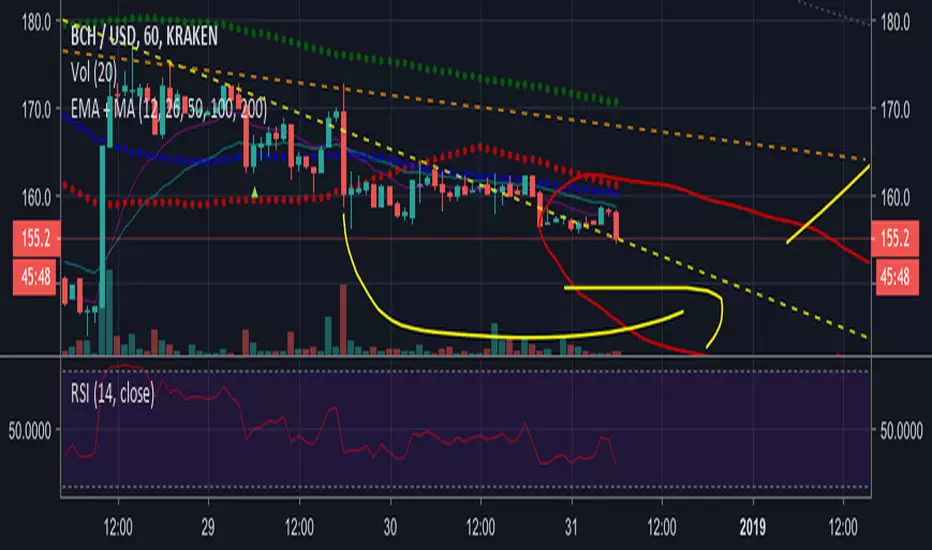
Conceptive Price Moving Average [CSM]The Conceptive Price Moving Average (CPMA) is a technical indicator designed to provide a more accurate moving average of the price by using the average of various price types, such as open, close, high, low, etc. The CPMA can help to smooth out the noise and provide a clearer picture of the overall trend by taking the average of the last 3 candles for each price type and then calculating the average of those averages.
To use the CPMA for generating buy/sell signals, you can look for crossovers of the CPMA and other commonly used moving averages, such as the 9-period EMA, 20-period EMA, 50-period EMA, 100-period EMA, and 200-period EMA, which are also plotted on the chart. When the CPMA crosses above a shorter-term moving average, such as the 9-period EMA or 20-period EMA, it can indicate a potential buy opportunity, while when the CPMA crosses below a shorter-term moving average, it can indicate a potential sell opportunity.
Based on my analysis of BankNifty and Nifty, I have found that the CPMA works best at a length of 21, showing good resistance and support for stocks. Therefore, I recommend using a length of 21 when using the CPMA for generating buy/sell signals.
100


50-100-200 Day SMAA simple indicator that display the 50, 100, and 200 Daily SMA. It will always display the DAILY 50,100, 200, regardless of the time frame you are looking at. Makes it easy to quickly display these key averages while also looking at smaller timeframes like 1H candles.


SMA 50/100 / 200Couldn't find a simple moving average that combined the three i was looking for so I made it. Nothing special.

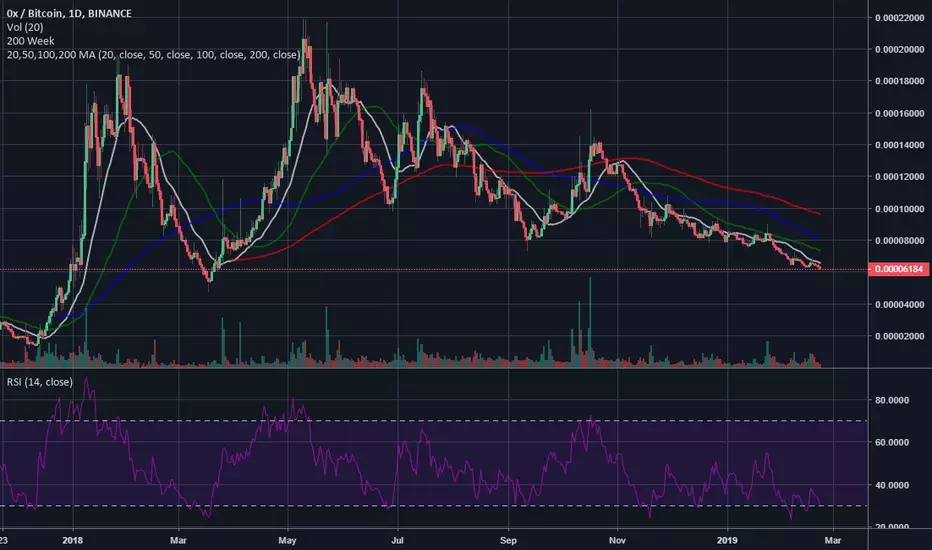
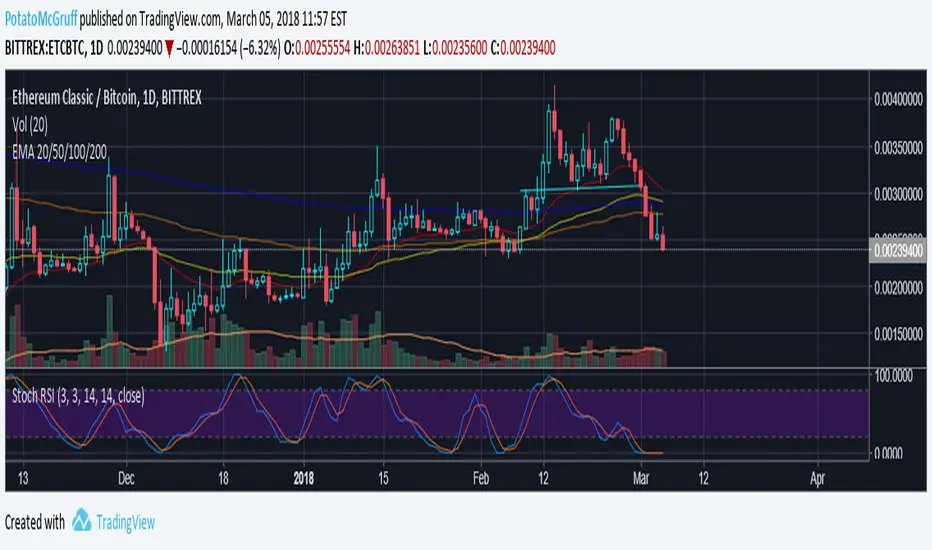
EMA 20/50/100/200Script that publishes the EMA for 20, 50, 100, and 200.
Follow me on Twitter at @PotatoMcGruff
50,100,200 MA by CryptoLife71(FIXED)Updated the code by CryptoLife71 so that the 200ma shows correctly.


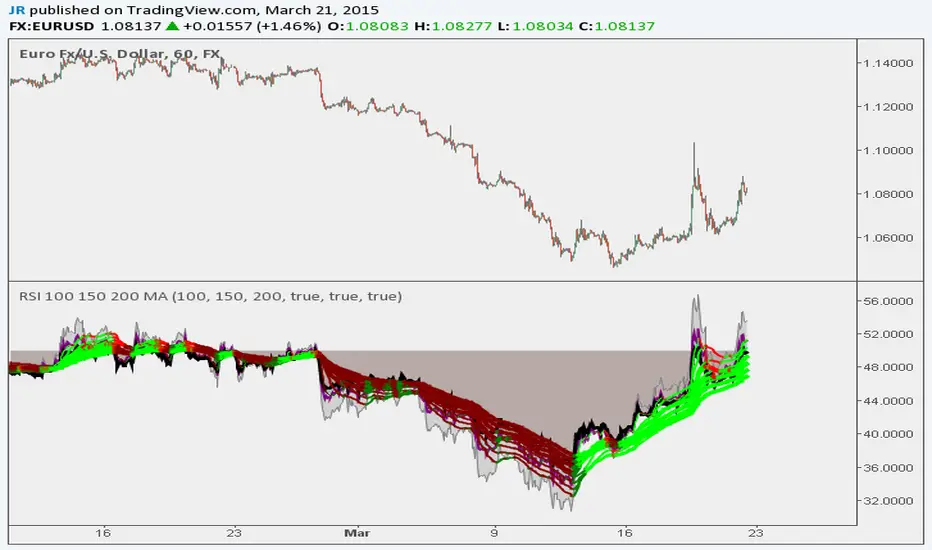
RSI 100 150 200 MA Ribbon
Following Trends and Finding Divergences
Here is a script example that uses a long length (100, 150, 200) RSI MA Ribbon to detect trend reversals using lower time frames. You can also use traditional RSI to find divergences.
Built Best for 1H to 10 Min Charting
BTCUSD