XBT Volatility Weighted Bottom Finder. [For Daily Charts]An update to:
Made it into and indicator.
v. 0.0.1
DESIGNED FOR DAILY CHARTS
Linea di accumulazione/distribuzione (ADL)

Accumulation/Distribution Volume (ADV) [cI8DH]This is the simplified and optimized version of my original ADV indicator. It shows both regular volume bars and the accumulated/distributed (A/D) portion of them. The equation is elegant and intuitive. It calculates candle body to candle height ratio and multiplies it by volume: volume*(close-open)/(high-low). This is the building block of my three other indicators, ADL, ADP and ADMF.
- The volume bars has two shades of green and red. The dark shade shows amount of A/D and the light shade shows total volume (what you see on a regular volume indicator).
When money volume is enabled, volume is multiplied by price. As you can see in the chart below, trade volume in terms of USD was growing over the past years.
- Blue line is the moving average of A/D and the orange line is for total volume. When "Baseline Chart" option is enabled, this moving average is identical to ADMF indicator which can be a powerful indicator for assessing buy/sell pressure as well as money flow and volume divergences. You can turn off volume bars (from style menu) for better visibility or you can use the below indicators.
Please note that ADMF is now available as a part of ADP indicator as well and I recommend using the latter since ADP can also replace CMF and MFI indicators.
- If you change the aggregation to cumulative (while having money volume disabled), the gray line becomes identical to On Balance Volume (OBV) and the blue line identical to my ADL indicator. The latter I would argue is more accurate than Chaikin's ADL, William's A/D and OBV.

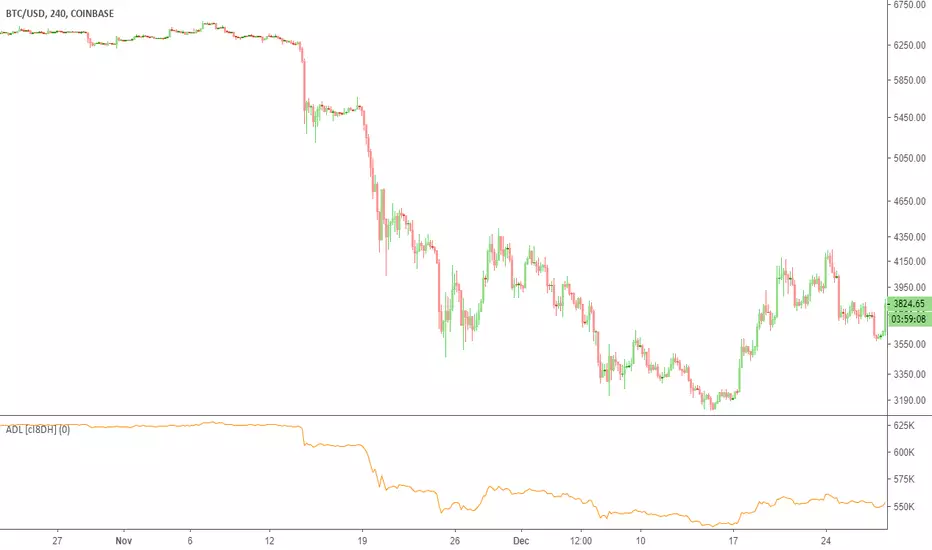
Accumulation/Distribution Level (ADL) [Cyrus c|:D]This indicator shows Accumulation/Distribution level which can be used for confirming trends or reversals (via divergence). It is an alternative to Chaikin's Accumulation/Distribution Line (ADL) and On Balance Volume (OBV) indicators. It can also replicate PVT and OBV via options in the input menu.
Here is a comparison of four related indicators:
OBV is too simple and has serious flaws as explained in PVT's wiki.
Chaikin's ADL is a broken indicator as can be seen in the chart below:
A/D Level addresses the flaws in these two indicators. It simply sums up portions of the volume that contributes to price change. These portions are visualized in dark green and red on "Accumulation/Distribution Volume (ADV)" indicator. This can also be achieved by ADV indicator if you are nerd enough.
PS: There is Williams A/D as well which is also a broken indicator.
Accumulation/Distribution VolumeThis is a simple yet powerful indicator that can replace volume, Money Flow, Chaikin Money Flow, Price Volume Trend (PVT), Accumulation/Distribution Line (ADL), On Balance Volume (OBV).
When "Baseline Chart" option is disabled, it looks similar to regular volume. The volume bars has two shades of green and red. The dark shade shows amount of accumulation and the light shade shows total volume (what you see on a regular volume indicator). Blue line is the moving average (or cumulative total) of A/D and the gray line is for total volume.
When money volume is enabled, volume it multiplied by price. As you can see in the chart below, trade volume in terms of USD was declining after ATH. This is not the case in regular volume chart which shows instrument volume (chart above).
In Baseline view, the aggregation method you choose can turn it into different indicators. With EMA/SMA aggregation, blue and gray line shows buy/sell pressure. At 0, there is not buy or sell pressure.
If you turn off volume bars (from style menu), it gives you a reliable indicator to measure divergence. This should be more reliable than most other range-bound indicators (i.e. RSI, MFI, CMF). I will publish a TA about correctly measuring divergence (it's a must read even if you are a pro trader). Make sure that the length is set to a large number on smaller TFs such as 4h.
For following results, set aggregation to cumulative and turn off money volume:
When wick weight=0, the GRAY line is identical to OBV indicator.
When normalized by spread and wick weight=10, the BLUE line is identical to ADL (improved by true range).
When normalized by previous bar price, wick weight=0, the BLUE line is identical to PVT.
How I use this indicator:
- Baseline chart, replaced my regular volume indicator
- Mostly 4h TF for divergence
- EMA aggregation (and occasional cumulative aggregation) with length above 50. I change the length to 100 and 200 for confirmation.
- Wick weight=0 or max 2.
With this indicator, you can learn how different indicators are built and how they are different from each other. I will publish a TA to explain more about different indicators and their pros and cons.
I will publish this indicator without volume bars and additional options to make it range bound.

Weis Wave ChartThis indicator is based on the Weis Wave described by David H. Weis in his book Trades About to Happen: A Modern Adaptation of the Wyckoff Method, more info how to use this indicator can be found in this video . The Weis Wave is an adaptation of Richard D. Wyckoff’s method Wave Charts. It works in all time periods and can be applied to all asset types.
Unlike other implementations I found here on TradingView, this implementation make use of a Renko-like zig zag pattern, very similar to how it is described in David H. Weis' book. The settings for the zig zag pattern are very similar to the standard Renko settings here on TradingView, in the "Renko Assignment Method" you either chose "ATR" or "Traditional" (read more about it here ). The ATR length or the brick size is then entered in the textbox "Value". You can also chose another setting in the "Renko Assignment Method" drop down named "Part of Price" which calculate the brick size from the current close and divide it by the value in the text box "Value". It is also possible to chose if the zig zag pattern shall use the high/low, the open/close or just the close as the most extreme values in its calculation, you select this in the drop down "Price Source".
TradingView's pine script does currently not support to print non-static text on the chart, so it is not possible at this point to write out the volume on the zig zag chart. It is also not possible to have both an overlay and separate chart pane in the same indicator, therefor this indicator is split up in two.
You can find the volume indicator here:

Weis Wave VolumeThis indicator is based on the Weis Wave described by David H. Weis in his book Trades About to Happen: A Modern Adaptation of the Wyckoff Method, more info how to use this indicator can also be found in this video . The Weis Wave is an adaptation of Richard D. Wyckoff’s method Wave Charts. It works in all time periods and can be applied to all asset types. For assets that do not support volume Weis propose in his book to use the true range instead, so if you want to use this indicator for assets that do not support volume, make sure to enable the checkbox "Use True Range instead of Volume".
Unlike other implementations I found here on Trading, this implementation make use of a Renko-like zig zag pattern, very similar to how it is described in David H. Weis' book. The settings for the zig zag pattern are very similar to the standard Renko settings here on TradingView, in the "Renko Assignment Method" you either chose "ATR" or "Traditional" (read more about it here ). The ATR length or the brick size is then entered in the textbox "Value". You can also chose another setting in the "Renko Assignment Method" drop down named "Part of Price" which calculate the brick size from the current close and divide it by the value in the text box "Value". It is also possible to chose if the zig zag pattern shall use the high/low, the open/close or just the close as the most extreme values in its calculation, you select this in the drop down "Price Source". If you want the price to oscillate around a zero value, enable the "Oscillating" checkbox.
TradingView's pine script does currently not support to print non-static text on the chart, so it is not possible at this point to write out the volume on the zig zag chart. It is also not possible to have both an overlay and separate chart pane in the same indicator, therefor this indicator is split up in two.
You can find the zig zag indicator here:

Twiggs-ss
The modified indicator money flow Chaikin -LasyBear. Drastically accumulation and a sharp distribution of the painted color
OBV Accumulation / Distribution combination v2OBV takes difference between old close and new close and multiplies by volume without considering high and low.
This assigns the entire volume into a single direction even tho movement could've been in both.
Accum/dist takes difference between close and high and low without considering previous close or open. This causes huge deviation from OBV when you have close or open far from high or low and price moving in the other direction like in a series of descending hammers.
This is attempt to combine both so relative motion between candles is detected and volume direction is assigned based relative to movement within a candle to account for volume in both directions.
+ and - depends if close is above previous close (+ if above, - if below)
Maximum upward volume counts if close = high and previous close = low, this makes multiplier 1 and thus entire volume is counted upwards
Maximum downward volume counts if close = low and previous close = high, this makes multiplier -1 and thus entire volume is counted downwards.
Zero volume movement occurs when close = previous close.
Half upward volume movement occurs if close-previous_close is half the range from high-low.
Update:
Open used instead of previous close due to issues with grabbing previous close on some charts. This seems more accurate for gaps without volume.

OBV Accumulation/Distribution combinationOBV takes difference between old close and new close and multiplies by volume without considering high and low.
This assigns the entire volume into a single direction even tho movement could've been in both.
Accum/dist takes difference between close and high and low without considering previous close or open. This causes huge deviation from OBV when you have close or open far from high or low and price moving in the other direction like in a series of descending hammers.
This is attempt to combine both so relative motion between candles is detected and volume direction is assigned based relative to movement within a candle to account for volume in both directions.
+ and - depends if close is above previous close (+ if above, - if below)
Maximum upward volume counts if close = high and previous close = low, this makes multiplier 1 and thus entire volume is counted upwards
Maximum downward volume counts if close = low and previous close = high, this makes multiplier -1 and thus entire volume is counted downwards.
Zero volume movement occurs when close = previous close.
Half upward volume movement occurs if close-previous_close is half the range from high-low.

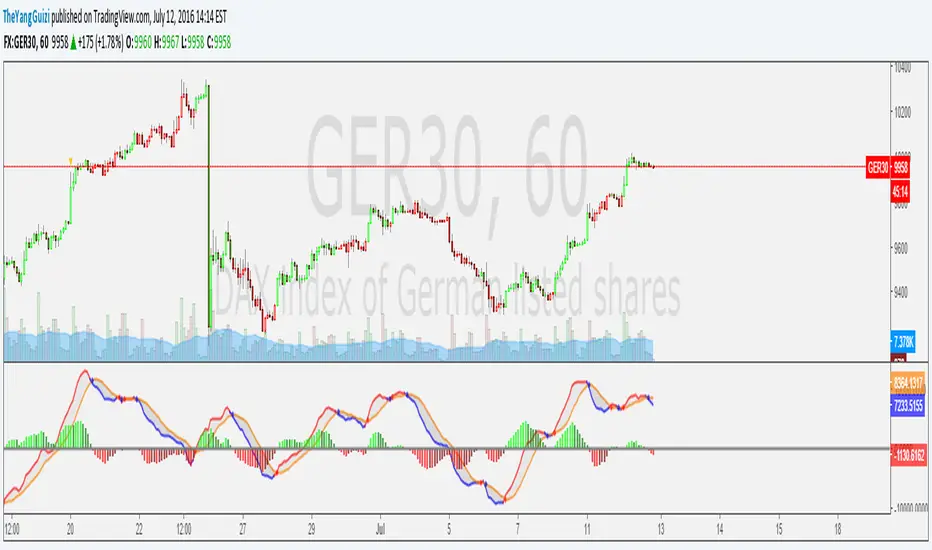
Accumulation/Distribution MACDMACD of acc/dist instead of the normal stuff.
Dunno if it's actually useful.
Just wanted to see what happened.
Thanks to ChrisMoody who's macd script I stole
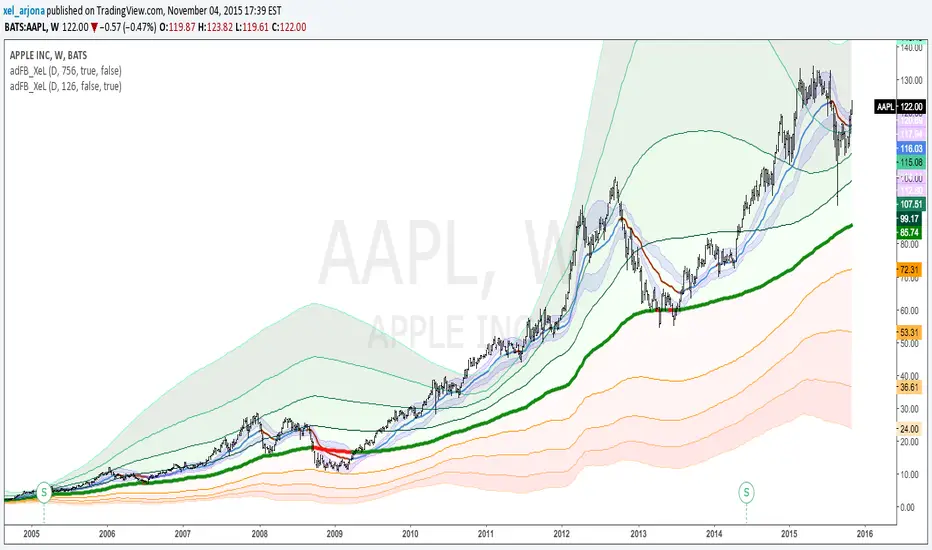
EVWMA Acc/Dist. Pressure & FRACTAL BANDS by @XeL_ArjonaEVWMA ACCUMULATION/DISTRIBUTION PRESSURE & FRACTAL BANDS
Version: 3.0 @ 4.11.2015
By Ricardo M Arjona @XeL_Arjona
DISCLAIMER:
The following indicator IS NOT INTENDED TO BE A FORMAL INVESTMENT ADVICE OR TRADING RECOMMENDATION BY THE AUTHOR, nor should be construed as such. Users will be fully responsible by their use regarding any kind of trading vehicles or assets.
The following script and ideas within this work are FREELY AND PUBLICLY availables on the Web for NON LUCRATIVE ACTIVITIES and must remain as is.
-== IMPORTANT: THIS IS AN EXPERIMENTAL INDICATOR ==-
What is this?
This work is a derivation of my previous Accumulation/Distribution scripts publicly available in TradingView in an effort to clean, speedup and make the indicator cleaner as possible.
The current indicator is based on already tested and Mathematically proof concepts as described below:
The MAIN Rolling back median line or "Vortex" is constructed by a simple and equal weighting of distributed volume along the candle range (This approach is just an "estimator" of Buyers Vs. Sellers given the lack of tick resolution in TradingView, a real "DELTA" can only be 100% reliable with Market Depth (Ask/Bid ticks)), Given this, with each "volume weights", the price is post-processed against a true statistical Average calculation formerly: ELASTIC VOLUME WEIGHTED MOVING AVERAGE.
The FRACTAL BANDS are just Standard Deviation's with GOLDEN RATIO as multiplier (1.618) derived one from each other within it's origin on the former "Vortex Median".
The Standard Error Bands comply as the original indicator described by Jon Andersen but given the true statistical nature of EVWMA, the original LinReg line has been substituted by the former.
ALL NEW IDEAS OR MODIFICATIONS to this indicator are welcome in favor to deploy a better technical tool. Any important addition to this work MUST REMAIN PUBLIC by means of CreativeCommons CC & TradingView user rules. (C) 2015 @XeL_Arjona
Mr.J -- Accumulation Distribution OscillatorEdit: More examples in comments, TV doesn't like to publish with split charts ;)
As a popular volume indicator, Accumulation Distribution Oscillator makes it easy and simple to interpret amplitude changes in the accumulation distribution. Either an observed peak in positive or negative amplitude can be used to snipe high/low points or a crossover from a positive number to a negative amplitude can indicate the change of Accumulation to Distribution.
Hidden divergences can also be found by looking for differences in the price/volume amplitude, similar to OBV divergence rules.

Accumulation/Distribution With Moving AveragesHelps To Identify the Underlying Trend of Buying & Selling Forces.

Accumulation/Distribution with Moving AveragesThis Acc/Dist Script Lends a Broader Perspective to the Trend of the Indicator . It can be used to compare with the Trend of the Market to Identify Reversals & Confirm Market Trends !


Acc/Dist. Cloud with Fractal Deviation Bands by @XeL_ArjonaACCUMULATION / DISTRIBUTION CLOUD with MORPHIC DEVIATION BANDS
Ver. 2.0.beta.23:08:2015
by Ricardo M. Arjona @XeL_Arjona
DISCLAIMER
The Following indicator/code IS NOT intended to be a formal investment advice or recommendation by the author, nor should be construed as such. Users will be fully responsible by their use regarding their own trading vehicles/assets.
The embedded code and ideas within this work are FREELY AND PUBLICLY available on the Web for NON LUCRATIVE ACTIVITIES and must remain as is.
Pine Script code MOD's and adaptations by @XeL_Arjona with special mention in regard of:
Buy (Bull) and Sell (Bear) "Power Balance Algorithm by Vadim Gimelfarb published at Stocks & Commodities V. 21:10 (68-72).
Custom Weighting Coefficient for Exponential Moving Average (nEMA) adaptation work by @XeL_Arjona with contribution help from @RicardoSantos at TradingView @pinescript chat room.
Morphic Numbers (PHI & Plastic) Pine Script adaptation from it's algebraic generation formulas by @XeL_Arjona
Fractal Deviation Bands idea by @XeL_Arjona
CHANGE LOG:
ACCUMULATION / DISTRIBUTION CLOUD: I decided to change it's name from the Buy to Sell Pressure. The code is essentially the same as older versions and they are the center core (VORTEX?) of all derived New stuff which are:
MORPHIC NUMBERS: The "Golden Ratio" expressed by the result of the constant "PHI" and the newer and same in characteristics "Plastic Number" expressed as "PN". For more information about this regard take a look at: HERE!
CUSTOM(K) EXPONENTIAL MOVING AVERAGE: Some code has cleaned from last version to include as custom function the nEMA , which use an additional input (K) to customise the way the "exponentially" is weighted from the custom array. For the purpose of this indicator, I implement a volatility algorithm using the Average True Range of last 9 periods multiplied by the morphic number used in the fractal study. (Golden Ratio as default) The result is very similar in response to classic EMA but tend to accelerate or decelerate much more responsive with wider bars presented in trending average.
FRACTAL DEVIATION BANDS: The main idea is based on the so useful Standard Deviation process to create Bands in favor of a multiplier (As John Bollinger used in it's own bands) from a custom array, in which for this case is the "Volume Pressure Moving Average" as the main Vortex for the "Fractallitly", so then apply as many "Child bands" using the older one as the new calculation array using the same morphic constant as multiplier (Like Fibonacci but with other approach rather than %ratios). Results are AWSOME! Market tend to accelerate or decelerate their Trend in favor of a Fractal approach. This bands try to catch them, so please experiment and feedback me your own observations.
EXTERNAL TICKER FOR VOLUME DATA: I Added a way to input volume data for this kind of study from external tickers. This is just a quicky-hack given that currently TradingView is not adding Volume to their Indexes so; maybe this is temporary by now. It seems that this part of the code is conflicting with intraday timeframes, so You are advised.
This CODE is versioned as BETA FOR TESTING PROPOSES. By now TradingView Admins are changing lot's of things internally, so maybe this could conflict with correct rendering of this study with special tickers or timeframes. I will try to code by itself just the core parts of this study in order to use them at discretion in other areas. ALL NEW IDEAS OR MODIFICATIONS to these indicator(s) are Welcome in favor to deploy a better and more accurate readings. I will be very glad to be notified at Twitter or TradingView accounts at: @XeL_Arjona

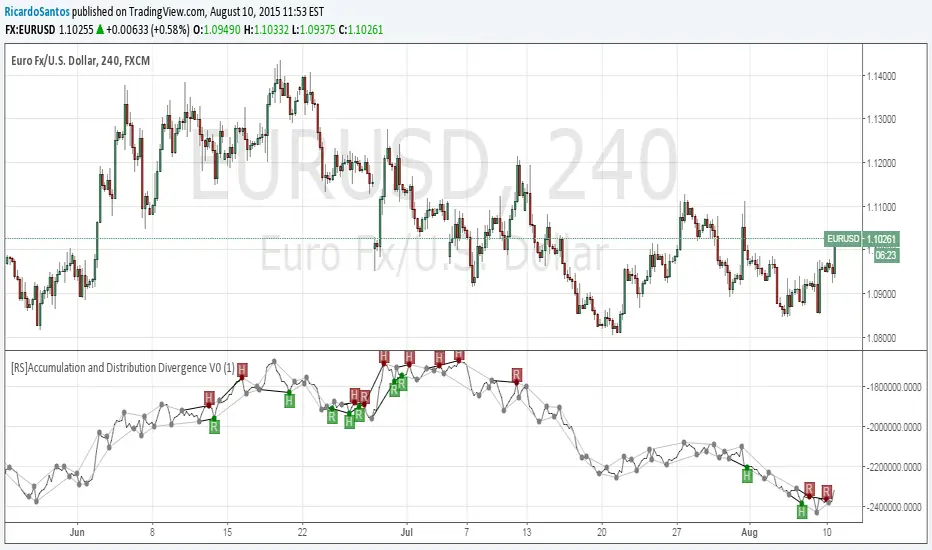
[RS]Accumulation and Distribution Divergence V0EXPERIMENTAL: Accumulation and Distribution Divergence detection.
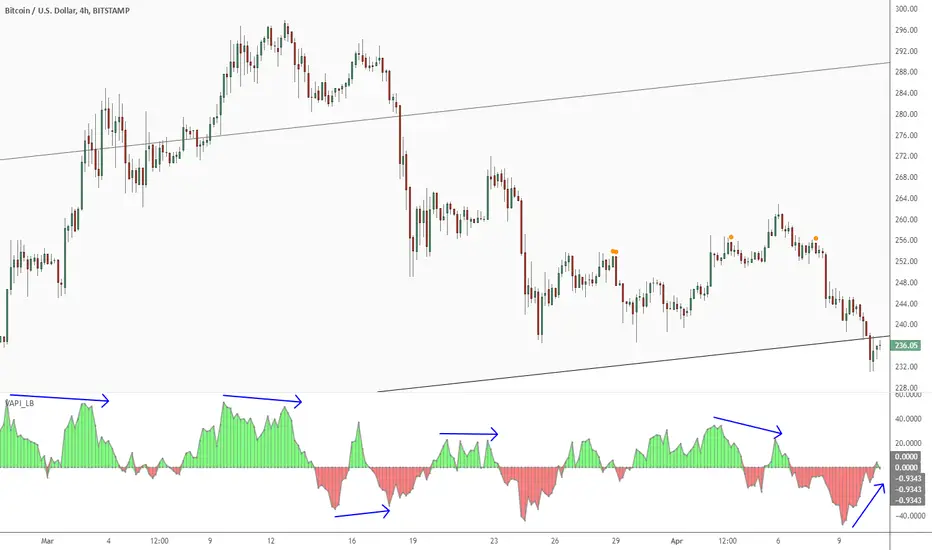
Volume Accumulation Percentage Indicator [LazyBear]Volume Accumulation Percentage Indicator (VAPI) is a variation of the classic volume-accumulation indicators. It uses volume the same way as OBV except that it assigns volume weights based on intraday volatility.
In a positive trend, if the stock price is close to a (local) new high, the VAPI should be at its maximum as well (and vice versa for a negative trend). If the market is looking for a direction, if the price is in the bottom side of his current trading range and if, at the same moment the VAPI osc slopes up, there is accumulation on the stock and that the prices should start to climb. The SELL signal is given when the VAPI decreases (distribution). Divergences are usually very effective too.
Tuning the "length" parameter may be needed for your instrument (default is 10), do let me know if you find a different value to be optimal for majority of instruments.
List of my public indicators: bit.ly
List of my app-store indicators: blog.tradingview.com
WVADWilliam’s Variable Accumulation Distribution
The Williams Variable Accumulation Distribution (WVAD), developed by Larry Williams, is a volume-weighted price momentum indicator. It measures the buying and selling pressure by calculating the relationship between the number of points the market has moved from the open to close relative to the period’s entire range.

CM_Williams AD+SMA_V1_PublicI posted this code a long time ago and forgot to add to PineScript Library.
Plots Williams Accumulation Distribution, Williams AD With Optional SMA as a Filter.
In Inputs Tab:
Ability to Turn On/Off SMA Filter.
Ability to change any of the plots to Change Colors Based on Being Above or Below the SMA Filter.
Also Ability to Turn Off Color Change Based on SMA Filter.


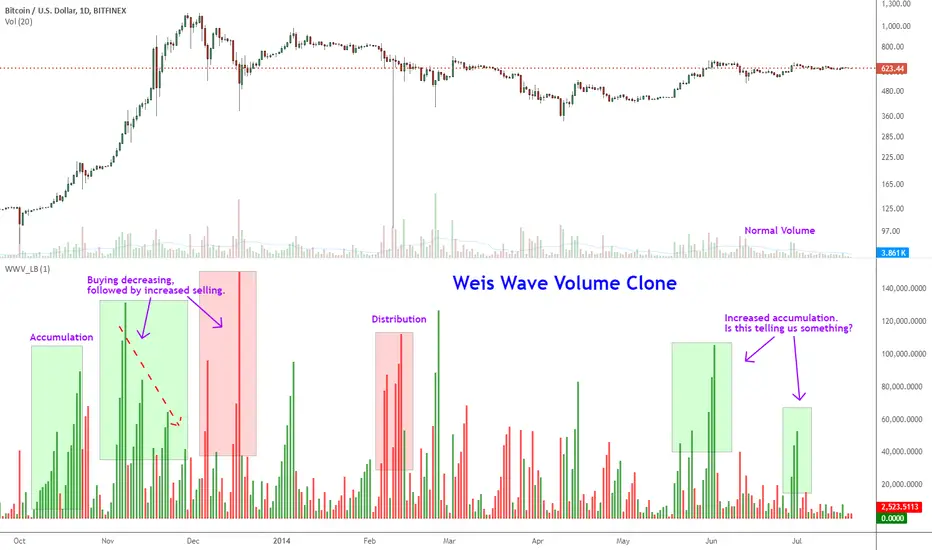
Indicator: Weis Wave Volume [LazyBear]This indicator takes market volume and organizes it into wave charts, clearly highlighting inflection points and regions of supply/demand.
Try tuning this for your instrument (Forex not supported) by adjusting the "Trend Detection Length". This "clubs together" minor waves. If you like an oscillator-kind-of display, enable "ShowDistributionBelowZero" option.
Note: This indicator is a port of a clone of WeisVolumePlugin available for another platform. I don't know how close this is to the original Weis, if any has access to it, do let me know how this compares. Thanks.
More info:
weisonwyckoff.com
Complete list of my indicators: