Adaptive Bollinger BandsThis is part 3 of 11 in the system named Ninetales/Volt V2 you can find on Tradingview.
It simply measures all of the combinations of the defined parameters for Bollinger Bands, and returns the most logically accurate values.
Use it however you would use standard Bollinger Bands, just add your preferred values to test against each other, and set the period you would like for it to backtest.
Adaptive

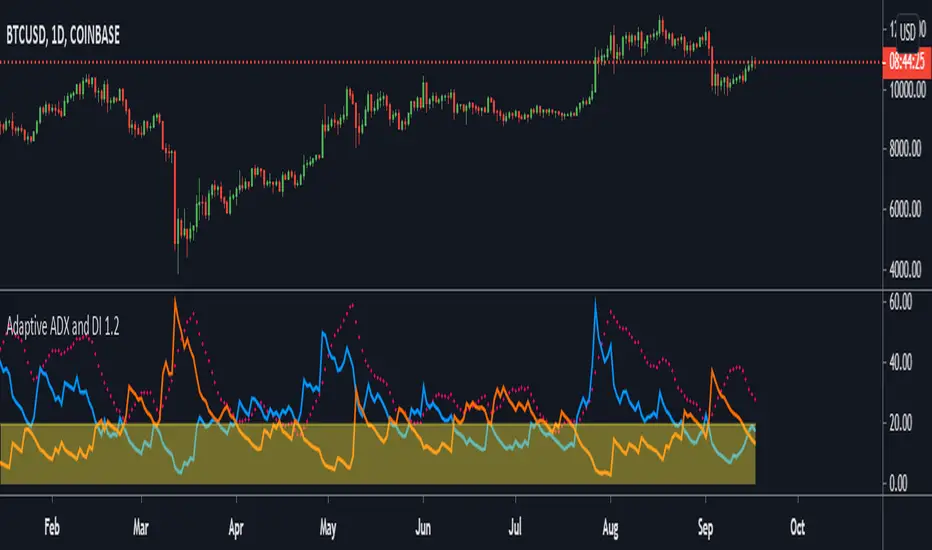
Adaptive ADX and DIThis is part 2 of 11 in the system named Ninetales/Volt V2 you can find on Tradingview.
It simply measures all of the combinations of the defined parameters of a typical ADX + DI , and returns the most logically accurate values.
Use it however you would use a standard ADX + DI, just add your preferred values to test against each other, and set the period you would like for it to backtest.
Standard use would be to wait for ADX(red line) to be above the threshold(yellow shaded area). The short when orange is above the blue line, and long when the blue line is above the orange line.
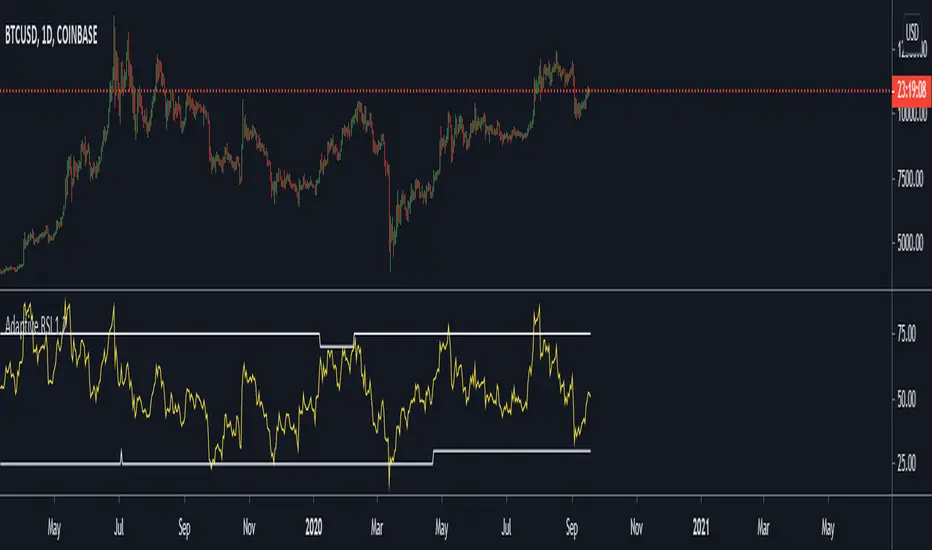
Adaptive RSIThis is part 1 of 11 in the system named Ninetales you can find on Tradingview.
It simply measures all of the combinations of the defined parameters of a typical RSI, and returns the most logically accurate values.
Use it however you would use a standard RSI, just add your preferred values to test against each other, and set the period you would like for it to backtest.
Patreon Moving AverageThe Patreon moving average (PMA) is an adaptive moving average specifically designed to provide an optimal fit with the price while having a minimum amount of lag. The PMA can act as a fast-moving average for moving averages crossover system, detect trends, and filter out noisy variations from the price. The PMA is simple to use and interpret, and can be a really nice addition to your strategies, especially if they are based on moving averages.
The PMA integrates alerts based on the trend direction detected by the PMA.
Settings
Length: Determine the degree of filtering of the PMA.
Factor: Determine the sensitivity of the PMA to price variations, with higher values making the PMA less sensitive to price variations.
Decay: When higher than 0, introduce progressive smoothing, values closer to 0 return a faster progressive smoothing.
Src: Source input of the indicator.
Detect Trends With The PMA
The color of the PMA is related to the detected trend, with a blue color associated with an up-trend and a red color associated with a down-trend.
Higher values of Factor allows us to spot longer-term trends as well as filtering retracement in a trend.
Lower values of Length can also be used with higher values of Factor , this combination allows the PMA to actually be way less sensitive to price variations, thus returning less false signals while keeping a good fit with the price.
PMA As A Fast Moving Average
The PMA tries to provide crosses with a slow-moving average at the exact moment price cross the slow MA while minimizing the number of false signals.
PMA (In blue), EMA (in green), and SMA as a slow-moving average (in red), the PMA provide faster crosses while returning less false signals.
Progressive Smoothing
Progressive smoothing is obtained by using the Decay setting and allows the PMA to fit the price during extremely volatile markets and allows to preserve the structure of higher high's and lower low's.
Progressive smoothing can also minimize false signals.
In green/orange the PMA without progressive smoothing, in blue/red the PMA with progressive smoothing.
Finally progressive smoothing can give predictive and accurate estimates of the price central tendency
In green the mean of the price with a window size equal to the period the PMA is red, we can see that the PMA converges toward it extremely fast.
How To Access
The indicator is one of the "Patreon trend following indicators", and can only be used by my Patreons, you can become a Patreon by using the link on my signature.

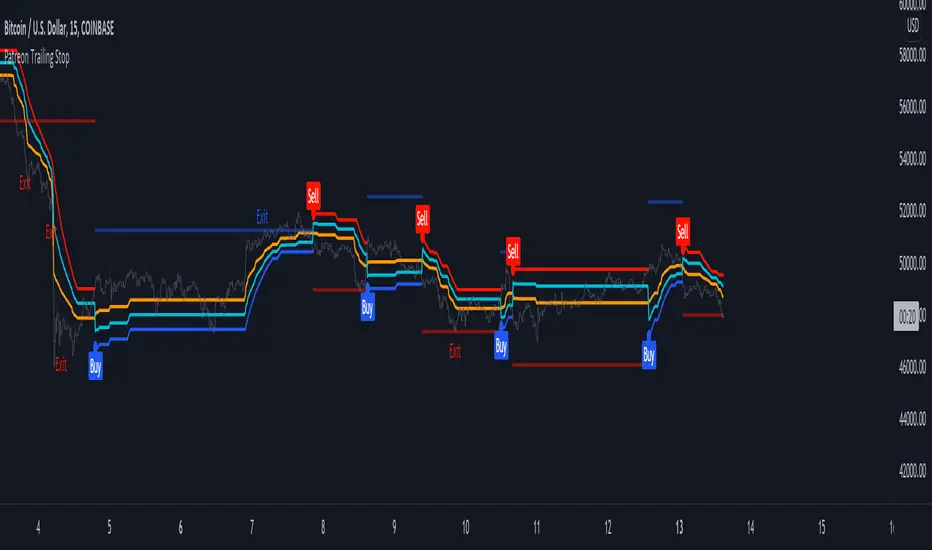
Patreon Trailing StopThe Patreon trailing stop technical indicator can detect trends, find support and resistance points, filter out noise, and help users make informed decisions easily and in a timely manner. In order to provide an accurate and useful indicator most of the efforts during its development were directed toward the minimization of false signals, thus giving to the indicator the potential to further improve your trading strategies.
The trailing stop integrates visual elements for an easier interpretation of the indicator, and integrate alerts based on the buy/sell signals given by the trailing stop. All the outputs of the indicator can be used as input for other indicators.
Settings
In order to make it easier to use, the indicator only possess three user settings:
Length: Control the sensitivity to price variations, with a higher value aiming to detect longer-term trends.
Factor: A setting that aims to filter out false signals, with a higher value filtering more false signals.
Src: Source input of the indicator, by default set to median price (hl2).
Easily Filter Out False Signals
The Factor setting was carefully implemented to filter out false signals without introducing significant delay.
In green/orange the indicator with a Factor setting of 1, in blue/red the indicator with a Factor setting of 10, both using Length = 50 , we can see that increasing factor remove false signals.
The integrated support and resistance line can also help you spot potential false signals:
When the price cross the S/R line before the occurrence of a signal we could expect the upcoming signal to be false, better signals are given when the price cross the S/R at the same time a signal is produced.
Finally, the distance between the trailing stop and the price when a new signal occurs can also help out determine if this signal is false, as a higher distance between the trailing stop and the price suggest a ranging market.
Entering Trades At A Better Position
Indicators can give false signals at the top or bottom of a movement, the Patreon trailing stop can help you enter trades at a more profitable position thanks to the integrated support and resistance line.
When we have a signal but fear it might be false, we can wait for the price to reach the S/R and enter our trade at that point, this allows us to either make a profit or minimize a loss.
Integrated Adaptive Filter
The indicator integrates a trend adaptive filter (in orange), with it you can:
Filter out noisy variations from the price.
Use it as a fast-moving average in a moving average crossover system.
Use it as input for other technical indicators.
Simple moving average with period 200 using the filter as input.
How To Access
The indicator is one of the "Patreon trend following indicators", and can only be used by my Patreons, you can become a Patreon by using the link on my signature.
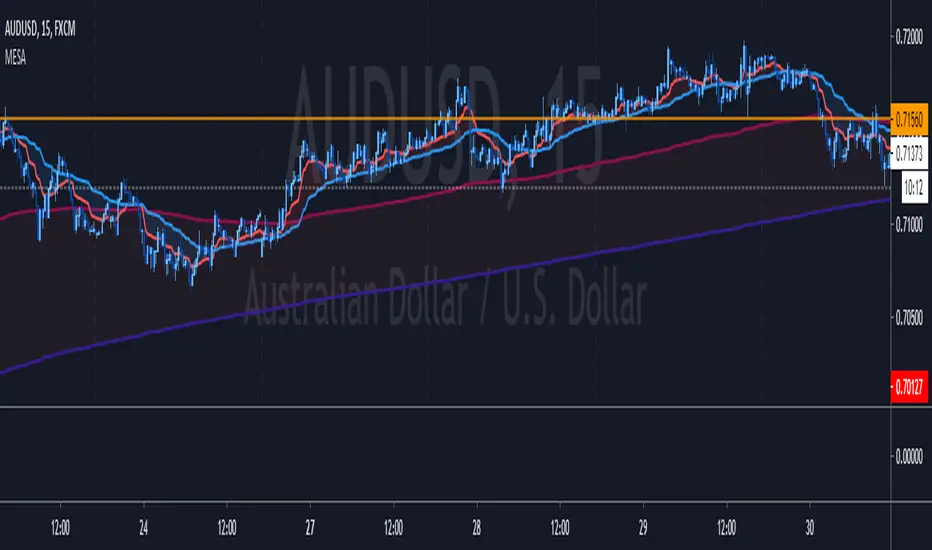
MESA Adaptive Moving Average - Improved MTFThis indicator is a huge upgrade to my original MTF MESA
Plots are now extremely smooth and accurate on all timeframes **
Missing data points are automatically filled with the "best fit"
This is a Trend indicator and should be used to trade "top-down" aka:
Start with the Daily chart to confirm a trend
Move to 4H
2H
Etc...
Use your favorite entry method or simply watch for wicks forming when the price gets near the MESA adaptive moving average.
This is one of the few indicators that I've been using for years with success. Being able to plot both the current & higher timeframe MESA
can sometimes feel like cheating.
Due to the nature of the recursive calculation, you may notice slight differences between this version of MESA and others that either
approximate higher timeframes with fewer samples or make use of the latest "Resolution" argument in Pinescript V4. Both of which are
fine, until you start looking at M5 charts while plotting the Daily MESA.
As always, happy trading!
** Currently supports
M 1,3,5,15,30,45
H 1,2,3,4
Day 1
Week 1
Month 1
Ehlers Mother Of Adaptive Moving Averages [CC]The Mother Of Adaptive Moving Averages was created by John Ehlers (Rocket Science For Traders pgs 182-183) and this is definitely my favorite Ehlers moving average script. This works as a trend indicator and a typical moving average. When the mama is above the fama then the stock is in an uptrend and vice versa. Of course it is also good when the price is above the fama and mama lines. Buy when the indicator line is green and sell when it is red.
Let me know if there are other indicator scripts you would like to see me publish or if you want something custom done!

Vertical Horizontal Moving Average [AneoPsy & alexgrover] Moving average adapting to the strength of the trend, this is made possible by using the square of the vertical-horizontal filter as a smoothing factor. Alerts are included with two different types of conditions available to the user.
Settings
Length : Period of the moving average
Src : Input data for the indicator
Alerts : Types of conditions to be used in the alerts, when set to "VHMA Direction Change" alerts are triggered once the VHMA is either rising or declining, else the alerts are based on the crosses between Src and the VHMA
Usage
The VHMA can be used as a fast or slow-moving average in a moving average crossover system, or as input for other indicators.
VHMA of with length = 25 and sma with length = 200.
VHMA with length = 25 used as input for the RSI with length = 14.
Details
The vertical-horizontal filter is a measure of the strength of the trend and lay in a (0,1) range, to calculate it you just need to divide the rolling range over with the rolling sum of the absolute price changes, squaring the result allow to get lower results with higher values of length .
Squared vertical horizontal filter with length = 50, the value is low when the market is ranging and high when trending.
To set the alerts go in the alert panel, click on create alert, and select VHMA in "condition", choose between the buy or sell alert. If Src = closing price or another indicator dependant on the closing price select in options "once per bar close", if the indicator using the opening or lagged closing prices values as input select "One per bar" instead.
Thanks
Thanks to AneoPsy for adding the color change, the idea to use two kinds of conditions for the alert, and for its feedback, you can follow him
www.tradingview.com
and finally thanks to you for reading and for your support, only one last script left for the month, then we'll start July with some pretty interesting indicators, I hope you'll like them ^^/

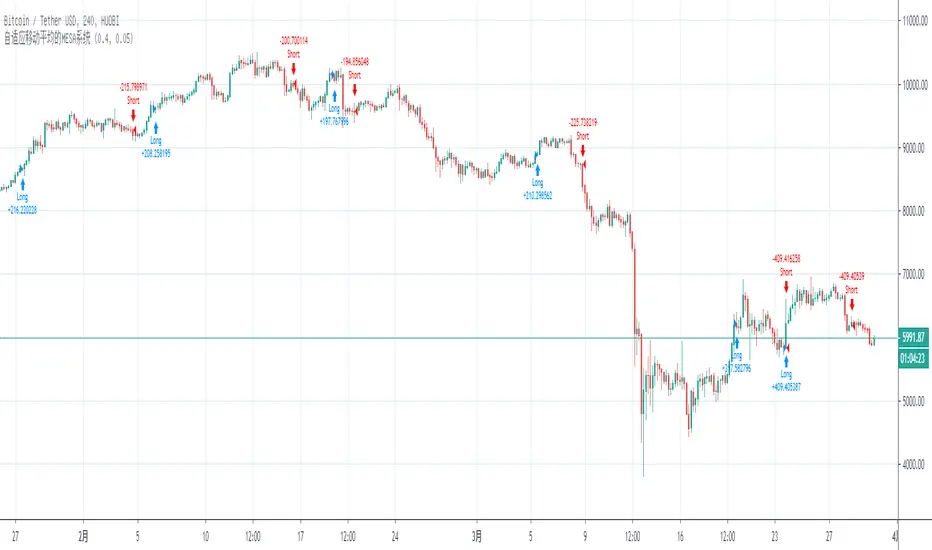
[STRATEGY] Moving Average CrossoverHello friends,
This is a comprehensive backtesting engine for Moving Average crossover strategies, supporting over 63 types of moving averages and filters. It allows you to test, compare, and optimize crossover behaviors between any two moving averages with flexible profit and risk management tools.
Built upon the Moving Average Crossover foundation, this advanced version lets you manually backtest more than 4096 combinations of moving average types. When combined with customizable periods, take-profits, and stop-loss levels, the total number of possible configurations becomes virtually unlimited.
🛠 How It Works
The system tests crossovers between two selected moving averages, with full control over their types, lengths, and trading direction. Integrated bracket settings enable dynamic take-profit, stop-loss, and trailing-stop management using units such as % , ATR , points , pips , or ticks .
You can restrict backtesting to a custom date range for focused performance evaluation or run it across the instrument’s full history.
🔥 Key Features
Supports 63+ moving average and filter types — including algorithms by Ehlers , Jurik , Kaufman , Apirine , Tillson , and Dürschner
Customizable MA types, periods, and strategy direction
Full-featured bracket control: TP, SL, and TSL in ATR, %, points, pips, or ticks
Backtest window customization (start, end, or range)
Direction filter: Longs only, Shorts only, or Both
Dynamic trade labeling and color-coded visualization
Option to exit only at TP, SL, or TSL
If you'd like access or have any questions, feel free to reach out to me directly via DM.
👋 Good luck and happy trading!
Script a pagamento

[LunaOwl] 11 kinds of Adaptive MA Model作品: 11種自適應性平滑模型
It integrates eleven kinds of adaptive moving average method. At first, I just wanted to make a ATR. Later, the price series ±N*ATR mult, to form two series. Then use the concept of support/resistance breakthrough to design it, and then two adaptive series formation channels were formed. Take the average of the two series as the signal. When the price crosses the signal, it's judged to be long or short.
整合了十一種能夠自適應性的移動平均模型。起初只是想要做一個基本款ATR指標,後來將價格加減N個ATR倍數,形成兩條序列形成通道,再使用支撐阻力突破的概念去設計它,再形成兩條自適應性的序列形成通道,再取中間值當成信號。當價格與信號交叉,則判斷作多或者作空。
--------------------------*
Parameter 設置參數
Resolution: The default is "the same as the variety". Is a named constant for resolution input type of input function.
商品分辨率:預設與品種相同。是input函數的時間周期輸入類型的命名常量。
Smoothing: The default is Recursive Moving Average(RMA). It can choose other methods, the table is as follows.
平滑類型:預設是「遞回平均」,可以選擇其它方法,列表如下。
列表 / The table of moving averages is as follows:
//****中英對照表*****##______________________________________
1. 遞回平均 || Recursive Moving Average
2. 簡單平均 || Simple Moving Average
3. 指數平均 || Exponential Moving Average
4. 加權平均 || Weighted Moving Average
5. 船體平均 || Hull Moving Average
6. 成交量加權 || Volume Weighted Moving Average
7. 對稱加權 || Symmetric Weighted Moving Average
8. 雙重指數 || Double Exponential Moving Average
9. 三重指數 || Triple Exponential Moving Average
10. 高斯分佈 || Arnaud Legoux Moving Average
11. 提爾森T3 || Tillson T3 Moving Average
//##_________________________________________________________
Candle Mode: There are three versions, original, two-color and four-color.
燭台模式:預設模式只區分趨勢,可以改成原版蠟燭或四種顏色版本。
Length: The default is 14, usually no need to adjust.
平滑期數:預設值是14,基本上不用理它。
Occurrence: The default is 1. The range is 0~10. The larger the value, the more delayed. If zero will become too sensitive and noise.
滯後性:預設值是1。調整範圍是0~10,數值愈大信號愈延遲,如果值為0,會變得過於敏捷,那將會失去平滑的意義。
N multiple: The default is 0.618, can be set to 1. The range is 0.382~3.000.
倍數N:預設值是0.618,也可以設定1,最低是0.382,最大是3。
--------------------------*
1. Candle Mode can set the original candle, cancel candle trend color changes. However, the background will still be filled.
可以設定顯示原版的蠟燭線,背景與線並不會消失。
2. Four-color version of candles. It shows changes in trends and prices.
四色版本的蠟燭線,可以顯示趨勢與每日收盤價的變化。

Vicious Cycle 1.2 [CR] - Enhanced█ OVERVIEW
Vicious Cycle 1.2 is an advanced oscillator-based momentum indicator designed to identify high-probability reversal and continuation setups. This new version features adaptive threshold technology, visual trend state classification, and a higher timeframe alignment system to filter low-quality signals.
The indicator analyzes multiple timeframe components and market dynamics to generate a composite momentum score, which is then smoothed and compared against statistical thresholds. Unlike traditional static oscillators, Vicious Cycle adapts its sensitivity zones to current market conditions, reducing false signals during volatile periods and increasing responsiveness during consolidation.
█ FEATURES
Adaptive Threshold System
The indicator employs percentile-based threshold calculations that automatically adjust to recent market behavior. This ensures optimal signal generation across different instruments and market regimes without manual recalibration.
• Toggle between dynamic and fixed threshold modes
• Adjustable lookback period for threshold calculation (50-500 bars)
• Customizable percentile levels for sensitivity tuning
• Separate calibration for overbought and oversold zones
Visual Trend State Classification
Background coloring provides instant visual feedback on market condition strength without requiring analysis of indicator position. The six-state classification system combines oscillator position with signal line relationship to identify:
• Strong bullish momentum
• Moderate bullish bias
• Weak bullish condition
• Weak bearish condition
• Moderate bearish bias
• Strong bearish momentum
Higher Timeframe Trend Alignment
An optional filtering system analyzes higher timeframe trend direction to block counter-trend signals. Two modes are available:
• Single EMA Mode: Uses price position relative to a customizable moving average
• Dual EMA Mode: Employs fast and slow moving average crossover logic
The filter only permits long signals during bullish trends and short signals during bearish trends, significantly improving signal quality in trending markets.
Signal Detection Modes
Multiple signal generation methods accommodate different trading styles:
• Zone-Based Signals: Fires when oscillator crosses key threshold levels
• Signal Line Cross: Generates entries based on oscillator and signal line interaction
Comprehensive Alert System
Pre-configured alert conditions cover all major indicator events:
• Primary signal alerts (zone cross and signal line methods)
• Zone entry and exit warnings
• Extreme level notifications
• Trend filter status changes
• Convenience aggregators for "any long" or "any short" condition
█ HOW TO USE
Initial Configuration
The indicator ships with optimized default settings suitable for most instruments and timeframes. New users should observe the indicator's behavior for at least 50 signals before adjusting parameters.
1 — Add the indicator to your chart and leave default settings unchanged.
2 — Monitor signal generation and background color transitions for several trading sessions.
3 — Set up basic alerts using the "ANY LONG Signal" and "ANY SHORT Signal" conditions.
4 — After observation period, adjust sensitivity based on your instrument's characteristics.
Threshold Configuration
For instruments with higher volatility, increase the percentile values (example: 90/75 instead of 85/65). For ranging or lower volatility instruments, decrease percentile values (example: 80/60 or 75/55).
The lookback period controls how quickly thresholds adapt to changing conditions. Longer lookbacks (150-200) provide smoother adaptation, while shorter lookbacks (50-75) offer more responsive adjustments.
Trend Filter Guidelines
Enable the trend filter in clearly trending markets to reduce whipsaw trades. In ranging or choppy conditions, consider disabling the filter or using a shorter EMA period.
• For position trading: Use 200-period single EMA
• For swing trading: Use 150-period single EMA or 50/200 dual EMA
• For day trading: Use 100-period single EMA or 50/100 dual EMA
If the filter blocks all signals, the market may be ranging near the trend reference level. This is intentional behavior designed to keep you out of low-probability setups.
Signal Interpretation
Primary signals occur when the oscillator crosses threshold zones or intersects the signal line in extreme regions. The strongest setups combine:
• Signal generation in the expected direction
• Background color matching the trade direction (bright colors indicate high conviction)
• Trend filter alignment
• Price action confirmation at key support or resistance levels
█ NOTES
Alert Configuration
Alerts must be manually configured in TradingView and do not activate automatically. Access the alert menu by clicking the indicator name and selecting "Add Alert on Vicious Cycle 1.2...". Choose your desired condition from the dropdown menu and configure notification preferences.
We recommend starting with the aggregated "ANY" alerts rather than subscribing to all individual signal types, as this prevents notification overload during active market periods.
Dynamic Threshold Behavior
The adaptive threshold system requires sufficient historical data (minimum equal to the lookback period setting) to calculate percentiles accurately. During the initial bars, threshold values may appear unusual until adequate history accumulates. This is expected behavior and resolves automatically.
Performance Considerations
The indicator performs percentile calculations on each bar using array operations. While optimized for efficiency, users experiencing performance issues on lower-end devices may reduce the dynamic lookback period or disable the adaptive threshold feature to use fixed thresholds instead.
Compatibility
Vicious Cycle 1.2 is built on Pine Script version 6 and works on all instrument types and timeframes. The indicator does not repaint—all signals finalize at bar close. Historical signals remain stable and do not change with additional price data.
█ RISK DISCLOSURE
This indicator is an analytical tool and does not constitute financial advice. No indicator or trading system guarantees profitable results. Always employ proper risk management, position sizing, and stop-loss protocols. Past performance does not indicate future results. Users are responsible for their own trading decisions and outcomes.

MAMA (Ehlers) MESA Adaptive Moving AverageMAMA ( Ehlers ) MESA Adaptive Moving Average:
What it is and how it works
MESA Phasor is the most advanced futures trading program on the market!
MESA Phasor derives its name from the sinewave generator you probably recall from your high school trigonometry class. As you can see in the diagram, the rotating phasor generates a sine wave in the time domain, visualized as a shadow from the arrow tip of the phasor on the vertical axis. A cycle is completed on each full rotation of the phasor. The angle of the phasor increases at a constant rate, and is reset to zero when 360 degrees of rotation have been achieved. The idea of the trading system is to buy low at the valley of the sine wave , when phasor passes the lower angle, and to sell short at the crest of the sine wave , when the phasor passes the upper angle. Now the trade entries and exits are defined in terms of angles, which are in the frequency domain. Therefore, trading decisions are removed from waveform vagaries in the time domain. This means that the trading decisions are robust across various futures contracts and across all kinds of market conditions.
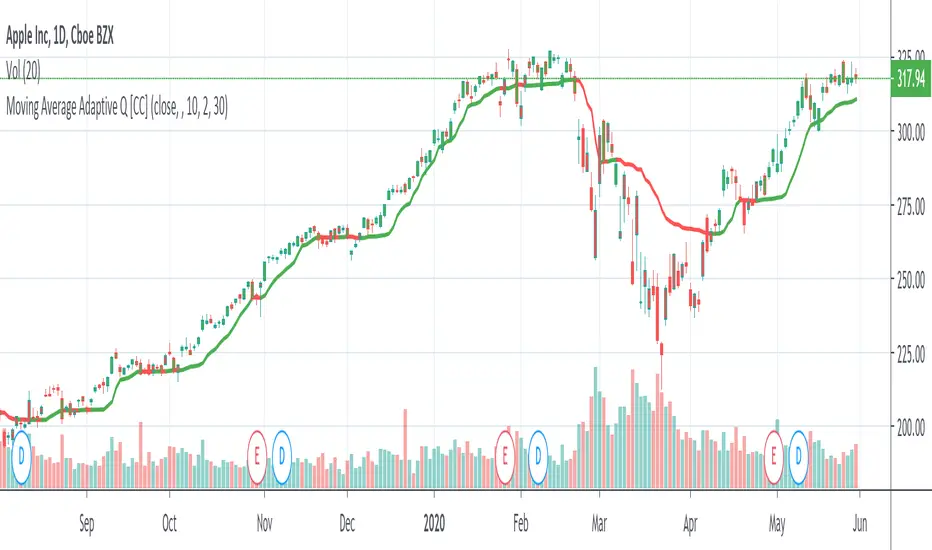
Moving Average Adaptive QThe Moving Average Adaptive Q (MAAQ) was authored by Perry Kaufman in the Stocks and Commodities Magazine 06/1995
This is similar to his Kaufman Adaptive Moving Average with a few changes. This is a pretty close moving average which I like quite a bit. Try it and let me know what you think.
Send me a message and let me know what other indicators you would like to see!
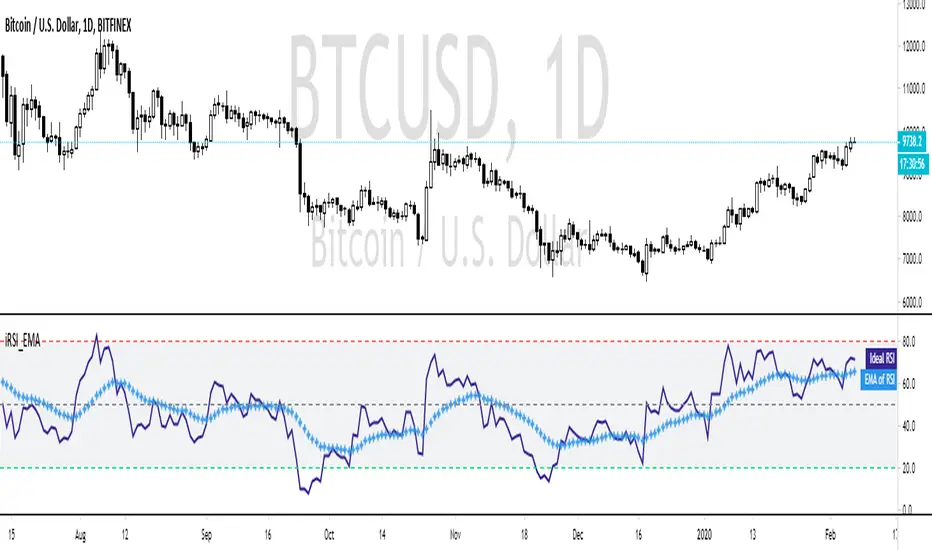
Ehler's Ideal RSI with EMAThis is a modification of the 'Ehlers Ideal RSI' script to include an EMA of the RSI, which acts as a follower!
The idea was a user suggestion and if you would like your suggestion made into an indicator, check the FAQ!
If you've never encountered the iRSI before, then you're in for a treat. This RSI will calculate the best period to use by itself.
The theory behind this math is called "Instantaneous Frequency Measurement" and is a big component of making terrible indicators (see RSI, Stoch, ADX) into usable ones!
No longer will you have to swap between different periods for different Stocks, Pairs, or Cryptos.
Compare it to the normal RSI and you'll see the underlying calculation is the same, but the period changes automatically.
The EMA provides an earlier indicator of breakouts.
You don't need to wait for this RSI to become "overbought" or "oversold" by crossing the typical 80/20 levels.
Simply observing when the RSI crosses the EMA line can act as confirmation for your other indicators much faster than typical momentum-based indicators.
FAQ
Why is your script Protected?
Users like to take my open-source code and charge to use it without my permission.
How do I use this to trade?
Add it to your chart and see what stacks up with your current setup. I trade Forex, so what looks bad on my charts might look golden on yours.
How long have you been doing this?
I've been coding for about 8 years and actively trading for 2 years. My degree is in Robotics Engineering and I became obsessed with investing at 22.
How do you trade?
Hurst + SNR + MESA MAMA + ATR + LSTM + Pure Grid. You can't completely code this setup using Pinescript, but if you learn C++ or Python you're there!
Are your returns good?
I average 0.68% every weekday or 22.65% monthly, using the method above.
Can you build my indicator or strategy?
Absolutely! If it hasn't been done before and it improves our community, then consider it done.
But can you build an indicator or strategy for me ?
Citing the house rules, I cannot solicit for any purpose. So saying "PM me" would be a grievous violation of said rules, obviously.
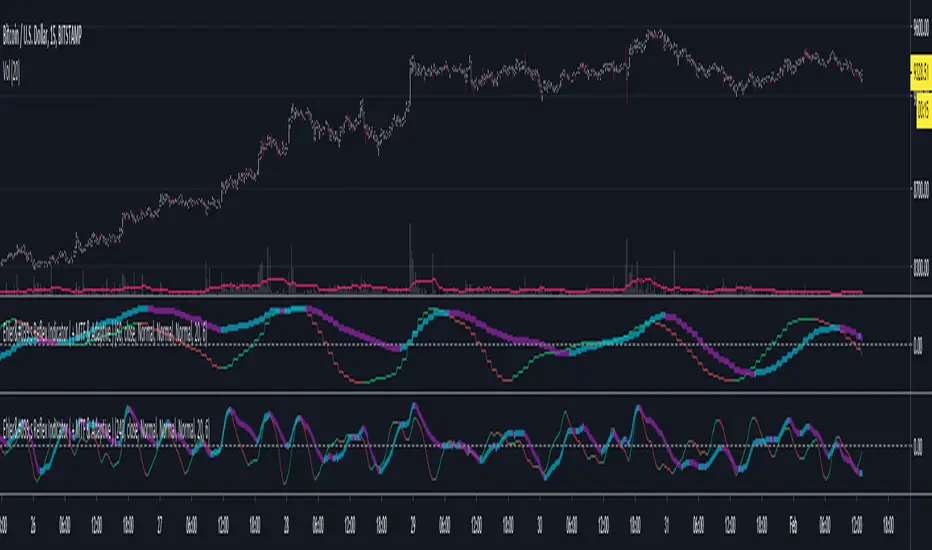
Ehler's Reflex Indicator ( + MTF & Adaptive )Implementation of Ehler's Reflex Indicator from TASC Feb 2020.
Optional MTF and fixed/adaptive length based on one of Ehler's cycle measurements.
Optional settings for his recommended 2 bar averaging, can apply the averaging to either/and source ie (close + close ) / 2, the output of the smoothing filter portion of the calculation or the final indicator output.
Green/Red : Reflex/Cycle
Aqua/Purple : Trend
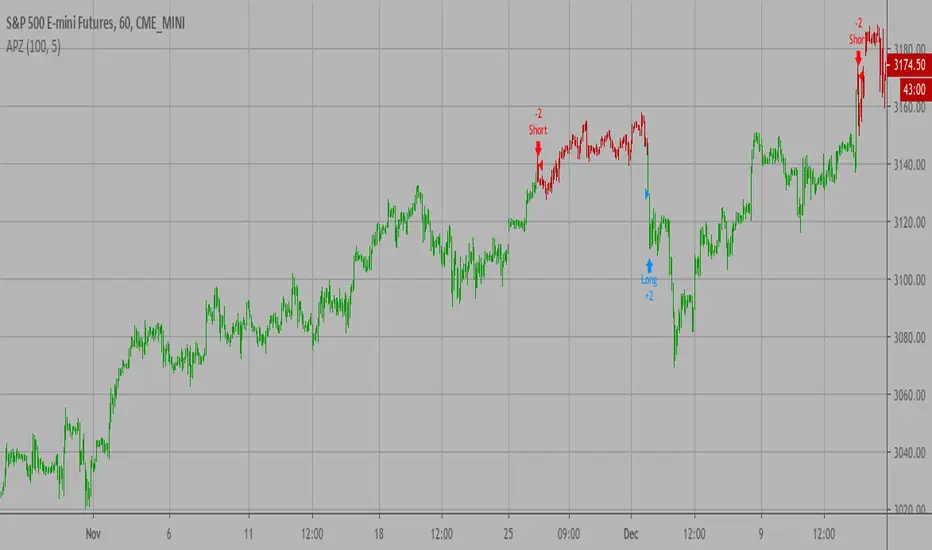
Adaptive Price Zone Backtest The adaptive price zone (APZ) is a volatility-based technical indicator that helps investors
identify possible market turning points, which can be especially useful in a sideways-moving
market. It was created by technical analyst Lee Leibfarth in the article “Identify the
Turning Point: Trading With An Adaptive Price Zone,” which appeared in the September 2006 issue
of the journal Technical Analysis of Stocks and Commodities.
This indicator attempts to signal significant price movements by using a set of bands based on
short-term, double-smoothed exponential moving averages that lag only slightly behind price changes.
It can help short-term investors and day traders profit in volatile markets by signaling price
reversal points, which can indicate potentially lucrative times to buy or sell. The APZ can be
implemented as part of an automated trading system and can be applied to the charts of all tradeable assets.
WARNING:
- For purpose educate only
- This script to change bars colors.
Adaptive Price Zone Strategy The adaptive price zone (APZ) is a volatility-based technical indicator that helps investors
identify possible market turning points, which can be especially useful in a sideways-moving
market. It was created by technical analyst Lee Leibfarth in the article “Identify the
Turning Point: Trading With An Adaptive Price Zone,” which appeared in the September 2006 issue
of the journal Technical Analysis of Stocks and Commodities.
This indicator attempts to signal significant price movements by using a set of bands based on
short-term, double-smoothed exponential moving averages that lag only slightly behind price changes.
It can help short-term investors and day traders profit in volatile markets by signaling price
reversal points, which can indicate potentially lucrative times to buy or sell. The APZ can be
implemented as part of an automated trading system and can be applied to the charts of all tradeable assets.
Green color is long.
Red color is short.
WARNING:
- For purpose educate only
- This script to change bars colors.

Adaptive Price Zone Indicator The adaptive price zone (APZ) is a volatility-based technical indicator that helps investors
identify possible market turning points, which can be especially useful in a sideways-moving
market. It was created by technical analyst Lee Leibfarth in the article “Identify the
Turning Point: Trading With An Adaptive Price Zone,” which appeared in the September 2006 issue
of the journal Technical Analysis of Stocks and Commodities.
This indicator attempts to signal significant price movements by using a set of bands based on
short-term, double-smoothed exponential moving averages that lag only slightly behind price changes.
It can help short-term investors and day traders profit in volatile markets by signaling price
reversal points, which can indicate potentially lucrative times to buy or sell. The APZ can be
implemented as part of an automated trading system and can be applied to the charts of all tradeable assets.

Efficient Trend Step ChannelIntroduction
The efficient trend-step indicator is a trend indicator that make use of the efficiency ratio in order to adapt to the market trend strength, this indicator originally aimed to remain static during ranging states while fitting the price only when large variations occur. The trend step indicator family unlike most moving averages has a boxy appearance and could therefore not be classified as smooth, this makes it an indicator relatively uninteresting to use as input for other non-trending indicators such as oscillators.
Today a channel indicator making use of the efficient trend-step is proposed, the indicator has an upper and a lower extremity who can be used for breakout or support and resistance methodologies, however we will see that the indicator is sometimes able to return accurate support and resistance levels.
The Indicator
The indicator has the same settings has the efficient trend step indicator, length control the period of the efficiency ratio, fast control the period of the rolling standard deviation used for trending states, slow control the period of the rolling standard deviation used for ranging states, fast should be lower than slow , if both are equal then the indicator is equal to the classical trend step indicator and length does no longer affect the indicator output. Lower values of fast/slow will make the indicator more reactive to small variations thus changing direction more often.
The color changes you can see on the indicator are changed depending on the prior direction took by the indicator output, if the indicator where higher than its precedent value, then the color will be blue until the indicator is lower than its precedent value. Those colors help you have an estimate of the current trend direction.
Channel Calculation And Role
The extremities made from the efficient trend step allow for more advanced trading rules, they can act as stop/target level and can also give a rough estimate of the current market volatility, with wider extremities indicating a more volatile market.
The extremities are made directly from the dev element used by the efficient trend-step, the upper extremity is made by summing the efficient trend step with the value of dev when the efficient trend step change, the lower extremity is made the same way but the value is subtracted instead.
Is it a weird choice ? It sure is strange to see such approach, the absolute rolling average error between the price and the efficient trend step could have been a logical measure but using dev instead is more efficient and also allow for a more adaptive approach which can benefit the support and resistance methodology, the last reason is because i didn't wanted to "denature" the trend-step signature of the indicator.
The figure above represent the measurement used for making the extremities (in green).
Since the previously described measure change only when the efficient trend step change, we can conclude that such measure is representative of a relatively large variation, since the efficient trend step aim to only change when a large variations appear.
We can see that the upper extremity acted as an accurate resistance in this upper variation of AMD,
Here as well, however like other bands indicators it is safer to take into account the current trend direction, a strong uptrend will have less difficulties crossing the upper extremity, therefore it might be better to rely on the support (lower extremity) on an up-trending market (indicator in blue), and on the resistance (upper extremity) on an down-trending market (indicator in orange).
The figure above show support and resistances signals, a cross represent a false signal, while green arrows represent correct ones with their respective direction.
Conclusion
The presented indicator add more possibilities to the interpretation of the efficient trend step, the extremities can act as stop/target level, however this use has to be controlled, and the level should be in accordance to your risk/reward ratio.
Showcasing another trend-step indicator was a real pleasure. Thanks for reading :)

Minkowski Distance Factor Adaptive Period MACDHi, this script comes from the idea that Ricardo Santos' Minkovski Distance Function is transferred to the period as a factor.
Minkowski distance is used as a percentage factor with the help of Relative Strength Index function.
Minkowski Distance Function Script :
And thus an adaptive MACD was created.
This script can give much better results in more optimized larger periods.
I leave the decision to determine the periods and weights.
I used the weights of 9,12,26 and periods created with multiplied by factor.
Regards.

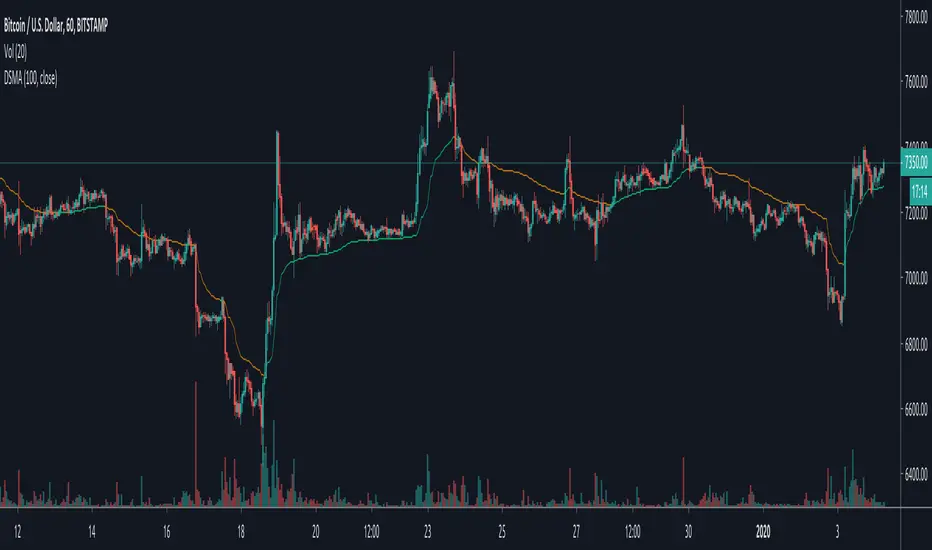
Deviation Scaled Moving Average [ChuckBanger]This is a deviation scaled moving average original designed by John Ehlers. It is a new adaptive moving average that has the ability to rapidly adapt to volatility in price movement with minimal lag. Because it is so smooth and adapts to the volatility of the market it is by far a really great tool for spotting trend changes
Bar Strength Index (BSI) by CryptorhythmsBar Strength Index (BSI) by Cryptorhythms
Intro
BSI is an totaly new and original indicator derived from Internal Bar Strength. It can be classified as similar to an RSI, but its method of calculation is very different so it sometimes gives an edge where RSI does not.
In the chart I have included RSI (red line) as a comparison for you to contrast BSI with.
Description
The formula for Internal Bar Strength is:
IBS = (close - low) / (high - low) * 100
The original IBS and thus this derivitive (BSI) are meant for higher timeframe analysis. Working best on daily, weekly or monthly charts. I take that original IBS formula and create something smoother and easier to understand - The Bar Strength Index !
Options
💠There is an option for smoothing which I recommend using.
💠Also options to make the scaling adaptive, or to leave it static.
💠A normalization option is available to create a bounded oscillator (easier for alerts/algos).
💠You can choose an MA type and length to create a signal line for it as well.
💠Lastly I also included the ability to setup overbought and oversold zones for better alert creation possibilities (crossovers / crossunders).
👍 We hope you enjoyed this indicator and find it useful! We post free crypto analysis, strategies and indicators regularly. This is our 77th script on Tradingview!

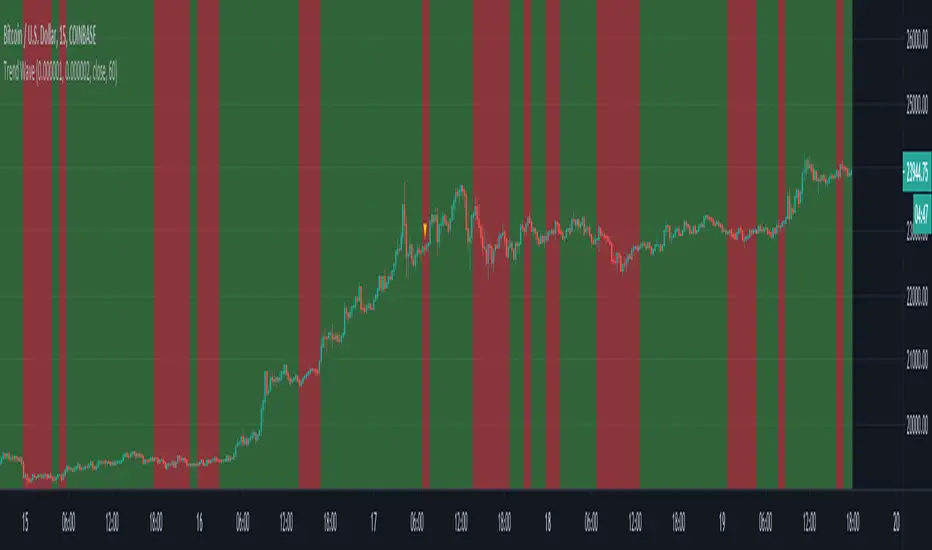
Trend WaveHello Traders!
You know, I can sill remember the first time I started tinkering with Pinescript. As I had no prior programming experience, I learned by experimenting with other open-source scripts on TradingViews Marketplace. Tearing apart and combining interesting scripts to see what the output would be. @ChrisMoody was a huge source of inspiration for learning, and I wanted to thank him, as well as @TheLark for the concept behind this script.
The Trend Wave is based on @ChrisMoody's PPO-PercentileRank-Mkt-Tops-Bottoms , which also happens to be based on @TheLark's TheLark-Laguerre-PPO/ .
Within my experimentation, I found that if I isolate the ppoT & ppoB variables and plot them calculated from extremely small decimals, you can get an extremely fast reacting, mirroring trend detector.
Within the script, you have the ability to plot the background colors based on trend to make it easier to see where crossovers occured, as well as a Mirror Input to view the mirrored version of the script.
-@DayTradingOil