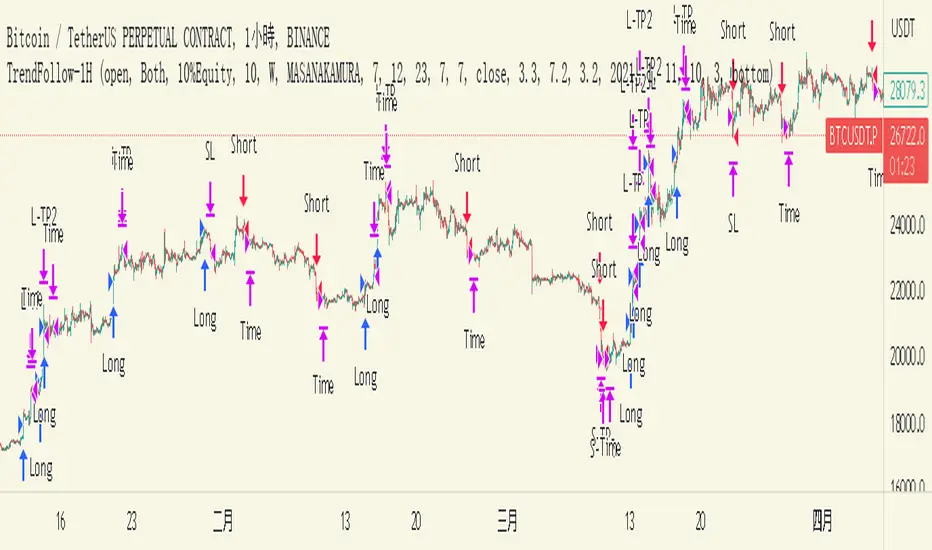
TrendFollow-1HThis is a trading strategy specially used on btcusdtperp in binance 1H chart
The most important part of this strategy is to use Support and Resistance with trading volume
Auxiliary indicators are include Directional Movement Index, trading volume, Commodity Channel Index,volume-weighted average price,Range Filter
Why is it not applicable to other trading varieties or exchanges?
Because the activity of each trading target is different from the trading volume, this strategy is very focused on the change of trading volume, so it may not be applicable to every trading variety
The idea of this strategy is to chase when the trend in the market is clear
Determine whether to break support or resistance to identify trends
But the market is full of false breakouts
Therefore, trading volume is an important indicator for judging the true and false.
Therefore, when the price breaks through support or resistance, accompanied by a huge trading volume, and forms a resonance with auxiliary indicators, the strategy will follow the trend, a time stop loss is also set. After entering the market, if there is no immediate profit to the stop profit, you will leave the market first.
But the market is always random, so the profit and loss ratio must be taken into account
Use a fixed stop loss space in exchange for a larger profit space, and ensure that the expected value is positive to make stable profits in the market
Therefore, this strategy uses 3.2% stop loss, 3.3% Take profit1 and 7.2% take profit2
About 1.5:1 profit and loss ratio to ensure positive expected value
Because the market has a clear trend only about 10% of the time
So the trading frequency of this strategy is very low
According to the backtest of up to 2021-01-01 till now , it takes about 5 days to make a transaction
User can choose their own leverage to obtain higher returns. But be sure to prioritize risk.
In order to prevent you from using this strategy without knowing it, the trading date of this strategy is only executed until the release date, and positions will not be opened and closed for subsequent markets.
You can contact me if you want to know more about this strategy
這是專門用於幣安1H圖表中btcusdtperp的交易策略
本策略最重要的部分是將支撐和阻力與交易量一起使用
輔助指標包括ADX,成交量,CCI,VWAP,Range Filter等
為什麼不適用於其他交易品種或交易所?
由於每個交易標的的活躍度與交易量不同,本策略非常注重交易量的變化,因此不一定適用於每個交易品種
這個策略的方法是在趨勢明朗的時候進行趨勢跟隨
確定是否打破支撐或阻力以識別趨勢
但市場充滿假突破
因此,成交量是判斷真假的重要指標。
當價格突破支撐位或阻力位,伴隨著巨大的成交量,並與輔助指標形成共振時,策略會順勢而為,同時設置時間止損。進場後,如果沒有立即獲利到止盈,就離場。
但市場總是隨機的,所以必須考慮盈虧比
用固定的止損空間換取更大的盈利空間,保證預期值為正,才能在市場中穩定獲利
因此,該策略使用 3.2% 止損、3.3% 止盈1 和 7.2% 止盈2
約1.5:1盈虧比,確保正期望值
因為市場只有大約 10% 的時間有明顯的趨勢
所以這個策略的交易頻率很低
根據2021-01-01至今的回測,交易頻率大約5天一次
用戶也可以選擇適合自己的槓桿以獲得更高的收益。但一定要優先考慮風險。
為防止您在不知情的情況下使用本策略,本策略的運行交易的日期僅至2023-05-30止,後續日期將不開倉和平倉。
如果您想了解更多有關此策略的信息,可以聯繫我。
ADX
Chop and Trend Index (CTI)The Chop and Trend Index (CTI) is a unique indicator that provides a different perspective on market conditions compared to traditional oscillators. It is designed to identify periods of market chop and strong trends, and it does so by combining two key components: the number of halfback taps and the strength of the trend.
The CTI is calculated by first determining the number of halfback taps over a user-defined length of time. A halfback tap occurs when the high or low of a bar reaches the midpoint (halfback level) of the previous bar. This is a measure of market chop: the more halfback taps, the choppier the market. The fewer halfback taps, the stronger the trend.
The strength of the trend is determined using the Average Directional Index (ADX), a popular trend strength indicator. The ADX is calculated based on the directional movement of the market, with higher values indicating stronger trends.
The CTI combines these two components by multiplying the normalized number of halfback taps by the ADX value. This results in an indicator that rises during strong trends with few halfback taps (either up or down) and falls during periods of market chop.
The CTI is not a directional indicator. Unlike the Relative Strength Index (RSI) or other oscillators, high values do not indicate overbought conditions, and low values do not indicate oversold conditions. Instead, high values indicate a strong trend (and possibly trend exhaustion), while low values indicate strong chop (and possibly an impending breakout in either direction).
The CTI can be used on any market and any timeframe, but it may be particularly useful on longer timeframes where periods of chop and trend are more pronounced.
The CTI includes several user inputs :
Length : This determines the number of bars over which the number of halfback taps is calculated. Increasing this value will make the CTI less sensitive to recent market conditions, while decreasing it will make the CTI more sensitive.
Normalization Window Length : This determines the number of bars over which the CTI is normalized. The CTI is normalized to a scale of 0 to 100 to make it easier to compare across different markets and timeframes.
Chop Threshold : This is the CTI value below which an alert will be triggered indicating a period of severe chop. This could signal an impending breakout and potential upcoming volatility.
Trend Exhaustion Threshold : This is the CTI value above which an alert will be triggered indicating potential trend exhaustion. This could signal a possible mean reversion.
The CTI also includes four colored threshold lines at 10, 25, 75, and 90. These thresholds can be used as a guide to identify periods of chop and trend. For example, CTI values below 10 or above 90 could indicate extreme conditions.
The CTI provides two alert conditions :
Low Threshold Crossed : This alert is triggered when the CTI falls below the user-defined Chop Threshold. This could signal a period of severe chop and the potential for upcoming volatility.
High Threshold Crossed : This alert is triggered when the CTI rises above the user-defined Trend Exhaustion Threshold. This could signal potential trend exhaustion and the possibility of mean reversion.
In conclusion, the CTI is a unique and versatile indicator that can provide valuable insights into market conditions. By identifying periods of chop and trend, it can help traders anticipate potential breakouts and reversals, and adjust their strategies accordingly.

Volatility Adjusted ADX (VADX)I sincerely wish to express my heartfelt gratitude to the vast community of coders on TradingView who have previously crafted various Average Directional Index (ADX) scripts. Their innovative approaches have laid a solid foundation, and I'm incredibly grateful for their inspiring work. In essence, their accomplishments have ignited the creative spark that led to the development of the Volatility Adjusted ADX (VADX) script.
VADX is not your run-of-the-mill script. It distinguishes itself from the myriad of ADX indicators on TradingView due to its unique volatility-adjustment mechanism. The primary purpose of this script is to augment the ADX's ability to quantify trend strength by introducing a layer of sensitivity to volatility shifts through the Average True Range (ATR). The interaction between these two crucial market measurements is where the novelty lies.
While the standard ADX does an excellent job of diagnosing the trend's vigor, its evaluation can sometimes be skewed when markets oscillate between periods of high and low volatility. Integrating the ATR – a reliable indicator of market volatility – into the ADX calculation mitigates this limitation, resulting in a more robust, volatility-adjusted trend strength measurement.
The specifics of the mathematical adjustment, our secret ingredient, will remain undisclosed for proprietary reasons. Nevertheless, I assure you that it creates a dynamic and balanced interplay between the trend strength and volatility, enabling a more nuanced understanding of the market.
The VADX script is user-friendly and includes three main inputs: ADX Smoothing, DI Length, and ATR Length. The ADX Smoothing parameter refines the ADX calculation, DI Length determines the period for the Directional Movement System calculation, and the ATR Length sets the period for the Average True Range.
Using this indicator is as easy as pie. After adding it to your chart, VADX will manifest itself as a separate panel beneath your price chart. When the VADX is escalating, it indicates that the strength of the trend is intensifying. Conversely, a declining VADX suggests diminishing trend strength. Two horizontal lines at the 25 and 75 levels provide a simple interpretation guide – they denote weak and strong trend phases, respectively.
This robust indicator is adaptable and can be effectively applied across multiple markets - from stocks, forex, and futures to cryptocurrencies. It also delivers valuable insights on any timeframe. However, as with any new indicator, I highly recommend initial testing and optimization to match your unique trading style and objectives.
To wrap up, the VADX indicator sets itself apart with its novel volatility adjustment, a feature not commonly found in existing TradingView scripts. This distinctive capability affords traders a more comprehensive view of the trend's strength by accounting for market volatility, adding an extra layer of depth to traditional ADX interpretation. I sincerely hope that this script enriches your trading arsenal and assists you in navigating the market with enhanced precision. As always, happy trading!

Dynamic Action Convergence DivergenceGoodbye MACD. Hello DACD.
The Dynamic Action Convergence Divergence (DACD) indicator presents a unique approach to understanding market trends and potential price reversals. This indicator is distinctly different from the currently published scripts in the following ways:
1. The DACD is rooted in the principles of the Average Directional Index (ADX) — especially as construed by the helpful work of @robertkowalski — but innovates by focusing on the divergence and convergence of the directional movement indicators (DI+ and DI-). This focus offers a more dynamic perspective on price action.
2. The DACD incorporates a histogram representation of the difference between DI+ and DI-, making it easier to visually interpret periods of divergence (potential reversal points) and convergence (potential continuation points).
3. It further enhances interpretation by applying a familiar color scheme to the histogram, allowing for an immediate visual understanding of the trend direction and its strength.
4. Unique to the DACD, it scales the difference between DI+ and DI-, applies a moving average, and then represents this as a line on the graph (referred to as "DI+ - DI-"). This line provides a smoothed view of the difference between DI+ and DI-, offering additional insight into the trend's characteristics.
5. Finally, a second moving average is calculated over the "DI+ - DI-" line, creating a signal line akin to the MACD's signal line. This signal line provides a benchmark to the "DI+ - DI-" line, indicating potential points of trend exhaustion and reversal.
The DACD can be used across various markets, including equities, commodities, forex, and cryptocurrencies, making it a versatile tool for any trader's arsenal. As with any technical indicator, the DACD should be used in conjunction with other indicators and forms of analysis to confirm signals and make more informed trading decisions.
The DACD excels in trending markets where it can highlight potential continuation and reversal points. However, during periods of consolidation or sideways moving markets, the DACD may provide less reliable signals. Therefore, it's essential to consider the overall market context when using the DACD.
The originality of the DACD lies in its novel application of the concepts from the ADX, its unique presentation style, and the additional moving averages applied to the difference between DI+ and DI-. These factors contribute to a unique trading indicator that stands apart from the crowd and offers new opportunities for technical analysis.
~~~
POSTSCRIPT: DACD VS MACD
Goodbye MACD. Hello DACD.
The MACD and DACD, while visually similar due to the familiar color scheme, are fundamentally different in their logic and data processing.
MACD is a trend-following momentum indicator, using the relationship between two moving averages of a security’s price. Its color scheme is well-recognized, assisting traders in quickly interpreting market momentum and potential trend shifts.
On the other hand, DACD, while maintaining a similar visual style for ease of adoption, is rooted in the principles of the Average Directional Index (ADX). It focuses on the divergence and convergence of the directional movement indicators (DI+ and DI-), providing a dynamic perspective on price action.
The familiar color scheme is purposefully used to facilitate easier transition for traders from MACD to DACD, despite their different underpinnings. This allows users to intuitively understand the new indicator while benefiting from its unique insight into market trends.

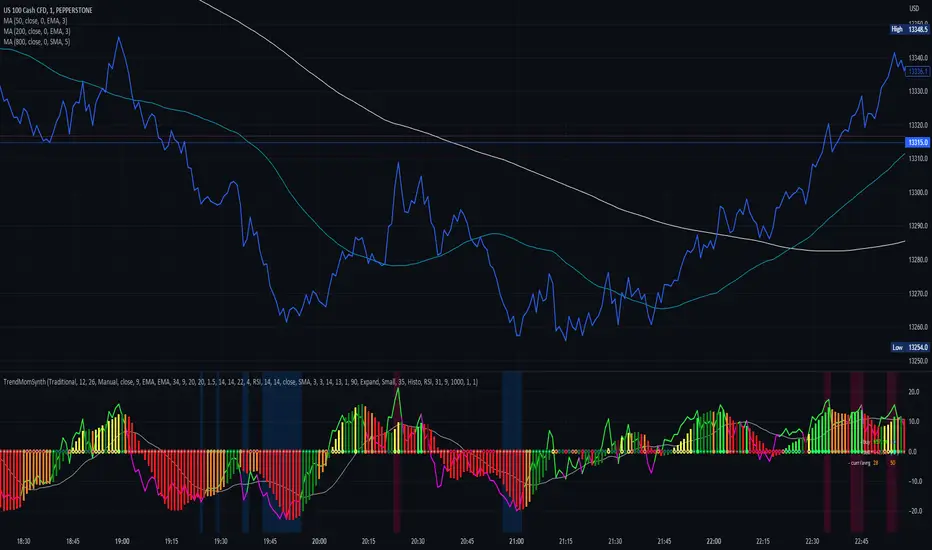
Trend Momentum SynthesizerBy analyzing the MACD (Moving Average Convergence Divergence) and Squeeze Momentum indicators, this indicator helps identify potential bullish, bearish, or undecided market conditions.
The algorithm within considers the positions of the MACD and Squeeze Momentum indicators to determine the overall market sentiment. When the indicators align and indicate a bullish market condition, the indicator's plot color will be either dark green, green, yellow, or lime, indicating a potential bullish trend. Conversely, if the indicators align and indicate a bearish market condition, the plot color will be maroon or red, denoting a potential bearish trend. When the indicators are inconclusive, the plot color will be orange, suggesting an undecided market.
The ADX is an addon component of this indicator, helping to assess the strength of a trend. By analyzing the ADX, the indicator determines whether a trend is strong enough, providing additional confirmation for potential trade signals. The ADX smoothing and DI (Directional Index) length parameters can be customized to suit individual trading preferences.
By combining these indicators, the algorithm provides traders with a comprehensive view of the market, helping them make informed trading decisions. It aims to assist traders in identifying potential market opportunities and aligns with the objective of maximizing trading performance.
How to use the indicator:
Note: I used back-testing for fine tuning do not base your trades on signals from the testing framework.
Fetch ATR + MA StrategyA trend following indicator that allows traders/investors to enter trades for the long term, as it is mainly tested on the daily chart. The indicator fires off buy and sell signals. The sell signals can be turned off as trader can decide to use this indicator for long term buy signals. The buy signals are indicated by the green diamonds, and the red diamonds show the points on then chart where the asset can be sold.
The indicator uses a couple indicators in order to generate the buy signals:
- ADX
- ATR
- Moving Average of ATR
- 50 SMA
- 200 SMA
The buy signal is generated at the cross overs of the 50 and 200 SMA's while the ATR is lower than then Moving Average of the ATR. The buy signal is fired when these conditions are met and if the ADX is lower than 30.
The thought process is as follows:
When the ATR is lower than its moving average, the price should be in a low volatilty environment. An ADX between 25 and 50 signals a Strong trend. Every value below 25 is an absent or weak trend. So entering a trade when the volatilty is still low but increasing, you'll be entering a trade at the start of a new uptrend. This mechanism also filters out lots of false signals of the simple cross overs.
The sell signals are fired every time the 50 SMA drops below the 200 SMA.

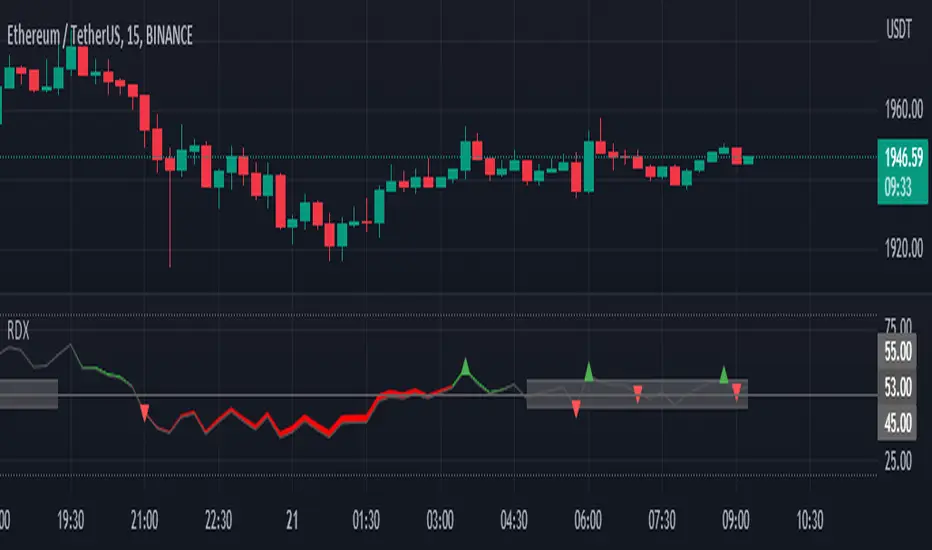
RDX Relative Directional IndexRDX Relative Directional Index, Strength + Direction + Trend. This indicator is the combination of RSI and DMI or ADX. RDX aims at providing Relative direction of the price along with strength of the trend. This acts as both RSI and Average Directional Index. as the strength grows the RSI line becomes wider and when there is high volatility and market fluctuation the line becomes thinner. Color decides the Direction. This indicator provides sideways detection of RSI signal.
RDX Width: This determines the strength of RSI and Strength of ADX, The strength grows RDX band grows wider, as strength decreases band shrinks and merge into the RSI line. for exact working simply disable RSI plot on the indicator. when there is no strength the RSI vanishes..
Technical:
RSI : with default 14 period
ADX : Default 14 period
RDX=RSI+(ADX-20)/5
Color Code:
Red: Down Direction
Green: Up Direction
Sideways:
A rectangular channel is plotted on RSI 50 Level
Oversold Overbought:
Oversold and Overbought Levels are plotted for normal RSI Oversold and Overbought detection.
Buy/Sell:
Buy sell signals from ADX crossover are plotted and its easy to determine
Strength + Direction + Trend in one go
Hope the community likes this...
Contibute for more ideas and indicators..
RiverFlow ADX ScreenerRiverFlow ADX Screener, Scans ADX and Donchian Trend values across various Timeframes. This screener provides support to the Riverflow indicator. Riverflow concept is based on Two indicators. Donchian Channel and ADX or DMI.
How to implement?
1.Donchian Channel with period 20
2. ADX / DMI 14,14 threshold 20
Entry / Exit:
1. Buy/Sell Signal from ADX Crossovers.
2. Trend Confirmation Donchian Channel.
3. Major Trend EMA 200
Buy/Sell:
After a buy/sell is generated by ADX Crossover, Check for Donchian Trend. it has to be in same direction as trend. for FTT trades take 2x limit. for Forex and Stocks take 1:1.5, SL must be placed below recent swing. One can use Riverflow indicator for better results.
ADX Indicator is plotted with
Plus: Green line
Minus: Red Line
ADX strength: plotted as Background area.
TREND: Trend is represented by Green and Red Area around Threshold line
Table:
red indicates down trend
green indicates up trend
grey indicates sideways
Weak ADX levels are treated sideways and a channel is plotted on ADX and PLUS and MINUS lines . NO TRADES are to be TAKEN on within the SIDEWAYS region.
Settings are not required as it purely works on Default settings. However Donchian Length can be changed from settings.
Timeframes below 1Day are screened. Riverflow strategy works on timeframe 5M and above timeframe. so option is not provided for lower timeframes.
Best suits for INTRADAY and LONG TERM Trading

Double Supertrend Entry with ADX Filter and ATR Exits/EntriesThe Double Supertrend Entry with ADX Filter and ATR Exits/Entries indicator is a custom trading strategy designed to help traders identify potential buy and sell signals in trending markets. This indicator combines the strengths of multiple technical analysis tools, enhancing the effectiveness of the overall strategy.
Key features:
Two Supertrend Indicators - The indicator includes two Supertrend indicators with customizable parameters. These trend-following indicators calculate upper and lower trendlines based on the ATR and price. Buy signals are generated when the price crosses above both trendlines, and sell signals are generated when the price crosses below both trendlines.
ADX Filter - The Average Directional Index (ADX) is used to filter out weak trends and only generate buy/sell signals when the market exhibits a strong trend. The ADX measures the strength of the trend, and a customizable threshold level ensures that trades are only entered during strong trends.
ATR-based Exits and Entries - The indicator uses the Average True Range (ATR) to set profit target and stop-loss levels. ATR is a measure of market volatility, and these levels help traders determine when to exit a trade to secure profit or minimize loss.
Performance Statistics Table - A table is displayed on the chart, recording and showing the total number of winning trades, losing trades, percentage of profitable trades, average profit, and average loss. This information helps traders evaluate the performance of the strategy over time.
The Double Supertrend Entry with ADX Filter and ATR Exits/Entries indicator is a powerful trend-following strategy that can assist traders in making more informed decisions in the financial markets. By combining multiple technical analysis tools and providing performance statistics, this indicator helps traders improve their trading strategy and evaluate its success.

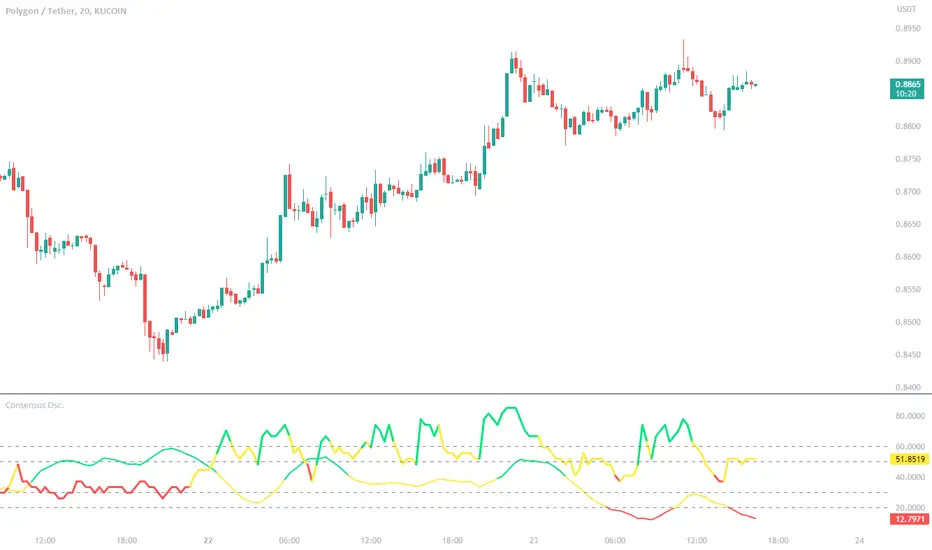
Consensus Oscillator with ADX (LeafAlgo)This indicator creates a normalized consensus from a set of other indicators -- Chande Momentum Oscillator (CMO), Detrended Price Oscillator (DPO), Momentum (MOM), Rate of Change (RoC), Relative Strength Index (RSI), the True Strength Index (TSI) Value line, Volume Oscillator, and a normalized Z-score.
The consensus is created by giving ranged values to each individual indicator. These individual values are added together, then put through a normalization function to create a 0-100 range. The scoring for each indicator is as follows:
CMO:
- If chandeMO <= -50, then the score is valued at -2
- If chandeMO > -50 and chandeMO <= -25, then the score is valued at -1
- If chandeMO > -25 and chandeMO < 25, then the score is valued at 0
- If chandeMO >= 25 and chandeMO < 50, then the score is valued at 1
- If chandeMO >= 50, then the score is valued at 2
DPO:
- If dpo <= -0.005, then the score is valued at -2
- If dpo > -0.005 and dpo <= -0.0025, then the score is valued at -1
- If dpo > -0.0025 and dpo < 0.0025, then the score is valued at 0
- If dpo >= 0.0025 and dpo < 0.005, then the score is valued at 1
- If dpo >= 0.005, then the score is valued at 2
MOM:
- If mom <= -0.05, then the score is valued at -2
- If mom > -0.05 and mom <= -0.025, then the score is valued at -1
- If mom > -0.025 and mom < 0.025, then the score is valued at 0
- If mom >= 0.025 and mom < 0.05, then the score is valued at 1
- If mom >= 0.05, then the score is valued at 2
ROC:
- If roc <= -20, then the score is valued at -2
- If roc > -20 and roc <= -10, then the score is valued at -1
- If roc > -10 and roc < 10, then the score is valued at 0
- If roc >= 10 and roc < 20, then the score is valued at 1
- If roc >= 20, then the score is valued at 2
RSI:
- If rsi <= 20, then the score is valued at -2
- If rsi > 20 and rsi <= 40, then the score is valued at -1
- If rsi > 40 and rsi < 60, then the score is valued at 0
- If rsi >= 60 and rsi < 80, then the score is valued at 1
- If rsi >= 80, then the score is valued at 2
TSI Value:
- If tsi <= -20, then the score is valued at -2
- If tsi > -20 and tsi <= -10, then the score is valued at -1
- If tsi > -10 and tsi < 10, then the score is valued at 0
- If tsi >= 10 and tsi < 20, then the score is valued at 1
- If tsi >= 20, then the score is valued at 2
Volume Oscillator:
- If vo <= -20, then the score is valued at -2
- If vo > -20 and vo <= -10, then the score is valued at -1
- If vo > -10 and vo < 10, then the score is valued at 0
- If vo >= 10 and vo < 20, then the score is valued at 1
- If vo >= 20, then the score is valued at 2
Normalized (-1 to +1) Z-Score:
- If z_n <= -0.5, then the score is valued at -2
- If z_n > -0.5 and z_n <= -0.25, then the score is valued at -1
- If z_n > -0.25 and z_n < 0.25, then the score is valued at 0
- If z_n >= 0.25 and z_n < 0.5, then the score is valued at 1
- If z_n >= 0.5, then the score is valued at 2
The consensus line is colored depending on the closing value of the line. The color is shown as lime if above 70, a darker green between 55 and 70, yellow between 45 and 55, orange between 30 and 45, and red below 30.
Additionally, there is a normalized ADX line added into the indicator to give further confirmation to trend strength. The normalized ADX line is shown as green if above 40, yellow between 40 and 20, and red below 20.
Horizontal lines have been added at 20/30 and 50/60 as semi-important levels to watch.
ADX Trend FilterADX Trend Filter Indicator is a traditional ADX indicator with a different presentation. its consist of two indicators EMA TREND and ADX / DMI
About Indicator:
1. BAND / EMA band to represent EMA Trend of EMA-12 and EMA-50
(Band is plotted at level-20 which is the Threshold level of DMI / ADX indicator)
2. Histogram showing the direction of ADX / DMI trend
3. Area behind the histogram showing ADX/DMI strength
How to use?
1. Histogram represents current Trend Red for Bearish / Green for Bullish
2. Area behind the histogram represents Strength of ADX / DMI Threshold level is 0-20(represented as band). (Area below the Band is Sideways)
3. Band represents the current MA Trend.
4. Buy Sell signals are plotted as triangles in red/green obtained from ADX / DMI Crossovers
Buy Signal (Green Triangle on band- ADX Crossover)
1.Band below Histogram must be Green
2.Histogram must be green
3.Area behind histogram must be above the lower trend band (20level) and visible
Sell Signal (Red Triangle on band- ADX Crossover)
1.Band below Histogram must be Red
2.Histogram must be Red
3.Area behind histogram must be above the lower trend band (20level) and visible
Alerts provided for ADX crossovers.

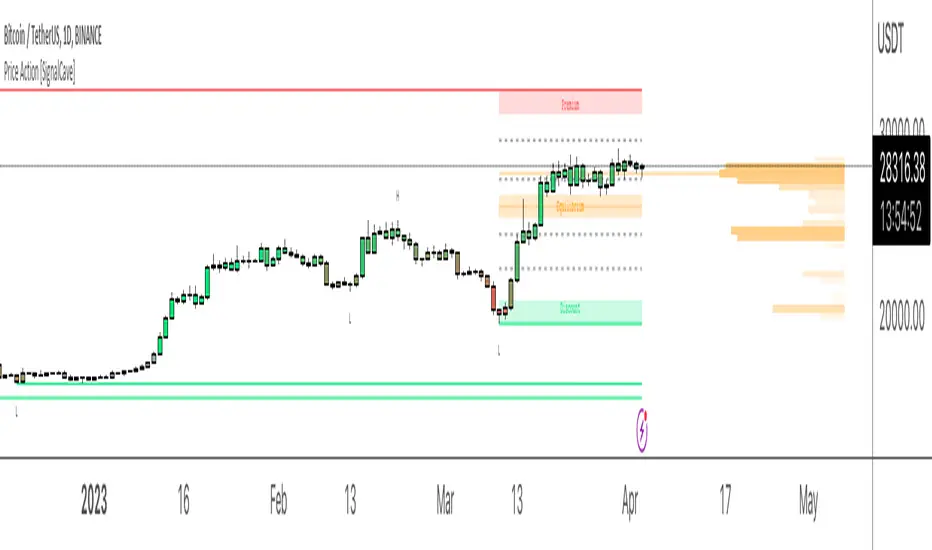
Price Action [SignalCave]Liquidation prices are calculated with Higher Timeframe usage of "Williams Fractals" indicator.
Sell side liquidity levels are shown with "L" text and a green solid lines.
Buy side liquidity levels are shown with "H" text and a red solid lines.
Premium and Discount zones are determined with latest untested buy/sell liquidity levels.
"Premium" means the asset price is overvalued, "Discount" means the asset is undervalued.
Once price hits any active liquidity level, "Premium and Discount" zone will be recalculated.
Premium and Discount have "Equilibrium" area which is center area of the whole zone.
Extra Support & Resistance levels calculation are based on Fibonacci. Levels are 23.6%, 38.2%, 61.8% and 78.6% .
Bars are painted based on asset's momentum. The asset momentum is calculated by the RSI and ADX indicators.
Volume profile shows trade activity during the "Premium and Discount" zone.
Adaptive Fusion ADX VortexIntroduction
The Adaptive Fusion ADX DI Vortex Indicator is a powerful tool designed to help traders identify trend strength and potential trend reversals in the market. This indicator uses a combination of technical analysis (TA) and mathematical concepts to provide accurate and reliable signals.
Features
The Adaptive Fusion ADX DI Vortex Indicator has several features that make it a powerful tool for traders. The Fusion Mode combines the Vortex Indicator and the ADX DI indicator to provide a more accurate picture of the market. The Hurst Exponent Filter helps to filter out choppy markets (inspired by balipour). Additionally, the indicator can be customized with various inputs and settings to suit individual trading strategies.
Signals
The enterLong signal is generated when the algorithm detects that it's a good time to buy a stock or other asset. This signal is based on certain conditions such as the values of technical indicators like ADX, Vortex, and Fusion. For example, if the ADX value is above a certain threshold and there is a crossover between the plus and minus lines of the ADX indicator, then the algorithm will generate an enterLong signal.
Similarly, the enterShort signal is generated when the algorithm detects that it's a good time to sell a stock or other asset. This signal is also based on certain conditions such as the values of technical indicators like ADX, Vortex, and Fusion. For example, if the ADX value is above a certain threshold and there is a crossunder between the plus and minus lines of the ADX indicator, then the algorithm will generate an enterShort signal.
The exitLong and exitShort signals are generated when the algorithm detects that it's a good time to close a long or short position, respectively. These signals are also based on certain conditions such as the values of technical indicators like ADX, Vortex, and Fusion. For example, if the ADX value crosses above a certain threshold or there is a crossover between the minus and plus lines of the ADX indicator, then the algorithm will generate an exitLong signal.
Usage
Traders can use this indicator in a variety of ways, depending on their trading strategy and style. Short-term traders may use it to identify short-term trends and potential trade opportunities, while long-term traders may use it to identify long-term trends and potential investment opportunities. The indicator can also be used to confirm other technical indicators or trading signals. Personally, I prefer to use it for short-term trades.
Strengths
One of the strengths of the Adaptive Fusion ADX DI Vortex Indicator is its accuracy and reliability. The indicator uses a combination of TA and mathematical concepts to provide accurate and reliable signals, helping traders make informed trading decisions. It is also versatile and can be used in a variety of trading strategies.
Weaknesses
While this indicator has many strengths, it also has some weaknesses. One of the weaknesses is that it can generate false signals in choppy or sideways markets. Additionally, the indicator may lag behind the market, making it less effective in fast-moving markets. That's a reason why I included the Hurst Exponent Filter and special smoothing.
Concepts
The Adaptive ADX DI Vortex Indicator with Fusion Mode and Hurst Filter is based on several key concepts. The Average Directional Index (ADX) is used to measure trend strength, while the Vortex Indicator is used to identify trend reversals. The Hurst Exponent is used to filter out noise and provide a more accurate picture of the market.
In conclusion, the Adaptive Fusion ADX DI Vortex Indicator is a versatile and powerful tool for traders. By combining technical analysis and mathematical concepts, this indicator provides accurate and reliable signals for identifying trend strength and potential trend reversals. While it has some weaknesses, its many strengths and features make it a valuable addition to any trader's toolbox.
---
Credits to:
▪️@cheatcountry – Hann Window Smoohing
▪️@loxx – VHF and T3
▪️@balipour – Hurst Exponent Filter

Momentum PlayTraders always need a confirmation of momentum in price action to ride the swings.
Momentum Play Indicator consists of the below:
Bullish Conditions :
1)EMA 8 above EMA 34 and rising
2)Candle close above 5 candle high
3) RSI above 60
4) Volume above 5 candles avg. volume
5) ADX above 20
Bearish Conditions :
1)EMA 8 below EMA 34 and falling
2)Candle close below 5 candle low
3) RSI below 40
4) Volume above 5 candles avg. volume
5) ADX above 20
Traders can change the inputs as per their liking to adjust as per their comfortable timeframe.
Credits: Special Thanks to Mr. DTBHAT for sharing the above conditions.

Soheil PKO's 5 min Hitman Scalp - 3MA + Laguerre RSI + ADX [Pt]Someone sent me this strategy found on YouTube. It is Soheil PKO's "The Best and Most Profitable Scalping Strategy" Best way to find out is to code it =)
This strategy uses Moving Average Ribbon, Laguerre RSI, and ADX. This script only displays the MA ribbon, you will need to add Laguerre RSI and ADX separately.
Long Entry Criteria:
- 16 EMA > 48 EMA > 200 SMA
- Laguerre RSI > 80
- ADX > 20
Long Exit Criterion:
- 16 EMA < 48 EMA
Short Entry Criteria:
- 16 EMA < 48 EMA < 200 SMA
- Laguerre RSI < 20
- ADX > 20
Short Exit Criterion:
- 16 EMA > 48 EMA
As mentioned in the video, risk management is very important, especially for scalping strategies. Therefore, I've added option for setting Stop Loss and Price Target in the options for you guys to play with.
All parameters are configurable.
Enjoy~~

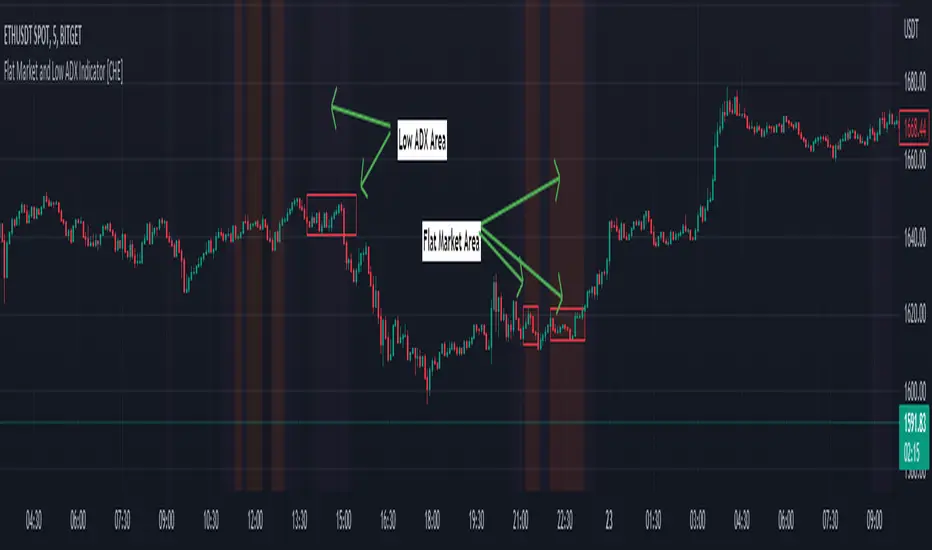
Flat Market and Low ADX Indicator [CHE]Why use the Flat Market and Low ADX Indicator ?
Flat markets, where prices remain within a narrow range for an extended period, can be both critical and dangerous for traders. In a flat market, the price action becomes less predictable, and traders may struggle to find profitable trading opportunities. As a result, many traders may decide to take a break from the market until a clear trend emerges.
However, flat markets can also be dangerous for traders who continue to trade despite the lack of clear trends. In the absence of a clear direction, traders may be tempted to take larger risks or make impulsive trades in an attempt to capture small profits. Such behavior can quickly lead to significant losses, especially if the market suddenly breaks out of its flat range, causing traders to experience large drawdowns.
Therefore, it is essential to approach flat markets with caution and to have a clear trading plan that incorporates strategies for both trending and flat markets. Traders may also use technical indicators, such as the Flat Market and Low ADX Indicator, to help identify flat markets and determine when it is appropriate to enter or exit a position.
The confluence between flat markets and low ADX readings can further increase the risk of trading during these periods. The ADX (Average Directional Index) is a technical indicator used to measure the strength of a trend. A low ADX reading indicates that the market is in a consolidation phase, which can coincide with a flat market. When a flat market occurs during a period of low ADX, traders should be even more cautious, as there is little to no directional bias in the market. In this situation, traders may want to consider waiting for a clear trend to emerge or using range-bound trading strategies to avoid taking excessive risks.
Introduction:
Pine Script is a programming language used for developing custom technical analysis indicators and trading strategies in TradingView. This particular script is an indicator designed to identify flat markets and low ADX conditions. In this description, we will delve deeper into the functionality of this script and how it can be used to improve trading decisions.
Description:
The first input in the script is the length of the moving average used for calculating the center line. This moving average is used to define the high and low range of the market. The script then calculates the middle value of the range by taking the double exponential moving average (EMA) of the high, low, and close prices.
The script then determines whether the market is flat by comparing the middle value of the range with the high and low values. If the middle value is greater than the high value or less than the low value, the market is not flat. If the middle value is within the high and low range, the script considers the market to be flat. The script also uses RSI filter settings to further confirm if the market is flat or not. If the RSI value is between the RSI min and max values, then the market is considered flat. If the RSI value is outside this range, the market is not considered flat.
The script also calculates the ADX (Average Directional Index) to determine whether it's in a low area. ADX is a technical indicator used to measure the strength of a trend. The script uses the ADX filter settings to define the ADX threshold value. If the ADX value is below the threshold value, the script considers the market to be in a low ADX area.
The script provides various input options to customize the display settings, including the option to show the flat market and low ADX areas. Users can choose their preferred colors for the flat market and low ADX areas and adjust the transparency levels to suit their needs.
Conclusion:
In conclusion, this Pine Script indicator is designed to identify flat market and low ADX conditions, which can help traders make informed trading decisions. The script uses a range of inputs and calculations to determine the market direction, RSI filter, and ADX filter. By customizing the display settings, users can adjust the indicator to suit their preferences and improve their trading strategies. Overall, this script can be a valuable tool for traders looking to gain an edge in the markets.
Acknowledgments:
Thanks to the Pine Script™ v5 User Manual www.tradingview.com
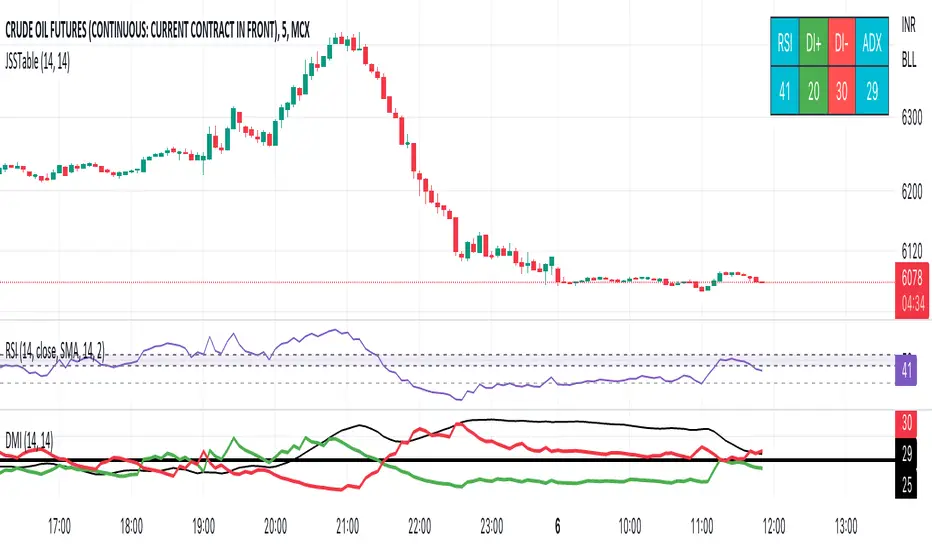
JSS Table - RSI, DI+, DI-, ADXSimple table to show the values for indicators which can be used to initiate trades:
RSI: Long above 55 // Short below 45 // Choppy between 45-55
DI+: Long above 25
DI-: Short above 25
Note when to avoid trend trades:
- If DI+ and DI- are both below 25 then market is choppy
- If RSI is between 45-55 then market is choppy
ADX Volume Trend
Thie indicator is a modified and upgraded version of the popular ADX tool.
ADX is used to determine the strength of a trend, and also to determine the direction in which the trend is likely to go.
With this script, I have added in the formula the usage of volume, leading to the following functionality.
The length is used to determine the period to calculate the trend strength and direction, and the average is used to then determine the oscillator and to confront the previous line.
The volume average determines how many volumes bars the indicator should use to determine if a volume bar is above or below average if volume mode is selected.
With the volume mode on, you'll get the DI+ and DI- lines, which are by default displayed as a histogram that calculates the difference between the two lines, called "Directional difference", are calculated using also the volume in the formula, multiplying the normal output by the volume multiplier. I suggest using this mode in high-volume markets.
The trend strength difference is the area calculated using the difference between the ADX line and his moving average and can be used to analyze divergences in the swing points.
It has a lot of improvements and new functionalities, like:
- Histogram to show the output at best
- Averages to compare the data
- The option to include the volume inside of the formula
- Other options and esthetic changes
This indicator is created to improve the usability of the popular ADX indicator, including the very important variable of the volumes, in fact, it's the best to use for the Volume Spread Analysis.

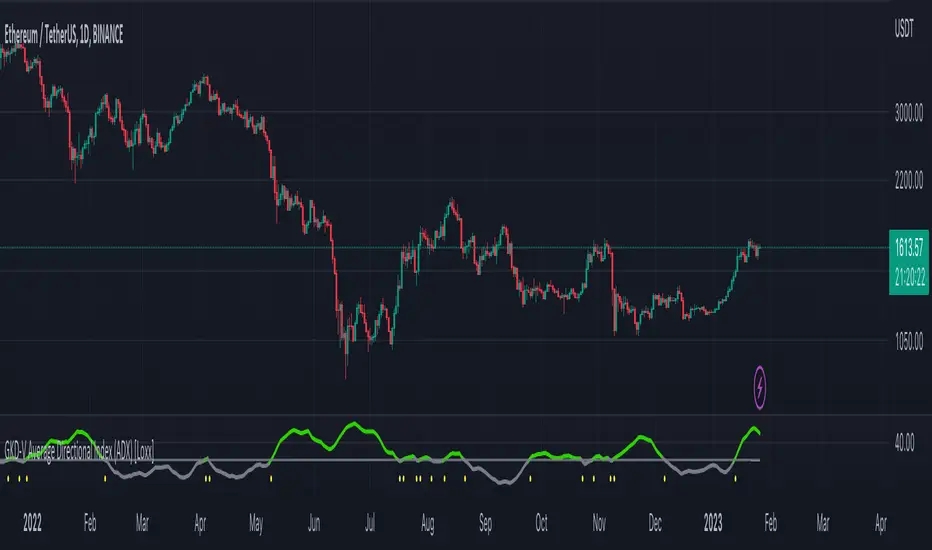
GKD-V Average Directional Index (ADX) [Loxx]Giga Kaleidoscope Average Directional Index (ADX) is a Volatility/Volume module included in Loxx's "Giga Kaleidoscope Modularized Trading System".
█ Giga Kaleidoscope Modularized Trading System
What is Loxx's "Giga Kaleidoscope Modularized Trading System"?
The Giga Kaleidoscope Modularized Trading System is a trading system built on the philosophy of the NNFX (No Nonsense Forex) algorithmic trading.
What is an NNFX algorithmic trading strategy?
The NNFX algorithm is built on the principles of trend, momentum, and volatility. There are six core components in the NNFX trading algorithm:
1. Volatility - price volatility; e.g., Average True Range, True Range Double, Close-to-Close, etc.
2. Baseline - a moving average to identify price trend
3. Confirmation 1 - a technical indicator used to identify trends.
4. Confirmation 2 - a technical indicator used to identify trends.
5. Continuation - a technical indicator used to identify trends.
6. Volatility/Volume - a technical indicator used to identify volatility/volume breakouts/breakdown.
7. Exit - a technical indicator used to determine when a trend is exhausted.
How does Loxx's GKD (Giga Kaleidoscope Modularized Trading System) implement the NNFX algorithm outlined above?
Loxx's GKD v1.0 system has five types of modules (indicators/strategies). These modules are:
1. GKD-BT - Backtesting module (Volatility, Number 1 in the NNFX algorithm)
2. GKD-B - Baseline module (Baseline and Volatility/Volume, Numbers 1 and 2 in the NNFX algorithm)
3. GKD-C - Confirmation 1/2 and Continuation module (Confirmation 1/2 and Continuation, Numbers 3, 4, and 5 in the NNFX algorithm)
4. GKD-V - Volatility/Volume module (Confirmation 1/2, Number 6 in the NNFX algorithm)
5. GKD-E - Exit module (Exit, Number 7 in the NNFX algorithm)
(additional module types will added in future releases)
Each module interacts with every module by passing data between modules. Data is passed between each module as described below:
GKD-B => GKD-V => GKD-C(1) => GKD-C(2) => GKD-C(Continuation) => GKD-E => GKD-BT
That is, the Baseline indicator passes its data to Volatility/Volume. The Volatility/Volume indicator passes its values to the Confirmation 1 indicator. The Confirmation 1 indicator passes its values to the Confirmation 2 indicator. The Confirmation 2 indicator passes its values to the Continuation indicator. The Continuation indicator passes its values to the Exit indicator, and finally, the Exit indicator passes its values to the Backtest strategy.
This chaining of indicators requires that each module conform to Loxx's GKD protocol, therefore allowing for the testing of every possible combination of technical indicators that make up the six components of the NNFX algorithm.
What does the application of the GKD trading system look like?
Example trading system:
Backtest: Strategy with 1-3 take profits, trailing stop loss, multiple types of PnL volatility, and 2 backtesting styles
Baseline: Leader Exponential Moving Average
Volatility/Volume: Average Directional Index (ADX) as shown on the chart above
Confirmation 1: Double Smoothed Stochastic of Momentum
Confirmation 2: Jurik Turning Point Oscillator
Continuation: Fisher Transform
Exit: Rex Oscillator
Each GKD indicator is denoted with a module identifier of either: GKD-BT, GKD-B, GKD-C, GKD-V, or GKD-E. This allows traders to understand to which module each indicator belongs and where each indicator fits into the GKD protocol chain.
Giga Kaleidoscope Modularized Trading System Signals (based on the NNFX algorithm)
Standard Entry
1. GKD-C Confirmation 1 Signal
2. GKD-B Baseline agrees
3. Price is within a range of 0.2x Volatility and 1.0x Volatility of the Goldie Locks Mean
4. GKD-C Confirmation 2 agrees
5. GKD-V Volatility/Volume agrees
Baseline Entry
1. GKD-B Baseline signal
2. GKD-C Confirmation 1 agrees
3. Price is within a range of 0.2x Volatility and 1.0x Volatility of the Goldie Locks Mean
4. GKD-C Confirmation 2 agrees
5. GKD-V Volatility/Volume agrees
6. GKD-C Confirmation 1 signal was less than 7 candles prior
Continuation Entry
1. Standard Entry, Baseline Entry, or Pullback; entry triggered previously
2. GKD-B Baseline hasn't crossed since entry signal trigger
3. GKD-C Confirmation Continuation Indicator signals
4. GKD-C Confirmation 1 agrees
5. GKD-B Baseline agrees
6. GKD-C Confirmation 2 agrees
1-Candle Rule Standard Entry
1. GKD-C Confirmation 1 signal
2. GKD-B Baseline agrees
3. Price is within a range of 0.2x Volatility and 1.0x Volatility of the Goldie Locks Mean
Next Candle:
1. Price retraced (Long: close < close or Short: close > close )
2. GKD-B Baseline agrees
3. GKD-C Confirmation 1 agrees
4. GKD-C Confirmation 2 agrees
5. GKD-V Volatility/Volume agrees
1-Candle Rule Baseline Entry
1. GKD-B Baseline signal
2. GKD-C Confirmation 1 agrees
3. Price is within a range of 0.2x Volatility and 1.0x Volatility of the Goldie Locks Mean
4. GKD-C Confirmation 1 signal was less than 7 candles prior
Next Candle:
1. Price retraced (Long: close < close or Short: close > close )
2. GKD-B Baseline agrees
3. GKD-C Confirmation 1 agrees
4. GKD-C Confirmation 2 agrees
5. GKD-V Volatility/Volume Agrees
PullBack Entry
1. GKD-B Baseline signal
2. GKD-C Confirmation 1 agrees
3. Price is beyond 1.0x Volatility of Baseline
Next Candle:
1. Price is within a range of 0.2x Volatility and 1.0x Volatility of the Goldie Locks Mean
3. GKD-C Confirmation 1 agrees
4. GKD-C Confirmation 2 agrees
5. GKD-V Volatility/Volume Agrees
█ Average Directional Index (ADX)
What is Average Directional Index (ADX)
Trading in the direction of a strong trend reduces risk and increases profit potential. The average directional index (ADX) is used to determine when the price is trending strongly. In many cases, it is the ultimate trend indicator. After all, the trend may be your friend, but it sure helps to know who your friends are.
ADX is used to quantify trend strength. ADX calculations are based on a moving average of price range expansion over a given period of time. The default setting is 14 bars, although other time periods can be used. ADX can be used on any trading vehicle such as stocks, mutual funds, exchange-traded funds and futures.
ADX is plotted as a single line with values ranging from a low of zero to a high of 100. ADX is non-directional; it registers trend strength whether price is trending up or down. The indicator is usually plotted in the same window as the two directional movement indicator (DMI) lines, but for our purposes here, we are only concerned with the ADX itself.
Signals
Traditional: ADX is above the threshold cutoff; both longs/shorts triggered when ADX is above the threshold cutoff
Crossing: ADX crosses above/below the threshold cutoff; longs or shorts are only valid on the candle where the cross happens. Both cross-ups and cross-downs are valid for both shorts and longs
Signal Modifiers
X-Bar Rule: If signals occur within XX bars, then the signal is still valid
Bars Rising: This is for traditional signals only. This requires that an upward slop of ADX be present over XX bars
Other things to note
The GKD trading system requires that a GKD-V indicator be present in the indicator chain, but the GKD-V indicator doesn't need to be active. You can turn on/off the Volatility Ratio as you wish so you can backtest your trading strategy with the filter on or off.
Additional features will be added in future releases.
This indicator is only available to ALGX Trading VIP group members . You can see the Author's Instructions below to get more information on how to get access.
Strength Index I2-SIIdea:
Enhance the Stoch RSI with DMI to get the visualization of the strength movement.
Concept:
(Note that we take the close to get the closing price).
-Combination of 2 Stoch RSI (using value K): 1 is UP, 1 is DOWN (these settings have been customized).
-Every time they cross, it calculates the direction of 3 nearly previous crossings to get the color of the current line.
-The value has been re-calculated with the processed value from ADX and DI- (That's why it can be more than 100 or -100 in some cases).
-RSI Overbuy and oversell are removed because the value could be beyond it.
How it works:
1. The line is show as the strength index of bars
- Green means the up strength is strong.
- Red means the down strength is strong.
- Gray means the previous strength is getting week.
2. This one can be used to find divergence.
3. This indicator provides a warning signal when the color of the line changes:
- Change color:
+Turn red: "Down Red"
+Turn green: "Up Green"
+Turn gray: "Down Gray"/"Up Gray"
Suitable time frames:
15m, 4h, 1D, 1W
* Please note that this logic does not attempt to predict future prices or 100% accurate signal.
(INVITE ONLY indicator. Please direct message or visit website if you want to try it out)
Hope you guys enjoy!
Examples:
BTCUSD 1D
XAUUSD 4H
EURUSD 1H
SPX 15m

Ichimoku Cloud and ADX with Trailing Stop Loss (by Coinrule)The Ichimoku Cloud is a collection of technical indicators that show support and resistance levels, as well as momentum and trend direction. It does this by taking multiple averages and plotting them on a chart. It also uses these figures to compute a “cloud” that attempts to forecast where the price may find support or resistance in the future.
The Ichimoku Cloud was developed by Goichi Hosoda, a Japanese journalist, and published in the late 1960s. It provides more data points than the standard candlestick chart. While it seems complicated at first glance, those familiar with how to read the charts often find it easy to understand with well-defined trading signals.
The Ichimoku Cloud is composed of five lines or calculations, two of which comprise a cloud where the difference between the two lines is shaded in.
The lines include a nine-period average, a 26-period average, an average of those two averages, a 52-period average, and a lagging closing price line.
The cloud is a key part of the indicator. When the price is below the cloud, the trend is down. When the price is above the cloud, the trend is up.
The above trend signals are strengthened if the cloud is moving in the same direction as the price. For example, during an uptrend, the top of the cloud is moving up, or during a downtrend, the bottom of the cloud is moving down.
DMI is simple to interpret. When +DI > - DI, it means the price is trending up. On the other hand, when -DI > +DI, the trend is weak or moving on the downside. The ADX does not give an indication of the direction but about the strength of the trend.
Typically values of ADX above 25 mean that the trend is steeply moving up or down, based on the -DI and +DI positioning. This script aims to capture swings in the DMI, and thus, in the trend of the asset, using a contrarian approach.
Trading on high values of ADX, the strategy tries to spot extremely oversold and overbought conditions. Values of ADX above 45 may suggest that the trend has overextended and is maybe about to reverse.
This strategy combines the Ichimoku Cloud with the ADX indicator to better enter trades.
Long orders are placed when these basic signals are triggered.
Long Position:
Tenkan-Sen is above the Kijun-Sen
Chikou-Span is above the close of 26 bars ago
Close is above the Kumo Cloud
MACD line crosses over the signal line
-DI is greater than +DI
ADX is greater than 45
Close Position:
3% increase trailing
3% decrease trailing
The script is backtested from December 2022 and provides good returns.
A trading fee of 0.1% is also taken into account and is aligned to the base fee applied on Binance.

Cuban's Pair Trading IndexThe purpose of this indicator is to visually simplify the relationship between two assets when searching for pair trades or higher beta opportunities.
With highly correlated pairs, it can be a blessing or a curse during volatility when you're somehow stuck in the only lower beta pairs, or maybe you're market neutral and the wrong leg starts nuking.
This indicator was built as a visual way to track pair relationships.
Fundamentally, this script does the following:
Plots the relative performance of the relationship between two assets across multiple time horizons
Uses a consistent measurement of historical performance, regardless of asset -- currently standard deviations, may add log difference in the future
Plots a custom Average Directional Index on the current chart ticker for current asset contextual momentum
Plots the average 'rotation' of both the ADX and Pair Delta independently, over n numbers of rotations -- able to be specified using the 'Rotation Lookback' variable
If you've never pair traded crypto before (i.e. long $DYDX, short $ETH), you might not be aware that most highly correlated alt asset returns tend to oscillate on a low timeframe rolling basis around the performance of the majors -- and more recently, predominantly $ETH. With this in mind and using this oscillator, we can track that relationship.
Users are given the ability to adjust the following:
Comparison Asset
Fast and Slow Delta Lookbacks
Whether to wait for one bar delay during security calls
Rotation Lookback
Rotation Threshold for Pair Delta and ADX independently
ADX Lookback
Whether to utilize the ADX on the current chart ticker or also net that off against the ADX of the comparison asset
TO DO:
Aesthetic update to Pair Delta plot
Permanent fix for security call forced delay

RSI & ADX [APIDEVs]The RSI ( Relative Strength Index ) is an oscillator-type indicator used by traders who perform technical analysis to estimate the status of overbought or oversold of an asset on the stock market.
This tool gives the trader the advantage of comparing supply and demand (buying and selling), therefore, we must take into account the following interpretation for its use.
If the buy and sell index are equal, the indicator takes a percentage value of 50, which indicates that the relative forces are in equity.
As its value is over 50%, it indicates that the buyer interest is higher than the seller.
When it is less than 50%, then we must know that the selling force is greater.
It also indicates that when the RSI is above 70 on the oscillator, the price is oversold, therefore, it should exit the market.
Similarly, when the RSI is below 30, the asset is oversold, so it is considered convenient to buy.
NEW RSI & ADX
The main improvement lies in the incorporation of a script that allows to visually observe the force of the movement and that this reinforces the perception of the RSI trajectory. It is for this reason that we incorporate the Average Directional Index ( ADX ) in this indicator so that through its logic it can provide other visual elements to help traders.
In this merger we try to maintain the original design of the RSI in order to make a clean integration that does not confuse traders with another indicator.
Improvements made:
• The coloration resulting from the crossing of the DI + and DI- of the ADX was incorporated into the line that marks point 50 of this indicator.
o When the Di + is above the DI- the trend is bullish therefore the middle line of the RSI will be painted green.
o When the Di- is above the DI + the trend is bearish therefore the middle line of the RSI will be painted green.
• A green background was added for the uptrend and red for the downtrend, which is activated exclusively when the price acquires a strong trend. This highly important feature for the interpretation of this new version of the indicator was absorbed from the ADX.
• A function was added that allows showing the weakness of the RSI by changing its color from green to red as the case may be.
• Thinking of the more traditional users, a function was incorporated that allows painting the RSI in a single color.
• A color selector was incorporated that allows painting the candles based on ADX or RSI.
• Added a side panel that indicates the numerical value of the ADX and the RSI.
• As a visual improvement, an upper and lower band was created that more clearly shows the oversold and overbought state of the oscillator.
