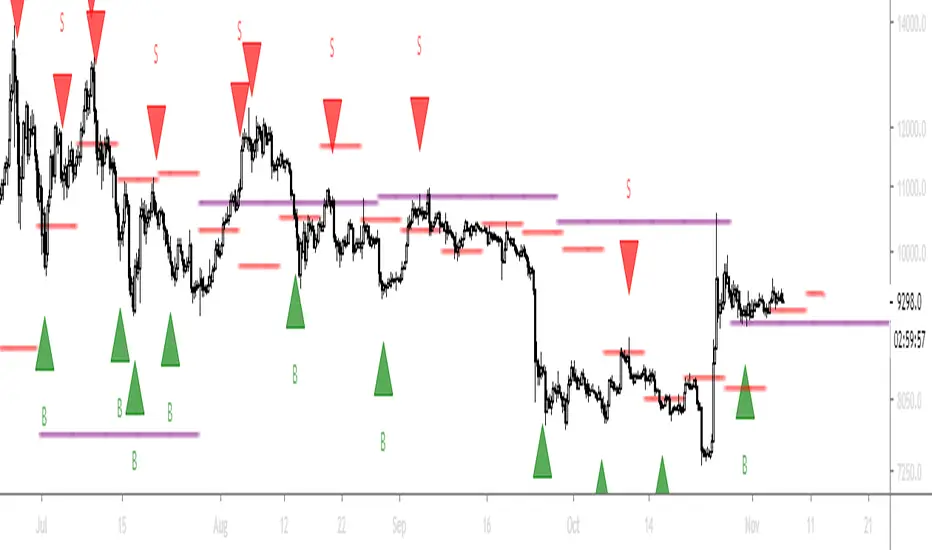
6Hours swingalgo by BiO-618Hey, I want to share you this algo I remade for a bullish market.
*It uses about 11 indicators, 3 of them made by me to avoid BUYs on the start of a big dump.
*It was added ghost pivots for weekly and monthly values, really useful!
Let me know any suggestion, I will keep working to improve it
Algotrading
[Bybit] Gainzy Intraday Momentum AlgoOverview
This algorithm uses a single unorthodox moving average that I created by modifying an obscure moving average.
It is meant to be used on intraday time frames.
Signals
Green column: buy signal
Red column: sell signal
Wait for a candle to close in order for the signal to be confirmed
Profit tracking
The background tracks the profitability of the algorithm over the last 5000 candles or so
Every time a new signal is confirmed it updates the net profit (minus the commission)
Net profit is shown as a percentage of your starting balance. For example, say your starting balance is $1.00. Your current balance is $1.50. Net profit will appear as 50%.
Percent commission is the fee charged for entering a position using a market order. It is set to 0.75% by default.
Specifications
Net profit is based on using the entire account balance and compounding gains
For example, your balance is $100. You receive a buy signal and go long for $100. Price goes up a little over 10% and you receive a sell signal. You close your long position. Your new balance is $110. You now open a short position for $110. You have compounded the gains of your previous long position into your new short position.
Backtesting
You can view the profitability of this algorithm by Day / Week / Month / Quarter / Year / All-Time
If you choose the monthly Interval, on the final day of the month, it will display the realized profit of this algorithm. Unrealized profit will not be included. For example, if you are up 50% on the month and in a trade that is currently up 10%, net profit for the month will be shown as 50%. The 10% of unrealized profit will be carried over into the first trade of the following month.

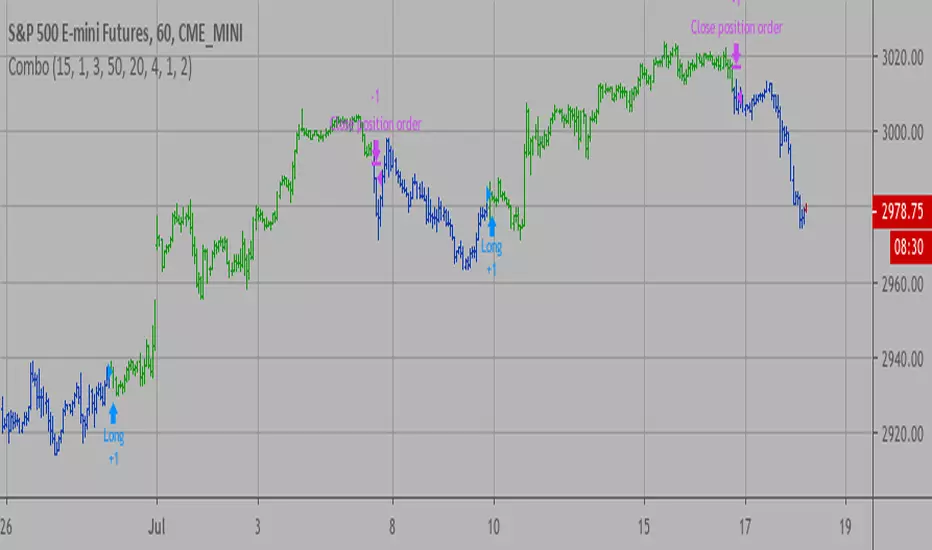
Combo Backtest 123 Reversal & Comparative Relative Strength This is combo strategies for get a cumulative signal.
First strategy
This System was created from the Book "How I Tripled My Money In The
Futures Market" by Ulf Jensen, Page 183. This is reverse type of strategies.
The strategy buys at market, if close price is higher than the previous close
during 2 days and the meaning of 9-days Stochastic Slow Oscillator is lower than 50.
The strategy sells at market, if close price is lower than the previous close price
during 2 days and the meaning of 9-days Stochastic Fast Oscillator is higher than 50.
Second strategy
Comparative Relative Strength Strategy for ES
WARNING:
- For purpose educate only
- This script to change bars colors.

Combo Backtest 123 Reversal & EMA & Volume WeightingThis is combo strategies for get a cumulative signal.
First strategy
This System was created from the Book "How I Tripled My Money In The
Futures Market" by Ulf Jensen, Page 183. This is reverse type of strategies.
The strategy buys at market, if close price is higher than the previous close
during 2 days and the meaning of 9-days Stochastic Slow Oscillator is lower than 50.
The strategy sells at market, if close price is lower than the previous close price
during 2 days and the meaning of 9-days Stochastic Fast Oscillator is higher than 50.
Second strategy
The related article is copyrighted material from Stocks & Commodities 2009 Oct
WARNING:
- For purpose educate only
- This script to change bars colors.

Combo Strategy 123 Reversal & EMA & Volume Weighting This is combo strategies for get a cumulative signal.
First strategy
This System was created from the Book "How I Tripled My Money In The
Futures Market" by Ulf Jensen, Page 183. This is reverse type of strategies.
The strategy buys at market, if close price is higher than the previous close
during 2 days and the meaning of 9-days Stochastic Slow Oscillator is lower than 50.
The strategy sells at market, if close price is lower than the previous close price
during 2 days and the meaning of 9-days Stochastic Fast Oscillator is higher than 50.
Second strategy
The related article is copyrighted material from Stocks & Commodities 2009 Oct
WARNING:
- For purpose educate only
- This script to change bars colors.

Combo Backtest 123 Reversal & DMI & Moving Average This is combo strategies for get a cumulative signal.
First strategy
This System was created from the Book "How I Tripled My Money In The
Futures Market" by Ulf Jensen, Page 183. This is reverse type of strategies.
The strategy buys at market, if close price is higher than the previous close
during 2 days and the meaning of 9-days Stochastic Slow Oscillator is lower than 50.
The strategy sells at market, if close price is lower than the previous close price
during 2 days and the meaning of 9-days Stochastic Fast Oscillator is higher than 50.
Second strategy
The related article is copyrighted material from Stocks & Commodities Aug 2009
WARNING:
- For purpose educate only
- This script to change bars colors.
Kase Dev Stops Backtest The Kase Dev Stops system finds the optimal statistical balance between letting profits run,
while cutting losses. Kase DevStop seeks an ideal stop level by accounting for volatility (risk),
the variance in volatility (the change in volatility from bar to bar), and volatility skew
(the propensity for volatility to occasionally spike incorrectly).
Kase Dev Stops are set at points at which there is an increasing probability of reversal against
the trend being statistically significant based on the log normal shape of the range curve.
Setting stops will help you take as much risk as necessary to stay in a good position, but not more.
WARNING:
- For purpose educate only
- This script to change bars colors.

Combo Backtest 123 Reversal & CMOfilt This is combo strategies for get a cumulative signal.
First strategy
This System was created from the Book "How I Tripled My Money In The
Futures Market" by Ulf Jensen, Page 183. This is reverse type of strategies.
The strategy buys at market, if close price is higher than the previous close
during 2 days and the meaning of 9-days Stochastic Slow Oscillator is lower than 50.
The strategy sells at market, if close price is lower than the previous close price
during 2 days and the meaning of 9-days Stochastic Fast Oscillator is higher than 50.
Second strategy
This indicator plots a CMO which ignores price changes which are less
than a threshold value. CMO was developed by Tushar Chande. A scientist,
an inventor, and a respected trading system developer, Mr. Chande developed
the CMO to capture what he calls "pure momentum". For more definitive
information on the CMO and other indicators we recommend the book The New
Technical Trader by Tushar Chande and Stanley Kroll.
The CMO is closely related to, yet unique from, other momentum oriented
indicators such as Relative Strength Index, Stochastic, Rate-of-Change, etc.
It is most closely related to Welles Wilder`s RSI, yet it differs in several ways:
- It uses data for both up days and down days in the numerator, thereby directly
measuring momentum;
- The calculations are applied on unsmoothed data. Therefore, short-term extreme
movements in price are not hidden. Once calculated, smoothing can be applied to the
CMO, if desired;
- The scale is bounded between +100 and -100, thereby allowing you to clearly see
changes in net momentum using the 0 level. The bounded scale also allows you to
conveniently compare values across different securities.
WARNING:
- For purpose educate only
- This script to change bars colors.

Combo Backtest 123 Reversal & CMOav This is combo strategies for get a cumulative signal.
First strategy
This System was created from the Book "How I Tripled My Money In The
Futures Market" by Ulf Jensen, Page 183. This is reverse type of strategies.
The strategy buys at market, if close price is higher than the previous close
during 2 days and the meaning of 9-days Stochastic Slow Oscillator is lower than 50.
The strategy sells at market, if close price is lower than the previous close price
during 2 days and the meaning of 9-days Stochastic Fast Oscillator is higher than 50.
Second strategy
This indicator plots average of three different length CMO's. This indicator
was developed by Tushar Chande. A scientist, an inventor, and a respected
trading system developer, Mr. Chande developed the CMO to capture what he
calls "pure momentum". For more definitive information on the CMO and other
indicators we recommend the book The New Technical Trader by Tushar Chande
and Stanley Kroll.
The CMO is closely related to, yet unique from, other momentum oriented
indicators such as Relative Strength Index, Stochastic, Rate-of-Change, etc.
It is most closely related to Welles Wilder?s RSI, yet it differs in several ways:
- It uses data for both up days and down days in the numerator, thereby directly
measuring momentum;
- The calculations are applied on unsmoothed data. Therefore, short-term extreme
movements in price are not hidden. Once calculated, smoothing can be applied to
the CMO, if desired;
- The scale is bounded between +100 and -100, thereby allowing you to clearly see
changes in net momentum using the 0 level. The bounded scale also allows you to
conveniently compare values across different securities.
WARNING:
- For purpose educate only
- This script to change bars colors.
Combo Backtest 123 Reversal & CMOabsThis is combo strategies for get a cumulative signal.
First strategy
This System was created from the Book "How I Tripled My Money In The
Futures Market" by Ulf Jensen, Page 183. This is reverse type of strategies.
The strategy buys at market, if close price is higher than the previous close
during 2 days and the meaning of 9-days Stochastic Slow Oscillator is lower than 50.
The strategy sells at market, if close price is lower than the previous close price
during 2 days and the meaning of 9-days Stochastic Fast Oscillator is higher than 50.
Second strategy
This indicator plots the absolute value of CMO. CMO was developed by Tushar
Chande. A scientist, an inventor, and a respected trading system developer,
Mr. Chande developed the CMO to capture what he calls "pure momentum". For
more definitive information on the CMO and other indicators we recommend the
book The New Technical Trader by Tushar Chande and Stanley Kroll.
The CMO is closely related to, yet unique from, other momentum oriented indicators
such as Relative Strength Index, Stochastic, Rate-of-Change, etc. It is most closely
related to Welles Wilder`s RSI, yet it differs in several ways:
- It uses data for both up days and down days in the numerator, thereby directly
measuring momentum;
- The calculations are applied on unsmoothed data. Therefore, short-term extreme
movements in price are not hidden. Once calculated, smoothing can be applied to
the CMO, if desired;
- The scale is bounded between +100 and -100, thereby allowing you to clearly see
changes in net momentum using the 0 level. The bounded scale also allows you to
conveniently compare values across different securities.
WARNING:
- For purpose educate only
- This script to change bars colors.

SkyBot - BTC and XBTUSD Trading Bot for CryptoThe SkyBot is written to provide a good balance between long-term trading and short-term for more action. It has been running for over a year before it was decided to share with the public.
SkyBot uses moving price action data from multiple time frames to determine when to go long or short. It also provides the user with the ability to use stop loss and take profit values to match whatever risk management rules you use in your trading.
SkyBot has simple to use alerts making it simple to use with many auto-trading offers.
SkyBot has been coded in the latest version of Pine (v4) and will be updated as new features, functionality, and support is released with Pine.
To get access to SkyBot, please signup here: cryptoscriptking.com
This is the indicator script that is intended to be used to get alerts for the purposes of automation. The strategy script is also included allowing you to do your own backtesting.

DAKELAX-XRPUSDT Bollinger Band Strategy for TradebotlerDAKELAX-XRPUSDT is a Tradebotler strategy designed to run on XRPUSDT for binance, it's a simple reverse to mean strategy and when backtested on may-aug 2019 on H1 timeframe it performs pretty well in backtest as well as running live.
In order to get started install the Tradebotler extension and connect the strategy with Binance or other crypto exchanges of your choice such as Kraken, Bitstamp, Bitmex, Bittrex, Polyneux etc, etc.

Combo Backtest 123 Reversal & CMO & WMA This is combo strategies for get a cumulative signal.
First strategy
This System was created from the Book "How I Tripled My Money In The
Futures Market" by Ulf Jensen, Page 183. This is reverse type of strategies.
The strategy buys at market, if close price is higher than the previous close
during 2 days and the meaning of 9-days Stochastic Slow Oscillator is lower than 50.
The strategy sells at market, if close price is lower than the previous close price
during 2 days and the meaning of 9-days Stochastic Fast Oscillator is higher than 50.
Second strategy
This indicator plots Chande Momentum Oscillator and its WMA on the
same chart. This indicator plots the absolute value of CMO.
The CMO is closely related to, yet unique from, other momentum oriented
indicators such as Relative Strength Index, Stochastic, Rate-of-Change,
etc. It is most closely related to Welles Wilder?s RSI, yet it differs
in several ways:
- It uses data for both up days and down days in the numerator, thereby
directly measuring momentum;
- The calculations are applied on unsmoothed data. Therefore, short-term
extreme movements in price are not hidden. Once calculated, smoothing
can be applied to the CMO, if desired;
- The scale is bounded between +100 and -100, thereby allowing you to clearly
see changes in net momentum using the 0 level. The bounded scale also allows
you to conveniently compare values across different securities.
WARNING:
- For purpose educate only
- This script to change bars colors.

Kairos [Signals]Kairos bot looks for the opportune time to buy low and sell high at targets
It provides signals to open and close trades, and indicates favorable positions for a stop loss and profit taking
The Kairos bot can be used on any chart and on any time frame
---BACKTESTER---
Using the backtester script the user can look at a chart's history between selected dates to find optimal bot settings and optimal time frames
The backtester is based on general percentages for profit taking as indicated below:
-------------T1 T2 T3 T4 T5 T6 CLOSE
1 Target: 50% 50%
2 Targets: 50% 25% 25%
3 Targets: 40% 30% 20% 10%
4 Targets: 40% 25% 20% 10% 5%
5 Targets: 35% 25% 20% 10% 5% 5%
6 Targets: 30% 25% 20% 10% 5% 5% 5%
ie: If 2 targets are selected:
- 50% of investment will be taken at target 1
- 25% of investment will be taken at target 2
- and the remainder 25% will be taken when the trade is closed on a close signal
However, it is up to the user's own risk appetite to determine where and how much profit to take
Note that the backtester does not have any on screen indicators other than OPEN and CLOSE, however profit taking can be indicated by ticking the Style -> Trades on Chart tick box on the settings userform
---SIGNALS---
The signals script can be used for automation and can indicate up to 6 potential Profit Targets, as well as a Stop Loss based on how many bars back needs to be taken into consideration
The signals (Open/Close) can be automated using TradingView alerts, however the Stop Loss and Profit Taking are only indicators and are for the users own interpretation
The user does not have to place a Stop Loss or take profit at the Targets if so wished, the bot can be used to simply buy on an OPEN signal and sell on a CLOSE signal, however, the backtester will indicate that it is far more profitable to take profits.
It is advised to take profits just below indicated Targets as these are potentially high selling zones and price action can sometimes turn down just short of these targets.
---INVITE-ONLY SCRIPT---
This is an invite-only script, so if you would like to try out Kairos Bot, send me a message

Kairos [Backtester]Kairos bot looks for the opportune time to buy low and sell high at targets
It provides signals to open and close trades, and indicates favorable positions for a stop loss and profit taking
The Kairos bot can be used on any chart and on any time frame
---BACKTESTER---
Using the backtester script the user can look at a chart's history between selected dates to find optimal bot settings and optimal time frames
The backtester is based on general percentages for profit taking as indicated below:
-------------T1 T2 T3 T4 T5 T6 CLOSE
1 Target: 50% 50%
2 Targets: 50% 25% 25%
3 Targets: 40% 30% 20% 10%
4 Targets: 40% 25% 20% 10% 5%
5 Targets: 35% 25% 20% 10% 5% 5%
6 Targets: 30% 25% 20% 10% 5% 5% 5%
ie: If 2 targets are selected:
- 50% of investment will be taken at target 1
- 25% of investment will be taken at target 2
- and the remainder 25% will be taken when the trade is closed on a close signal
However, it is up to the user's own risk appetite to determine where and how much profit to take
Note that the backtester does not have any on screen indicators other than OPEN and CLOSE, however profit taking can be indicated by ticking the Style -> Trades on Chart tick box on the settings userform
---SIGNALS---
The signals script can be used for automation and can indicate up to 6 potential Profit Targets, as well as a Stop Loss based on how many bars back needs to be taken into consideration
The signals (Open/Close) can be automated using TradingView alerts, however the Stop Loss and Profit Taking are only indicators and are for the users own interpretation
The user does not have to place a Stop Loss or take profit at the Targets if so wished, the bot can be used to simply buy on an OPEN signal and sell on a CLOSE signal, however, the backtester will indicate that it is far more profitable to take profits.
It is advised to take profits just below indicated Targets as these are potentially high selling zones and price action can sometimes turn down just short of these targets.
---INVITE-ONLY SCRIPT---
This is an invite-only script, so if you would like to try out Kairos Bot, send me a message

Combo Backtest 123 Reversal & Chande Forecast Oscillator This is combo strategies for get a cumulative signal.
First strategy
This System was created from the Book "How I Tripled My Money In The
Futures Market" by Ulf Jensen, Page 183. This is reverse type of strategies.
The strategy buys at market, if close price is higher than the previous close
during 2 days and the meaning of 9-days Stochastic Slow Oscillator is lower than 50.
The strategy sells at market, if close price is lower than the previous close price
during 2 days and the meaning of 9-days Stochastic Fast Oscillator is higher than 50.
Second strategy
The Chande Forecast Oscillator developed by Tushar Chande The Forecast
Oscillator plots the percentage difference between the closing price and
the n-period linear regression forecasted price. The oscillator is above
zero when the forecast price is greater than the closing price and less
than zero if it is below.
WARNING:
- For purpose educate only
- This script to change bars colors.
Algorithm Builder (Signal version)Gentlemen traders
As promised, here's the Algorithm Builder (Signal Version) that is an alternative version of that previous indicator : Strategy-Builder-Crypto-Single-Trend-Plots/
This one was quite successful and already 11 person bought for me which is unbelievable. Thank you so much guys for your appreciation of my work
The script of this present post is still invite-only because it required years in the making (it's the fruit of all my errors and trials while trading for the past 7 years and when developing trading bots for traders professionally)
What's the Algorithm Builder?
Simply put, the indicator will detect the confluence/convergence of multiple unrelated indicators and alert you when the ones YOU selected will be in the same direction. (if you didn't understand this it's because I'm french)
For example, let's say you select a MM cross and MACD, whenever the MM cross will be green/bullish AND MACD green/bullish also, you'll get a nice .... wait for it..... green/bullish /diamond. Starting to see what I meant before now :)
Not sure if I should go as far as introducing the other example but let's go for it. Still, in the same spirit, a confluence of red/bearish MM cross and red/bearish MACD will give .... (finish the sentence and you'll get my appreciation. hint: the color of the diamond will be red)
So what's cool about it now ... or I should say even cooler... even more awesome (Barney Stinson, please hive five me for this tool...) is that it can be plugged in a single click to a complete Backtest engine
I inspired myself greatly from the Pinescripters Backtesting-Trading-Engine-PineCoders/ but had to make changes to adapt it to my tool.
It took me a few days of work and I'll share it also tomorrow so please stay tuned and give me a follow so that you'll be updated
In the Backtester itself, I added some features like :
- Stop-loss based on supertrend
- Hard Exit based on indicators used by the Algorithm Builder
I just made it more relevant for my indicator
Performance sir?
The period selected for the screenshot below is the last 3 months
Here's a preview of what you should expect tomorrow as well imgur.com
There isn't a BEST configuration for the tool. I made one that matches my psychology and capital. You'll have to find yours by playing with it or asking me for a bit of help if you're lost
Will require a bit of work but could be very worth it in the end :)
What's next sir?
I'm perfectly aware that the indicator doesn't give a lot of signals and that's because it's an entry-level version of all the Algorithm Builders I'm selling now and will be available on my website by end of August (along with the website itself)
More advanced versions already made allow to :
- get more entries
that one is the best addition, in my opinion, it multiplies the gains (and losses :P) as it allows some orders pyramiding and to reinforce a position if the trend is very strong. You won't have to do anything, just to wait for the alerts by email/sms from TradingView
- multiple take profit levels
- connected to systems like Autoview/ProfitView to automatize even more your trading and send those signals to your broker directly (I will strongly advise starting with a demo account for 1 week or 2 here, I don't want you to burn your capital if any unexpected bad event will happen)
- screener
If you're interested please message me. I can develop your custom indicator/strategy/backtest/automatic system or if you're ready the take the leap of faith and try this indicator or the more advanced versions
And before I get asked, yes this is the tool I use for my own trading as initially, I made it for me. Now sharing a bit of my work (and too much of my life) with the community
PS
____________________________________________________________
Feel free to hit the thumbs up as it shows me that I'm not doing this for nothing and will motivate to deliver more quality content in the future.
- I'm an officially approved PineEditor/LUA/MT4 approved mentor on codementor. You can request a coaching with me if you want and I'll teach you how to build kick-ass indicators and strategies
Jump on a 1 to 1 coaching with me
- You can also hire for a custom dev of your indicator/strategy/bot/chrome extension/python
- if you like my work and wants to buy me some coffee :
- BTC TipJar: 3MKDve7stWTe1io99oFxeQXvP8XB4zCQ8m
- LTC TipJar: MC5oeBAhw9BLqyi65TR3J1Lid8io9uHADw

Combo Backtest 123 Reversal & Chaikin Volatility This is combo strategies for get a cumulative signal.
First strategy
This System was created from the Book "How I Tripled My Money In The
Futures Market" by Ulf Jensen, Page 183. This is reverse type of strategies.
The strategy buys at market, if close price is higher than the previous close
during 2 days and the meaning of 9-days Stochastic Slow Oscillator is lower than 50.
The strategy sells at market, if close price is lower than the previous close price
during 2 days and the meaning of 9-days Stochastic Fast Oscillator is higher than 50.
Second strategy
Chaikin's Volatility indicator compares the spread between a security's
high and low prices. It quantifies volatility as a widening of the range
between the high and the low price.
You can use in the xPrice1 and xPrice2 any series: Open, High, Low, Close, HL2,
HLC3, OHLC4 and ect...
WARNING:
- For purpose educate only
- This script to change bars colors.

Strategy Builder Crypto (Single Trend/Plots)Hi everyone
Big program for the daily indicator
This one will be free on trial only for a week because it has an immense value and required quite a lot of work. For more info to use it long-term, please DM me
That out of the way, let's dive right in...
This is a huge upgrade from that script Ultimate-Algorithm-Builder-Single-Trend
The Tradingview non-pro users will appreciate it because it allows to add the selected subsequent indicators as well. The Pro users too will likely like this feature equally, what the H*** I'm saying :)
This indicator will transform you into what I was in the past... into a quant trader. You'll build your own trading algorithm in a few clicks only
Which timeframe and which assets ?
Short answer : ALL and ALL
You'll have to define the configuration of the tool based on your capital, psychology. For custom configuration of the tool, please DM me directly so that we can discuss further
But a few words of advices anyway :
the bigger the timeframe, the lower the inputs (and vice-versa)
Think about how much $$ you want to make per trade and define your entries from there
Think about how much $$ you can afford to lose per trade and define the supertrend from there
...
Your golden configuration might not work for all assets.
You might have to create some tweaks - for instance you found a great config for BTCUSD but it's not working for ETHUSD, then you can create a copy of your BTCUSD chart and set a new config for ETHUSD
What are the indicators inside :
This fantastic tool that I personally use for my trading detects convergence between the following indicators :
Overlay - meaning if the price close above/below a moving average
Trend Signal - to detect if the the DOW law is broken and predict a possible reversal - en.wikipedia.org/wiki/Dow_theory
In other words, it detects if the higher highs or lower lows sequence is broken
MACD or MACD Zero Lag
MA Cross - Cross of moving averages
Ichimoku - if the price closes below/above the cloud
Supertrend - used to detect polarity zones
TSI Shadow -
Pullback
You'll also have the possibility to define a pullback on a given MA. That means basically that you'll get a convergence and it will only display a signal when it will pullback first
This will reduce your losses in case of invalidation and maximize your gains as it will enter the trade in a better position.
You can define your pullback either based an absolute value or based on a percent distance from the MA
+Example:
Pullback value = 100 means I want a 100 pip/USD distance between the MA pullback and the candle
Pullback percent = 2 means I want a 2% distance between the MA pullback and the candle
The percent option is more generic in my opinion but I let the other available for those who might like it
That's it ?
Almost....You can also setup alerts on the indicator signals so that you won't have to stay days in front of the chart to wait for a signal.
You receive the alert, you check real quick if we're not in front of a support/resistance, if no then take the trade. if yes, I advice waiting for a big pullback - better to be safe than sorry in trading
What If you want a custom version ?
Here are a few custom ideas I could add just for you :
re-enter everytime there is a convergence. So far the indicator is only taking the first convergence. This would give more entries
add the resistances/supports (fibo, pivot)
add the take profit targets and trailing stop loss
..
Please hit me up directly so we can discuss further. Any custom dev will require quite some time so it won't be free
Enjoy that one as I really think it will improve your analyst skills and trading and hopefully make you a few gains (which will make me very happy as I want to help most of you to at least not losing your capital)
Dave

Combo Backtest 123 Reversal & Center Of Gravity This is combo strategies for get a cumulative signal.
First strategy
This System was created from the Book "How I Tripled My Money In The
Futures Market" by Ulf Jensen, Page 183. This is reverse type of strategies.
The strategy buys at market, if close price is higher than the previous close
during 2 days and the meaning of 9-days Stochastic Slow Oscillator is lower than 50.
The strategy sells at market, if close price is lower than the previous close price
during 2 days and the meaning of 9-days Stochastic Fast Oscillator is higher than 50.
Second strategy
The indicator is based on moving averages. On the basis of these, the
"center" of the price is calculated, and price channels are also constructed,
which act as corridors for the asset quotations.
WARNING:
- For purpose educate only
- This script to change bars colors.
Combo Strategy 123 Reversal & CCI This is combo strategies for get a cumulative signal.
First strategy
This System was created from the Book "How I Tripled My Money In The
Futures Market" by Ulf Jensen, Page 183. This is reverse type of strategies.
The strategy buys at market, if close price is higher than the previous close
during 2 days and the meaning of 9-days Stochastic Slow Oscillator is lower than 50.
The strategy sells at market, if close price is lower than the previous close price
during 2 days and the meaning of 9-days Stochastic Fast Oscillator is higher than 50.
Second strategy
The Commodity Channel Index (CCI) is best used with markets that display cyclical or
seasonal characteristics, and is formulated to detect the beginning and ending of these
cycles by incorporating a moving average together with a divisor that reflects both possible
and actual trading ranges. The final index measures the deviation from normal, which indicates
major changes in market trend.
To put it simply, the Commodity Channel Index (CCI) value shows how the instrument is trading
relative to its mean (average) price. When the CCI value is high, it means that the prices are
high compared to the average price; when the CCI value is down, it means that the prices are low
compared to the average price. The CCI value usually does not fall outside the -300 to 300 range
and, in fact, is usually in the -100 to 100 range.
WARNING:
- For purpose educate only
- This script to change bars colors.

Combo Backtest 123 Reversal & Bull Power This is combo strategies for get a cumulative signal.
First strategy
This System was created from the Book "How I Tripled My Money In The
Futures Market" by Ulf Jensen, Page 183. This is reverse type of strategies.
The strategy buys at market, if close price is higher than the previous close
during 2 days and the meaning of 9-days Stochastic Slow Oscillator is lower than 50.
The strategy sells at market, if close price is lower than the previous close price
during 2 days and the meaning of 9-days Stochastic Fast Oscillator is higher than 50.
Second strategy
Bull Power Indicator
To get more information please see "Bull And Bear Balance Indicator"
by Vadim Gimelfarb.
WARNING:
- For purpose educate only
- This script to change bars colors.

Combo Backtest 123 Reversal & Breakout Range Short This is combo strategies for get a cumulative signal.
First strategy
This System was created from the Book "How I Tripled My Money In The
Futures Market" by Ulf Jensen, Page 183. This is reverse type of strategies.
The strategy buys at market, if close price is higher than the previous close
during 2 days and the meaning of 9-days Stochastic Slow Oscillator is lower than 50.
The strategy sells at market, if close price is lower than the previous close price
during 2 days and the meaning of 9-days Stochastic Fast Oscillator is higher than 50.
Second strategy
Breakout Range Short Strategy
WARNING:
- For purpose educate only
- This script to change bars colors.
