Refracted EMARefracted EMA is a price based indicator with bands that is built on moving average.
The price range between the bands directly depends on relationship of Average True Range to Moving Average. This gives us very valuable variable constant that changes with the market moves.
So the bands expand and contract due to changes in volatility of the market, which makes this tool very flexible exposing psychological levels.
Algotrading

Level 1 - Learn to code simply - PineScriptThe goal of this script is honestly to help everyone learn about trading with bots and algos.
At least, to get started.
Level 1:
10 lines of code.
learn to plot 2 moving averages on your chart.
learn to create a signal from a crossover.
learn the very basics of Pine Script algo.

[Fedra Algotrading LR + TTP Indicator Lite]How it works?
- It calculates the linear regression of the last X candles and define a range based on a linear regression deviation (represented by the 3 parallel lines over the last candle).
-Open trades based on the breakout of the deviation of the linear regression (represented by the yellow triangle).
-Advanced trend filter to not open trades against the trend consist in 2 SMA cross and and a few other conditions, including sptionally super trend (Represented by the red and green background).
-Percentage take profit (represented by the horizontal green line. configurable)
-Percentage stop loss (represented by the horizontal red line. Configurable
-Break even when a trade has already opened and there is a change of trend. Calculated in 1.5% when the price is under the yellow SMA.
Alerts in each case to receive notifications (BUY & SELL, TP BE SL).
Added labels with entry price and PnL of each closed trade to facilitate optimization

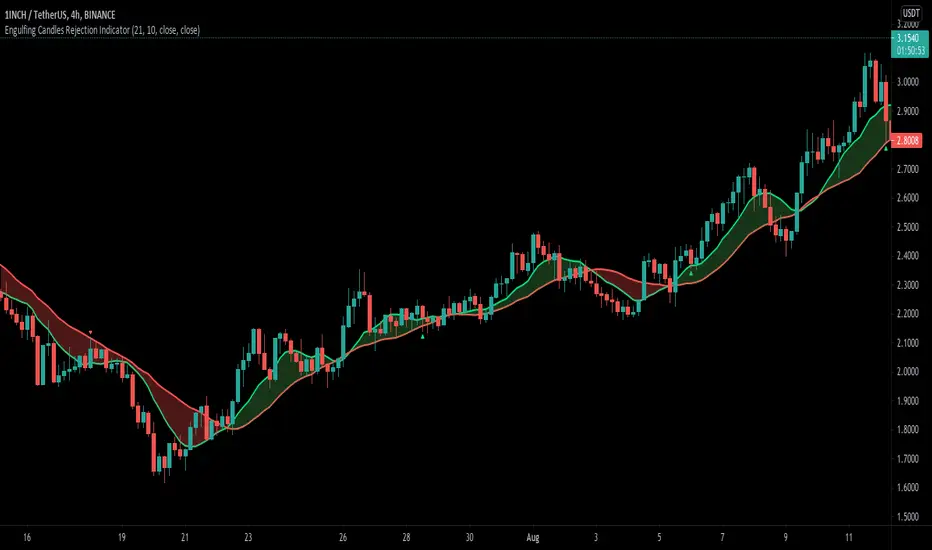
Engulfing Candle Rejection IndicatorThis indicator allows you to filter noisy chart, with engulfing candles which have been rejected from current trend lines. Trend lines by default are 21 MA (fast) and 10 MA (slow one). If fast moving average is greater than slower one, automatically indicator would represent that like uptrend, and if opposite then like a downtrend.
Consider to work only on higher time frames like 1H and higher, so you really can find only best entries.
Have fun, best wishes!
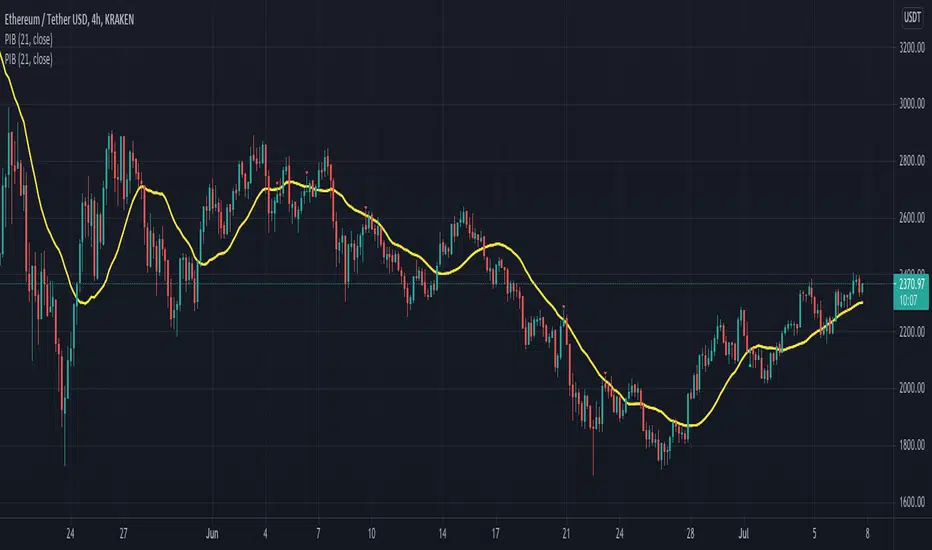
Pinbar-Rejection-IndicatorThis indicator allows you to filter noisy pin bar chart, with pin bars which have been rejected from dynamic support/resistance level also named as 21 Moving Average.
I would consider to work only on higher time frames like 1H and higher, so you really can find only best entries.
Have fun, write your feedback in the comments section:)
P.S This is the first version of the indicator, so be free to contribute, and soon I'm going to improve this indicator.
Grid Bot AutoThis script is an auto-adjusting grid bot simulator. This is an improved version of the original Grid Bot Simulator. The grid bot is best used for ranging/choppy markets. Prices are divided into grids, or trade zones, that will trigger signals each time a new zone is entered. During ranging markets, each transaction is followed by a “take profit.” As the market starts to trend, transactions are stacked (compare to DCA ), until the market consolidates. No signals are triggered above the Upper Limit or Below the Lower Limit. Unlike the previous version, the upper and lower limits are calculated automatically. Grid levels are determined by four factors: Smoothing, Laziness, Elasticity, and Grid Intervals.
Smoothing:
A moving average (or linear regression) is applied to each close price as a basis. Options for smoothing are Linear Regression, Simple Moving Average, Exponential Moving Average, Volume-Weighted Moving Average, Triple-Exponential Moving Average.
Laziness:
Laziness is the percentage change required to reach the next level. If laziness is 1.5, the price must move up or down by 1.5% before the grid will change. This concept is based on Alex Grover’s Efficient Trend Step. This allows the grids to be based on even price levels, as opposed to jagged moving averages.
Elasticity:
Elasticity is the degree of “stickiness” to the current price trend. If the smoothing line remains above (or below) the current grid center without reverting but still not enough to reach the next grid level, the grid line will start to curve toward the next grid level. Elasticity is added to (or subtracted from) the gridline by a factor of minimum system ticks for the current pair. Elasticity of zero will keep the gridlines horizontal. If elasticity is too high, the grid will distort.
Grid Intervals:
Grid intervals are the percentage of space between each grid.
Laziness = 4%, Elasticity = 0. Price must move at least 4% before reaching the next level. With zero elasticity, gridlines are straight.
Laziness = 5%, Elasticity = 100. For each bar at a new grid level, the grid will start “curve” toward the next price level (up if price is greater than the middle grid, down if less than middle grid). Elasticity is calculated by the user-inputted “Elasticity” multiplied by the minimum tick for the current pair (ELSTX = syminfo.mintick * iELSTX)
Try experimenting with different combinations of the Smoothing Length, Smoothing Type, Laziness, Elasticity, and Grid Intervals to find the optimum settings for each chart. Lower-priced pairs (e.g. XRP/ADA/DODGE) will require lower Elasticity. Also note that different exchanges may have different minimum tick values. For example, minimum tick for BITMEX:XBTUSD and BYBIT:BTCUSD is .5, but BINANCE:BTCUSDT and COINBASE:BTCUSD is .01.
s3.tradingview.com
DODGEUSDT, 5min. Laziness: 4%, Elasticity 2.5
Number of Grids: 2. Laziness: 3.75%. Elasticity: 150. Grid Interval 2%.
Settings Overview
Smoothing Length : Smoothing period
Smoothing Type : Linear Regression, Simple Moving Average, Exponential Moving Average, Volume-Weighted Moving Average, Triple-Exponential Moving Average
Laziness : Percentage required for price to move until it reaches the next level. If price does not reach the next level (up or down), the grid will remain the same as previous grid (because it’s lazy).
Elasticity : Amount of curvature toward the next grid, based on the current price trend. As elasticity increases, gridlines will curve up or down by a factor of the number of ticks since the last grid change.
Grid Interval : Percent between grid levels.
Number of Grids : Number of grids to show.
Cooldown : Number of bars to wait to prevent consecutive signals.
Grid Line Transparency : Lower transparencies brighten the gridlines; higher transparencies dim the gridlines. To hide the gridlines completely, enter 100.
Fill Transparency: Lower transparencies brighten the fill box; higher transparencies dim the fill box. To hide the fill box completely, enter 100.
Signal Size : Make signal triangles large or small.
Reset Buy/Sell Index When Grids Change : When a new grid is formed, resetting the index may prevent false signals (experimental)
Use Highs/Lows for Signals : If enabled, signals are triggered as soon as the price touches the next zone. If disabled, signals are triggered after bar closes. Enable this for “Once Per Bar alerts. Disable for “Once Per Bar Close” alerts.
Show Min Tick : If checked, syminfo.mintick is displayed in upper-righthand corner. Useful for estimating Laziness.
Reverse Fill Colors : Default fill for fill boxes is green after buy and red after sell. Check this box to reverse.
Note: The Grid Bot Simulator scripts are experimental and works in progress. Please feel free to comment or contact me if you have suggestions/complaints.

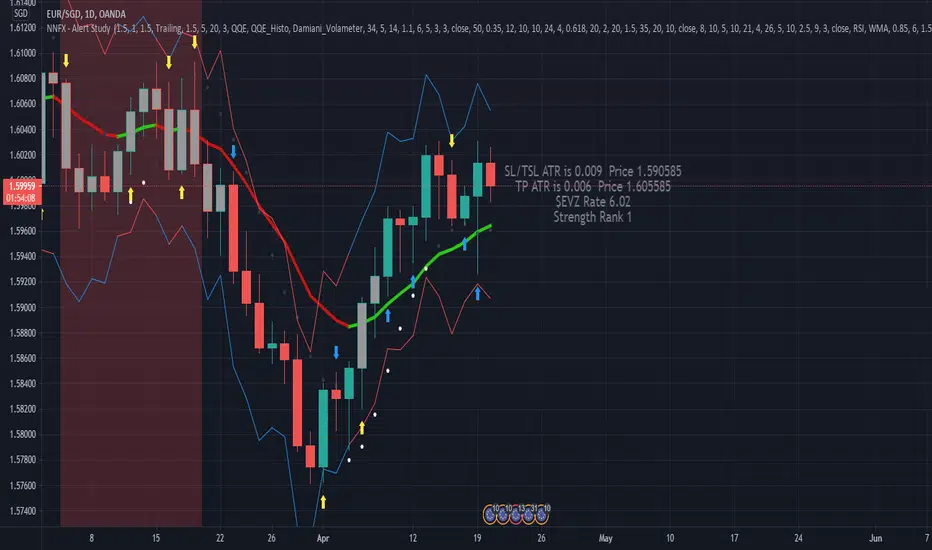
NNFX, Baseline, QQEs Fast C1, Slow C2, ATR, Volume and ExitDesigned Around the NNFX rules
Selectible Baseine
Selectible Exit Indicators
ATR bands, ATR labels for TP and TSL (1x and 1.5x ATR).
Indication (White Diamond) where candle is over 1x ATR in size.
Combined QQE Fast & Slow (C1 & C2) confirmations, Candles Grey before Trend Confirmed, change to Normal Colour when Trend established (QQE MOD used for calcualtions).
Continuations signaled by white dot above/below candle (0.9x ATR from Close Signal).
Exit Long and Exit Short signaled by Red and Blue Arrow under/above candle.
(JS) Multi-Time Frame Pivot Point Detector 2.0So here's an updated version of my automatic Pivot Point detector.
If you don't like having a bunch of Pivots on your chart at once, or having to cycle through various resolutions to see different ones, this is for you!
What does this indicator do? It automatically detects the nearest daily, weekly, and monthly pivot points both above and below the current price and automatically plots them for you. It's really just as simple as that.
You select how far back you want it to plot with the "Pivot Point Look Back Period" option.
I also have transparency options for each type of pivot so its easy to find the opacity you prefer and save it as a default setting.
With "Turn Off Each Pivot Point On All Time Frames" turned on, as an example, if you were to uncheck "S1/R1" then it turns S1/R1 plots off across all 3 pivot resolutions. By default however, I have it set where you can pick and choose each one individually.
I also added the default "VWAP Periodic" script from TradingView in there with it (not in prior version). This works identical to the built in indicator (because it is identical).
Trading algorithms like to target pivot points and liquidity, so I figured they would pair together nicely for active trading.

Ichimoku Clouds Strong Bullish/Bearish signals and alertsIchimoku Clouds Strong Bullish/Bearish signals with allerts
The Ichimoku cloud was developed by Goichi Hosoda, a Japanese journalist, and published in the late 1960s. It provides more data points than the standard candlestick chart. While it seems complicated at first glance, those familiar with how to read the charts often find it easy to understand with well-defined trading signals.
We provide you easy-to-use script which helps to decrypt meaning of lines in the indicator. The script takes Ichimoku clouds indicator formulas to calculate Tenkan, Kijun, SenkouA, SenkouB values and examines them in order to produce buy ( Bullish ) and sell ( Bearish ) signals which are displayed at the chart
The most appropriate time frame is 30m
Custom alerts are added to send you a notice with a webhook when bullish or bearish signal arrives.
You can easily add weak and neutral signals alerts by removing "//" in a specified place
Feel free to copy and use this script for your ideas and trading. You can modify the script by adding Parabolic SAR in order to increase accuracy of positions closure

BEST Supertrend MAHello traders,
That one is an experiment
I was curious to see what a supertrend based on moving average cross could give
How does it work?
Bull event: fast moving average crossing over the slow moving average
Bear event: fast moving average crossing under the slow moving average
When the event is triggered, the script will plot the Supertrend as follow
UP Trend = ohlc4+ ATR * Factor
DOWN Trend = ohlc4- ATR * Factor
Interesting to see the results given by ohlc4 vs hl2 and hl3
Documentation: www.tradingview.com
This is an alternative of the classical Supertrend based on candle close being above/beyond the previous Supertrend level.
Hope you'll enjoy it and it will improve your trading making you a better trader
Dave

Combo Strategy 123 Reversal & DAPD This is combo strategies for get a cumulative signal.
First strategy
This System was created from the Book "How I Tripled My Money In The
Futures Market" by Ulf Jensen, Page 183. This is reverse type of strategies.
The strategy buys at market, if close price is higher than the previous close
during 2 days and the meaning of 9-days Stochastic Slow Oscillator is lower than 50.
The strategy sells at market, if close price is lower than the previous close price
during 2 days and the meaning of 9-days Stochastic Fast Oscillator is higher than 50.
Second strategy
This indicator is similar to Bollinger Bands. It based on DAPD - Daily
Average Price Delta. DAPD is based upon a summation for each of the
highs (hod) for the 21 days prior to today minus the summation for
each of the lows (lod) for the last 21 days prior to today. The result
of this calculation would then be divided by 21.
It will be buy when high above previos DAPD high and sell if low below previos DAPD low
WARNING:
- For purpose educate only
- This script to change bars colors.

Combo Strategy 123 Reversal & EMA & Volume Weighting This is combo strategies for get a cumulative signal.
First strategy
This System was created from the Book "How I Tripled My Money In The
Futures Market" by Ulf Jensen, Page 183. This is reverse type of strategies.
The strategy buys at market, if close price is higher than the previous close
during 2 days and the meaning of 9-days Stochastic Slow Oscillator is lower than 50.
The strategy sells at market, if close price is lower than the previous close price
during 2 days and the meaning of 9-days Stochastic Fast Oscillator is higher than 50.
Second strategy
The related article is copyrighted material from Stocks & Commodities 2009 Oct
WARNING:
- For purpose educate only
- This script to change bars colors.

BACKTEST SCRIPT 0.999 ALPHATRADINGVIEW BACKTEST SCRIPT by Lionshare (c) 2015
THS IS A REAL ALTERNATIVE FOR LONG AWAITED TV NATIVE BACKTEST ENGINE.
READY FOR USE JUST RIGHT NOW.
For user provided trading strategy, executes the trades on pricedata history and continues to make it over live datafeed.
Calculates and (plots on premise) the next performance statistics:
profit - i.e. gross profit/loss.
profit_max - maximum value of gross profit/loss.
profit_per_trade - each trade's profit/loss.
profit_per_stop_trade - profit/loss per "stop order" trade.
profit_stop - gross profit/loss caused by stop orders.
profit_stop_p - percentage of "stop orders" profit/loss in gross profit/loss.
security_if_bought_back - size of security portfolio if bought back.
trades_count_conseq_profit - consecutive gain from profitable series.
trades_count_conseq_profit_max - maxmimum gain from consecutive profitable series achieved.
trades_count_conseq_loss - same as for profit, but for loss.
trades_count_conseq_loss_max - same as for profit, but for loss.
trades_count_conseq_won - number of trades, that were won consecutively.
trades_count_conseq_won_max - maximum number of trades, won consecutively.
trades_count_conseq_lost - same as for won trades, but for lost.
trades_count_conseq_lost_max - same as for won trades, but for lost.
drawdown - difference between local equity highs and lows.
profit_factor - profit-t-loss ratio.
profit_factor_r - profit(without biggest winning trade)-to-loss ratio.
recovery_factor - equity-to-drawdown ratio.
expected_value - median gain value of all wins and loss.
zscore - shows how much your seriality of consecutive wins/loss diverges from the one of normal distributed process. valued in sigmas. zscore of +3 or -3 sigmas means nonrandom realitonship of wins series-to-loss series.
confidence_limit - the limit of confidence in zscore result. values under 0.95 are considered inconclusive.
sharpe - sharpe ratio - shows the level of strategy stability. basically it is how the profit/loss is deviated around the expected value.
sortino - the same as sharpe, but is calculated over the negative gains.
k - Kelly criterion value, means the percentage of your portfolio, you can trade the scripted strategy for optimal risk management.
k_margin - Kelly criterion recalculated to be meant as optimal margin value.
DISCLAIMER :
The SCRIPT is in ALPHA stage. So there could be some hidden bugs.
Though the basic functionality seems to work fine.
Initial documentation is not detailed. There could be english grammar mistakes also.
NOW Working hard on optimizing the script. Seems, some heavier strategies (especially those using the multiple SECURITY functions) call TV processing power limitation errors.
Docs are here:
docs.google.com
