Gann Seasonal Dates - CEGann Seasonal Dates - Community Edition
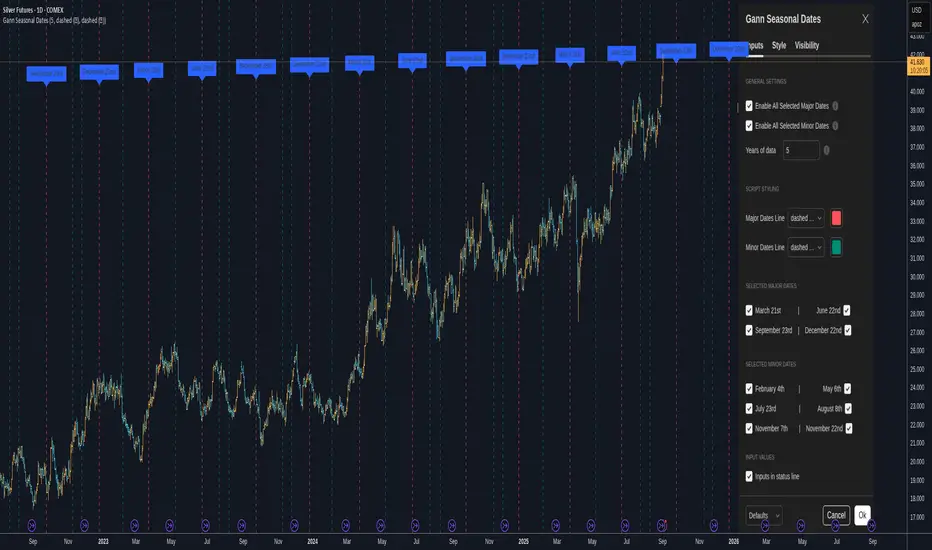
Welcome to the Gann Seasonal Dates V1.61 - Community Edition, a powerful tool designed to enhance time-based trading with W.D. Gann’s seasonal date methodology. This feature-complete indicator allows traders to plot critical seasonal dates on charts for equities, forex, commodities, and cryptocurrencies. It empowers traders to anticipate market turning points with precision.
Overview
The Gann Seasonal Dates plots Gann’s major and minor seasonal dates, which are rooted in the cyclical nature of solstices, equinoxes, and their midpoints. Major dates include the vernal equinox (March 21st), summer solstice (June 22nd), autumnal equinox (September 23rd), and winter solstice (December 22nd). Minor dates mark the halfway points between these events (February 4th, May 6th, July 23rd, August 8th, November 7th, and November 22nd). With customizable styling and historical data up to 50 years, this script helps traders identify key time-based market events.
Key Features
Major and Minor Seasonal Dates : Plot four major dates (solstices and equinoxes) and six minor dates (midpoints) to highlight potential market turning points.
Customizable Date Selection : Enable or disable individual major and minor dates to focus on specific cycles relevant to your analysis.
Historical Data Range : Adjust the lookback period up to 50 years, with recommendations for optimal performance based on your TradingView plan (5 years for Basic, 20 for Pro/Pro+/Premium).
Styling Options : Customize line styles (solid, dotted, dashed) and colors for major and minor dates to enhance chart clarity.
Labeled Visuals : Each plotted date includes a label with a tooltip (e.g., "Vernal equinox") for easy identification and context.
How It Works
Configure Settings : Enable major and/or minor dates and select specific dates (e.g., March 21st, February 4th) to display on your chart.
Set Historical Range : Adjust the years of data (up to 50) to plot historical seasonal dates, ensuring compatibility with your TradingView plan’s processing limits.
Customize Styling : Choose line styles and colors for major and minor dates to differentiate them visually.
Analyze and Trade : Use the plotted vertical lines and labels to identify potential market turning points, integrating Gann’s time-based cycles into your strategy.
Get Started
As a gift to the TradingView community and Gann traders, the Gann Seasonal Dates - Community Edition is provided free of charge. With no features locked, this tool offers full access to Gann’s seasonal date methodology for precise time-based analysis. Trade wisely and leverage the power of seasonal cycles!
Astrology
Astro ToolBox - CEAstro ToolBox - Community Edition
Welcome to the Astro ToolBox - Community Edition, a meticulously designed tool that brings precise planetary ephemeris data to the TradingView community. Inspired by W.D. Gann’s astrological principles, this feature-complete indicator empowers traders to integrate celestial data into their market analysis across equities, forex, commodities, and cryptocurrencies.
Overview
The Astro ToolBox - Community Edition delivers accurate ephemeris data, calculating the ecliptic longitude and latitude of celestial bodies for any selected date. Supporting the Sun, Moon, Mercury, Venus, Mars, Jupiter, Saturn, Uranus, Neptune, and Pluto, this script offers both heliocentric and geocentric perspectives with high precision (within 1-2 arc seconds), it provides traders with a robust dataset for time-based analysis, enhancing Gann-inspired trading strategies.
Key Features
Comprehensive Planetary Data : Displays longitude and optional latitude for ten celestial bodies (Sun, Moon, Mercury, Venus, Mars, Jupiter, Saturn, Uranus, Neptune, Pluto) on user-specified dates.
Heliocentric and Geocentric Modes : Toggle between heliocentric and geocentric calculations (Pluto is heliocentric-only; Moon is geocentric-only).
Zodiac Sign Integration : Optionally display the astrological sign and degree for the selected planet’s longitude, enhancing astrological analysis.
Customizable Display Options : Enable/disable exact time display, longitude rounding, and latitude visibility for tailored data presentation.
Flexible Table Positioning : Choose from nine screen positions (e.g., Top Right, Bottom Center) to place the ephemeris table, with customizable colors for seamless chart integration.
High-Precision Calculations : Utilizes optimized algorithms to deliver near-real-time planetary positions without relying on external APIs.
How It Works
Select a Date : Choose the date for which you want to view planetary data using the input field.
Choose a Planet : Select from the Sun, Moon, Mercury, Venus, Mars, Jupiter, Saturn, Uranus, Neptune, or Pluto.
Set Planetary Mode : Toggle between heliocentric or geocentric modes to align with your analysis approach.
Customize Output : Enable options like zodiac signs, sign degrees, latitude, or exact time, and adjust the table’s position and color.
View Results : The ephemeris data appears in a clear, customizable table on your chart, providing longitude, latitude (optional), and astrological sign details.
Analyze and Trade : Leverage the data to identify time-based turning points or correlations with price action, integrating Gann’s astrological principles into your strategy.
Get Started
As a gift to the TradingView community and Gann traders, the Astro ToolBox - Community Edition is offered free of charge. With no features locked, this tool provides full access to precise ephemeris data for astrological market analysis. Trade wisely and harness the power of celestial insights!

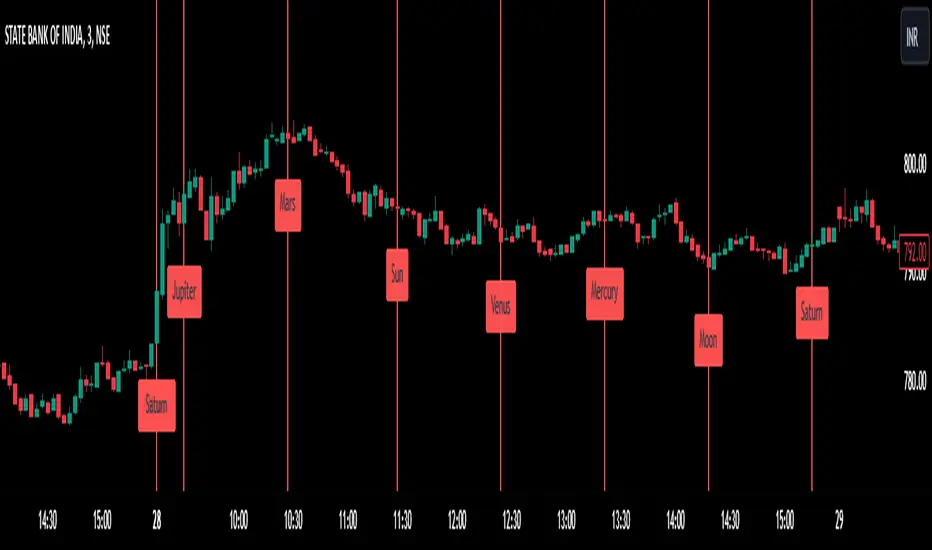
Planetary Time Intervals [Javonnii]🪐 Planetary Time Intervals Indicator 🪐
This innovative planetary time-based market timing indicator enables traders to analyze and project planetary degree intervals directly onto any chart with exceptional accuracy. Built on a custom planetary framework, it calculates planetary positions down to the arc-second across all timeframes, accommodating up to 500 future bars. This capability allows for both clean intraday analysis and long-term market timing.
The framework operates autonomously and requires no external data or updates. It reliably computes planetary positions across centuries and supports seamless analysis across all markets—whether 24/7 assets like crypto or session-based instruments like stocks—with smooth, gap-free planetary data on any ticker or timeframe. Perfect for time-based market studies on deep historical datasets such as the Dow Jones.
🔶 FEATURES
Key planetary timing tools include:
- Standard Degree Interval Plotting (Fixed Increments)
- Price-to-Planetary Degree Conversions (360 Units Reduction & 1/10 Price Method) for Direct Price-to-Time Harmonics
- Geocentric & Heliocentric Models (Including Moon for Lunar Cycles)
- Absolute Degree Handling for Retrogrades
- Visual Projections: Background Highlights, Vertical Lines, and Degree Labels
- Math Display for Calculation Transparency
- Scaling Adjustments for Volatile Assets (e.g., Crypto, Indices)
- Multi-Timeframe Support Up to 500 Bars
- Alert Conditions for Interval Projections
- Customizable Interval Logic and Styling
- + More (Check changelog for updates)
🔶 BASIC DEMONSTRATION
On a daily stock chart, select a key low as your reference point (datetime and price). Choose a 30° interval for Mercury, and the indicator projects vertical lines forward at each degree milestone, with shaded backgrounds indicating potential cycle zones. Labels display traversed degrees, highlighting alignments in real-time.
For the 360 Conversion, input a price like $5,000—it reduces to 320° via modular arithmetic (5000 mod 360 = 320°), converting the price directly into a planetary time interval that may sync with numerological patterns or past turns.
🔶 USAGE & EXAMPLES
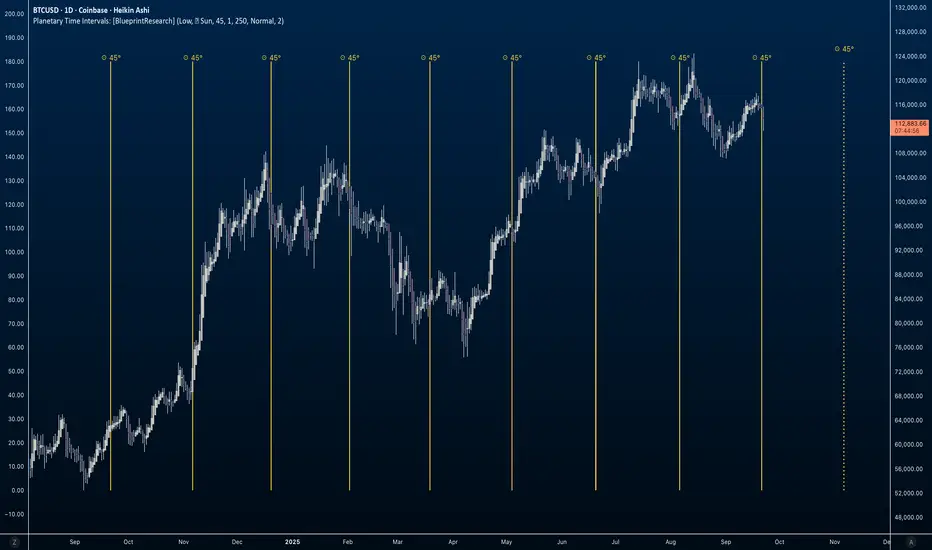
In the image below, the indicator is applied to a long-term weekly BTCUSD chart from 2015 to 2026. Selecting a historical low point (price = 198.02) as the reference, the 360 Conversion method derives the interval directly from the price. Since 198.02 is already under 360, the interval is simply 198.02° (no further reduction needed). Vertical yellow lines project these Sun-based intervals forward, aligning with a few key market turns, bull runs, and corrections. The math is displayed in the label "198.02° Low = 198.02° 360 Conversion 198.02°", illustrating the price-to-planetary time conversion process. Numerology enthusiasts might reduce 198.02° further (1+9+8+0+2=20, then 2+0=2) for symbolic insights into market balance or duality.
Supported planets: Sun, Moon, Mercury, Venus, Mars, Jupiter, Saturn, Uranus, Neptune, Pluto.
🔶 SETTINGS
- Timing Method: Select Standard Interval, 360 Conversion, or 1/10 Price.
- Planetary View: Geocentric/Heliocentric; Toggle Moon Inclusion.
- Interval Setup: Enter degrees (e.g., 45°); Enable Absolute for Retrogrades.
- Base Reference: Input datetime and price from high/low.
- Visuals: Toggle highlights, lines, math labels; Set colors/styles.
- Scaling: Adjust for asset ranges (e.g., multipliers for high or low prices).
- Limits: Bar count (up to 500)
- Styling: Label formats, projection options.
🔶 CONCLUSION
Planetary and numerological timing offers a unique lens on market rhythms, blending celestial mechanics with number-based insights for deeper analysis. This indicator is an original creation providing precise, flexible tools to explore these concepts, with a strong focus on converting price data into actionable planetary time intervals. As with all trading, past patterns aren't guarantees—pair with sound risk management and your overall approach.
🔶 HOW TO GET ACCESS
This public invite-only script is for planetary traders, market analysts, numerology enthusiasts, and anyone interested in harmonic degree-based timing. Reach out to the author for access details to this indicator and related resources.
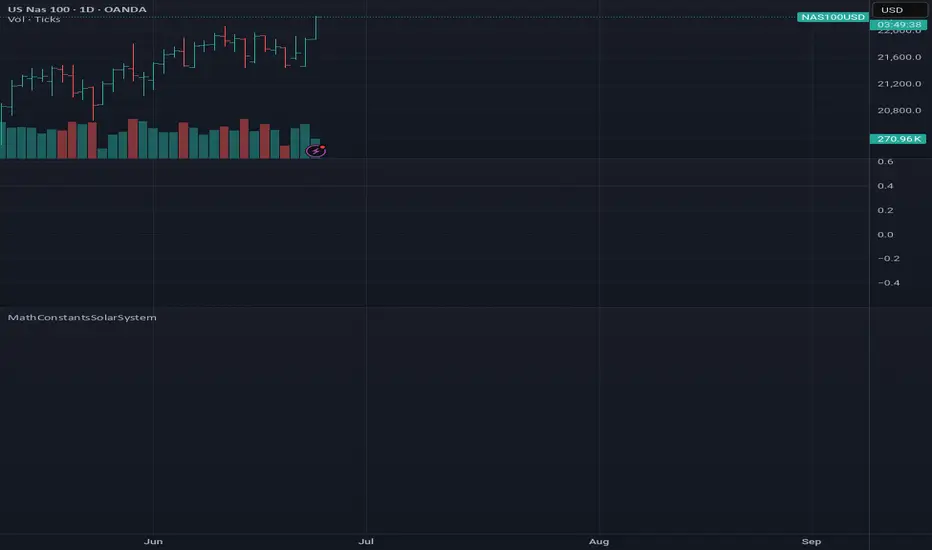
MathConstantsSolarSystemLibrary "MathConstantsSolarSystem"
Properties and data for the celestial objects in the Solar System.
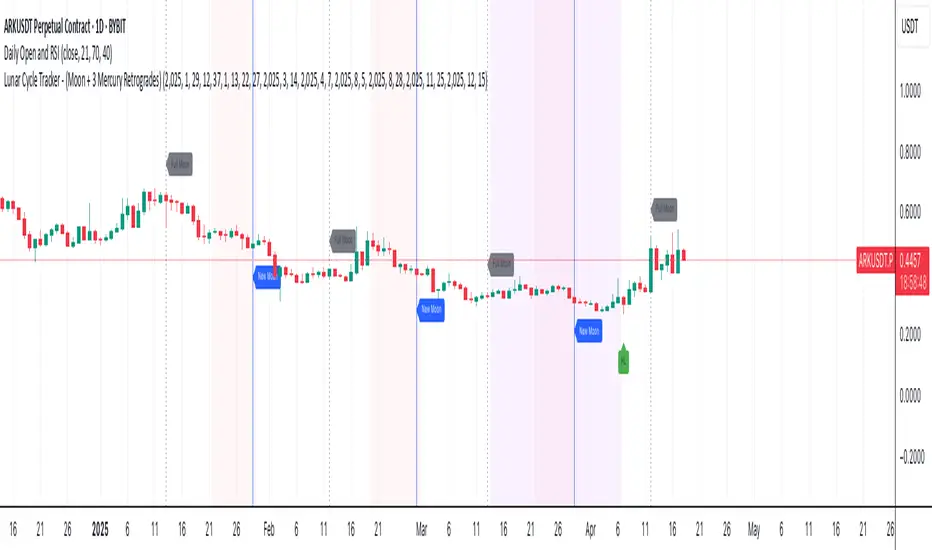
Lunar Cycle Tracker - (Moon + 3 Mercury Retrogrades)This script overlays the lunar and Mercury retrograde cycles directly onto your chart, helping traders visualize natural timing intervals that may influence market behavior.
Key Features:
🌑 New Moon & Full Moon Markers:
Vertical lines and labels indicate new and full moon events each month. You can fully customize their colors.
🌗 Last Quarter Moon Fill:
A soft pink background highlights the last quarter moon phase (from 7.4 days after the full moon to the next new moon).
🪐 Three Mercury Retrograde Zones:
Highlight up to three retrograde periods per year with customizable date inputs and background color. Great for spotting potential reversal or volatility windows.
Customization:
Moon event dates and colors
Manual input for Mercury retrograde periods (year, month, day)
Full compatibility with all timeframes (1H, 4H, daily, etc.)
Great for astro-cycle traders, Gann-based analysts, or anyone who respects time symmetry in the markets.
Fully customizable & works across all timeframes.
This tool was created by AngelArt as part of a larger astro-market model using lunar timing and planetary retrogrades for cycle-based market analysis.
[ABCOL] Hora PlotterHora Plotter. Input sunrise time & sunset time form Panchang. Select the corresponding first planet for the starting period from Panchang.
Solar System in 3D [Astro Tool w/ Zodiac]Hello Traders and Developers,
I am excited to announce my latest Open Source indicator. At the core, this is a demonstration of PineScript’s capabilities in Rendering 3D Animations, while at the same time being a practical tool for Financial Astrologists.
This 3D Engine dynamically renders all the major celestial bodies with their individual orbits, rotation speeds, polar inclinations and astrological aspects, all while maintaining accurate spatial relationships and perspective.
This is a Geocentric model of the solar system (viewed from the perspective of Earth), since that is what most Astrologists use. Thanks to the AstroLib Library created by @BarefootJoey, this model uses the real coordinates of cosmic bodies for every timestamp.
This script truly comes to life when using the “Bar Replay” mode in TradingView, as you can observe the relationships between planets and price action as time progresses, with the full animation capabilities as mentioned above.
In addition to what I have described, this indicator also displays the orbital trajectories for each cosmic body, and has labels for everything. I have also added the ability to hover on all the labels, and see a short description of what they imply in Astrology.
Optional Planetary Aspect Computation
This indicator supports all the Major Planetary Aspects, with an accuracy defined by the user (1° by default).
Conjunction: 0° Alignment. This draws a RED line starting from the center, and going through both planets.
Sextile: 60° Alignment. This draws three YELLOW lines, connecting the planets to each other and to the center.
Square: 90° Alignment. This draws three BLUE lines, connecting the planets to each other and to the center.
Trine: 120° Alignment. This draws three PURPLE lines, connecting the planets to each other and to the center.
Opposition: 180° Alignment. This draws a GREEN line starting from one planet, passing through the center and ending on the second planet.
The below image depicts a Top-Down view of the system, with the Moon in Opposition to Venus and with Mars in Square with Neptune .
Retrograde Computation
This indicator also displays when a planet enters Retrograde (Apparent Backward Motion) by making its orbital trajectory dashed and the planet name getting a red background.
The image below displays an example of Jupiter, Saturn, Neptune and Pluto in Retrograde Motion, from the camera perspective of a 65 degree inclination.
Optional Zodiac Computation (Tropical and Sidereal)
Zodiac represents the relatively stationary star formations that rest along the ecliptic plane, with planets transitioning from one to the next, each with a 30° separation (making 12 in total). I have implemented the option to switch between Tropical mode (where these stars were 2,000 years ago) and Sidereal (where these stars are today).
The image below displays the Zodiac labels with clear lines denoting where each planet falls into.
While this indicator is deployed in a separate pane, it is trivial to transfer it onto your price chart, just by clicking and dragging the graphics. After that, you can adjust the visuals by dragging the scale on the side, or optimizing model settings. You can also drag the model above or below the price, as shown in the following image:
Of course, there are a lot of options to customize this planetary model to your tastes and analytical needs. Aside from visual changes for the labels, colors or resolution you can also disable certain planets that don’t meet your needs as shown below:
Once can also infer the current lunar phases using the Aspects between the Sun and Moon. When the Moon is Opposite the Sun that is a Full Moon, while when they are Conjunct that is a New Moon (and sometimes Eclipse).
—---------------------------------------------------------------------------
I have made this indicator open source to help PineScript programmers understand how to approach 3D graphics rendering, enabling them to develop ever more capable scripts and continuously push the boundaries of what's possible on TradingView.
The code is well documented with comments and has a clear naming convention for functions and variables, to aid developers understand how everything operates.
For financial astrologists, this indicator offers a new way to visualize and correlate planetary movements, adding depth and ease to astrological market analysis.
Regards,
Hawk

Astro: Celestial Body Channel LinesThis is fork of the previous Astro: Planetary Channel Lines indicator that now includes over a dozen different celestial bodies, made possible after the most recent update of the AstroLib library.
Celestial Body Channel Lines is an approach to financial astrology that involves using the positions of the celestial bodies to predict trends and patterns in the stock market. The idea behind celestial body lines is that the positions of the bodies in the sky at the time of a market event can significantly influence that event.
The celestial body lines approach involves mapping the bodies' positions onto a stock market graph, with each body's position representing a specific line. These lines are thought to indicate areas of support and resistance, as well as potential turning points in the market.
This indicator includes geocentric/heliocentric celestial body lines on the chart for up to two bodies, price scaling & vertical offset, mirror/inversion switch, retrograde highlighting, and aspect recognition with customizable precision.

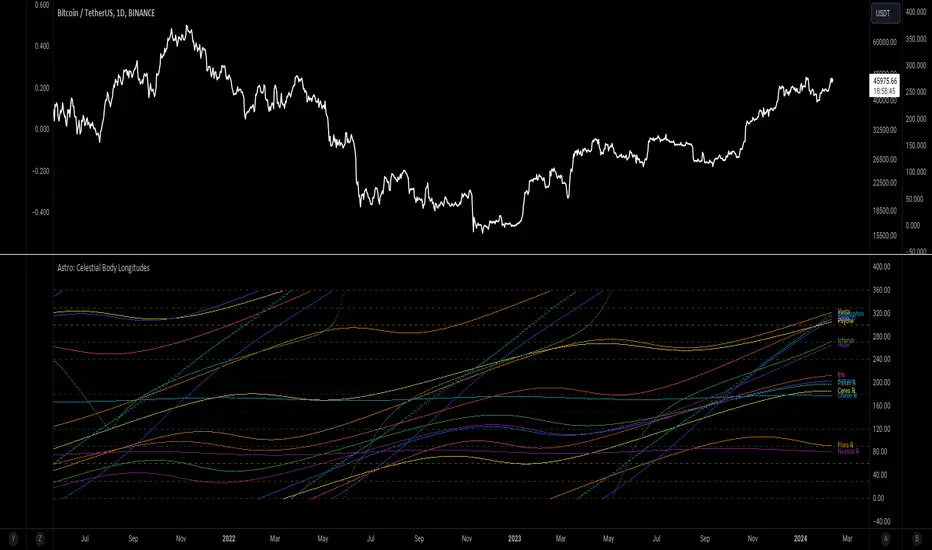
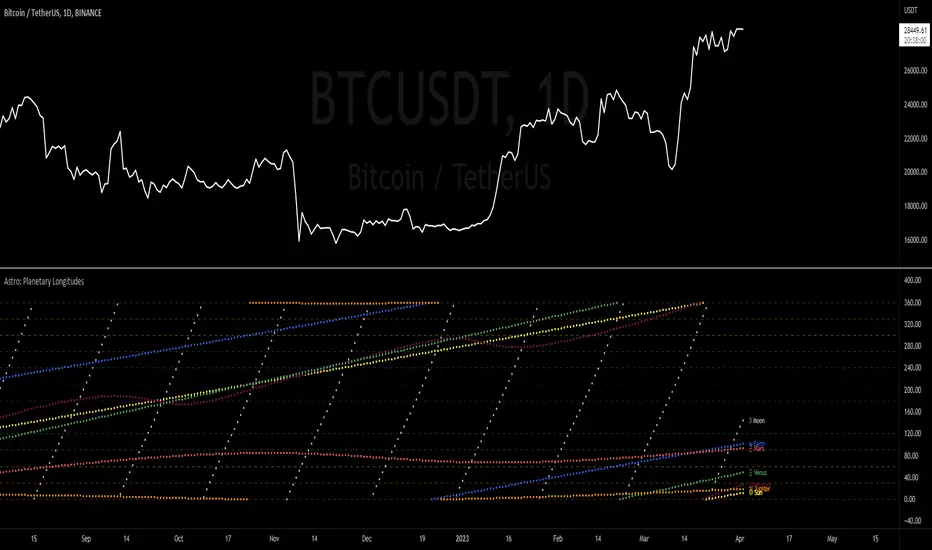
Astro: Celestial Body LongitudesThis is fork of the previous Astro: Planetary Longitudes indicator that now includes over a dozen different celestial bodies, made possible after the most recent update of the AstroLib library .
Celestial longitude is a measurement of the position of a celestial body in its orbit around the Sun, expressed in degrees of arc along the plane of the body's orbit. It is one of the fundamental coordinates used in astronomy to describe the position of a planet or other celestial object.
The concept of longitude is important in astrology, where it is used to determine the position of the planets in the zodiac. In this context, the longitude is measured along the ecliptic, which is the apparent path of the Sun on the celestial sphere. Astrologers use the position of the planets in the zodiac to make predictions and interpretations about personality traits, life events, earthquakes, market events, and other aspects of human experience.
This indicator includes geocentric/heliocentric longitude lines with retrograde identification, Vedic Nakshatras, and astrological zodiac & aspects for each of the celestial bodies. Hover over labels for additional information.
Astro: Planetary Aspects v2.0I have updated the excellent script originally written by @BarefootJoey with additional functionality as listed below the script's original description:
@BarefootJoey:
In astrology, planetary aspects refer to the angles formed between two or more planets in a horoscope or birth chart. These angles are created by the positions of the planets in the sky and are thought to represent a particular energy or influence that can impact events on Earth.
The most common planetary aspects are the conjunction (when two planets are in the same position in the zodiac), the opposition (when two planets are direct across from each other in the zodiac), the trine (when two planets are 120 degrees apart in the zodiac), and the square (when two planets are 90 degrees apart in the zodiac).
This oscillator plots the current geocentric/heliocentric aspect for up to two planets and features a customizable precision of degree (up to +/- 15 degrees) for each aspect.
Additional functionality added in by @Yevolution:
1. Overlay the indicator plot on top of the main chart, with the indicator's scale placed on the left - I found it easier to spot price reactions at a given planetary aspect vs seeing the plot in a separate frame
2. Add options to plot a vertical bar for every occurrence of chosen aspects
The script source code has remained open and additional comments have been added by me to explain the changes where relevant.
When I get some more spare time I will add a function to enable future planetary aspect events to also be displayed on the chart to make forecasting using this data easier.

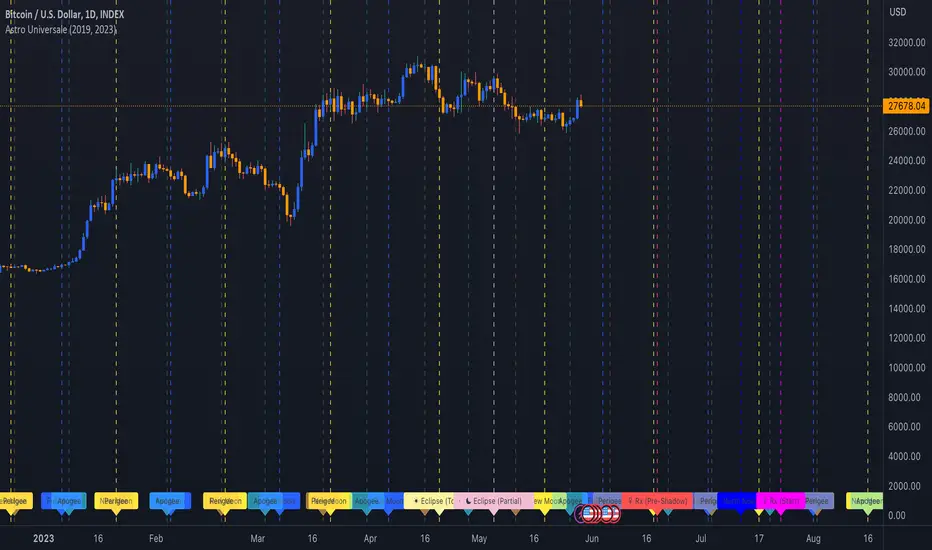
Astro UniversaleSolar Eclipses (Annular, Partial, Total), Lunar Eclipses (Penumbral, Partial, Total), Venus (including shadow periods), Moon Phases, Apogees, Perigees, and the North Node from 2013 to 2024... The dates might vary by one day depending on your location because of differences in time zones.
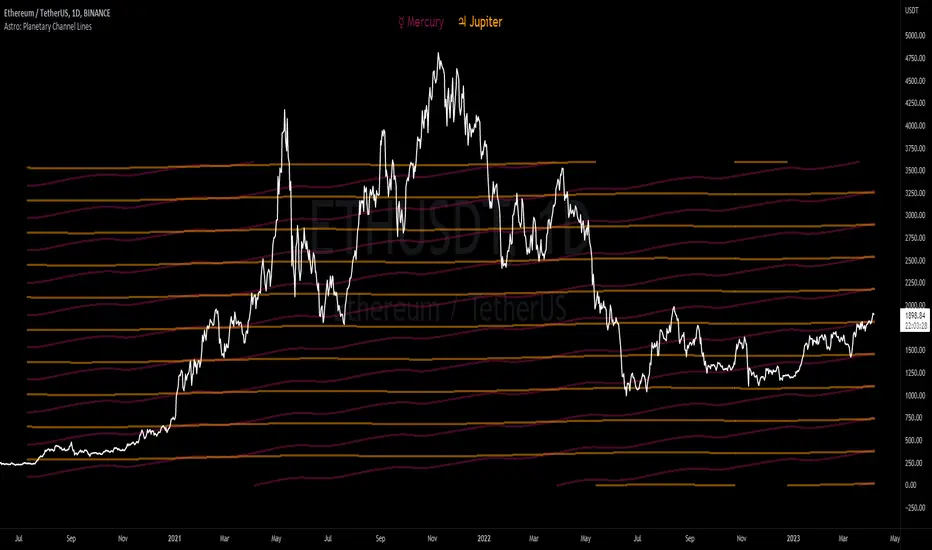
Astro: Planetary Channel LinesPlanetary Channel Lines is an approach to financial astrology that involves using the positions of the planets to predict trends and patterns in the stock market. The idea behind planetary lines is that the positions of the planets in the sky at the time of a market event can significantly influence that event.
The planetary lines approach involves mapping the planets' positions onto a stock market graph, with each planet's position representing a specific line. These lines are thought to indicate areas of support and resistance, as well as potential turning points in the market.
This indicator includes geocentric/heliocentric planetary lines on the chart for up to two planets, price scaling & vertical offset, retrograde highlighting, and aspect recognition with customizable precision.
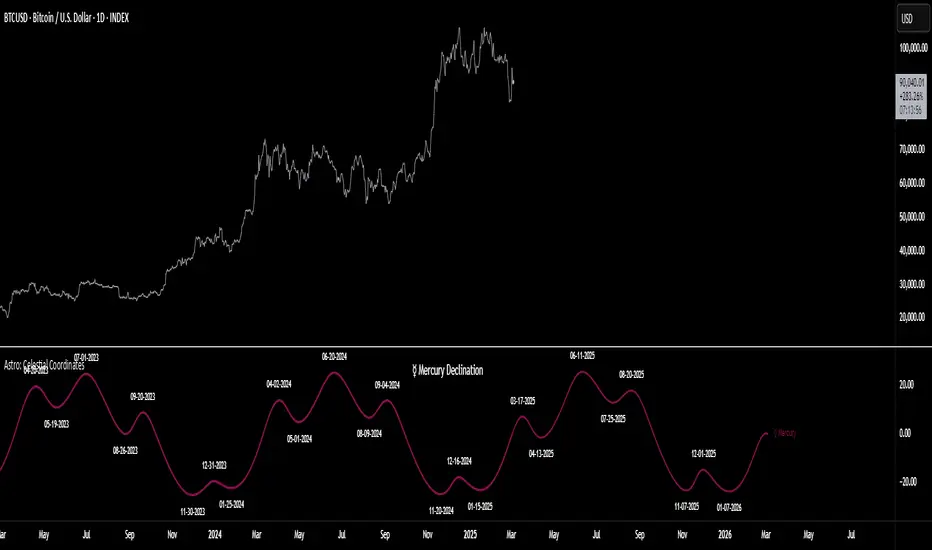
Astro: Celestial CoordinatesCelestial coordinates are a system of measurements used in astronomy and astrology to describe the positions of celestial objects such as stars, planets, and constellations. There are several different celestial coordinates, including right ascension (RA), longitude, latitude, declination, and altitude. Each coordinate has its own astronomical or astrological significance, as outlined below:
Right ascension (RA) is a coordinate used to describe the position of an object in the sky along the celestial equator. It is measured in hours, minutes, and seconds and is analogous to longitude on Earth. RA is significant in both astronomy and astrology because it allows astronomers and astrologers to accurately locate celestial objects in the sky.
Longitude is a coordinate used to describe the position of a planet or other object in its orbit around the Sun. It is measured in degrees and is significant in astronomy because it allows astronomers to accurately predict the positions of planets and other objects in the solar system.
Latitude is a coordinate used to describe the position of an object in the sky relative to the celestial equator. It is measured in degrees and is significant in both astronomy and astrology because it helps astronomers and astrologers to determine the positions of celestial objects in the sky.
Declination is a coordinate used to describe the position of an object in the sky relative to the celestial equator, similar to latitude but measured in degrees north or south of the celestial equator. It is significant in astronomy because it allows astronomers to accurately locate objects in the sky.
Altitude is a coordinate used to describe the height of an object above the horizon. It is measured in degrees and is significant in both astronomy and astrology because it allows astronomers and astrologers to determine when objects will be visible in the sky and at what angle.
In astrology, celestial coordinates are used to create maps of the positions of celestial objects. This indicator plots the corresponding celestial coordinate
values for each planet, moon, or sun and labels key turning (pivot) points with a date (& optional time). Hover over labels for additional information.
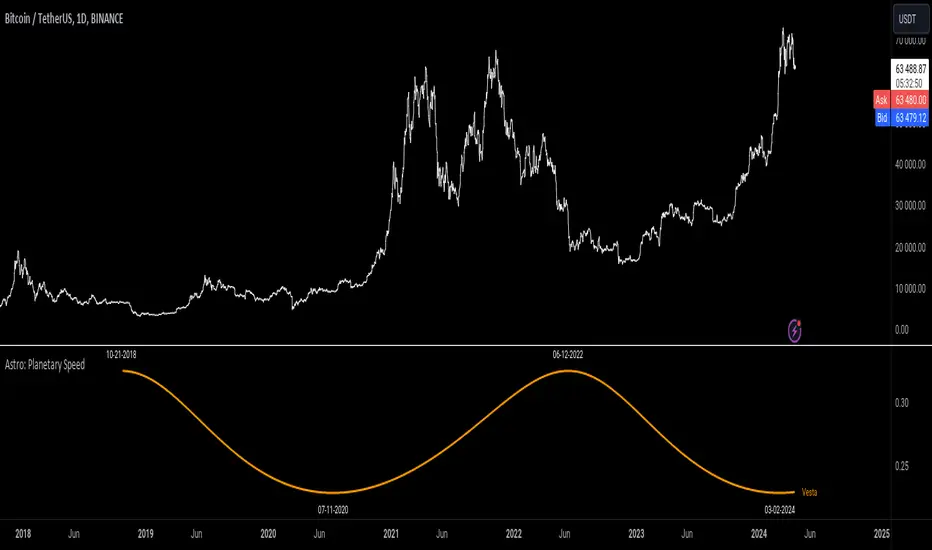
Astro: Planetary SpeedPlanetary speed refers to the rate at which a planet moves along its orbit around the Sun. The speed of a planet can vary depending on its distance from the Sun, and is generally fastest at the point in its orbit where it is closest to the Sun (perihelion) and slowest at the point where it is farthest from the Sun (aphelion).
The significance of planetary speeds lies in their astrological interpretation. In astrology, the speed of a planet is thought to influence its energy and influence earthly affairs. Fast-moving planets, such as Mercury and Venus, are believed to have a more immediate and fleeting influence, while slower-moving planets, such as Jupiter and Saturn, are thought to have a more long-lasting and significant impact.
Astrologers use the speed of the planets, along with their positions, aspects, and other factors, to interpret their influence. By understanding the energy and symbolism associated with each planet, astrologers can provide insight and guidance to individuals seeking a greater understanding.
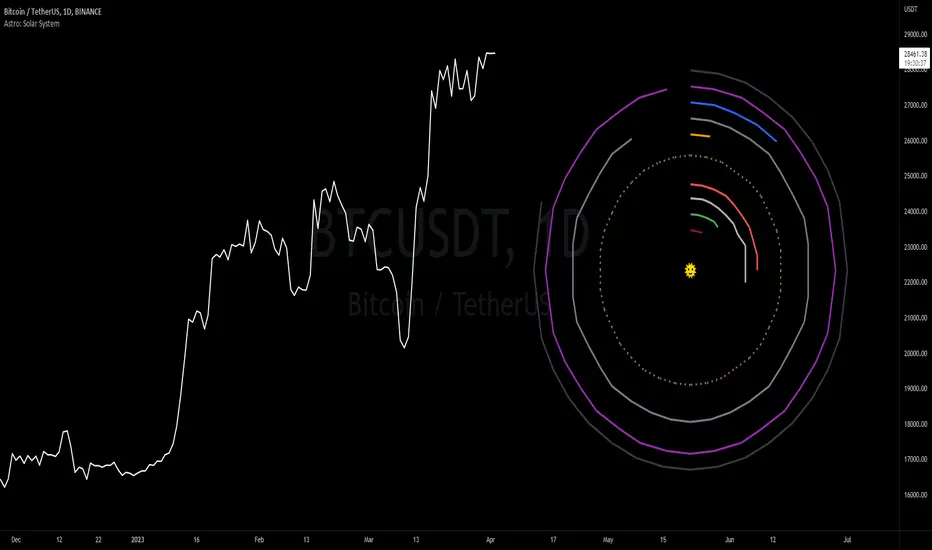
Astro: Solar SystemA bird's eye view model of the solar system is a simplified representation of our planetary system as seen from above. It can be thought of as a two-dimensional map of the solar system, in which the planets are shown in their approximate heliocentric longitudinal positions relative to the Sun and each other.
In this model, the Sun is shown as a large, central emoji, with the planets arranged in orbits around it. The inner planets - Mercury, Venus, Earth, and Mars - are located close to the Sun and inside the asteroid belt, while the outer planets - Jupiter, Saturn, Uranus, Neptune, and Pluto- are located farther out.
In a bird's eye view model, some of the details of the solar system are necessarily left out or simplified. For example, the distances between the planets are not to scale, and the orbits are shown as perfect circles rather than the elliptical shapes they actually are. Nonetheless, this model can provide a useful visual real-time representation of the relative heliocentric longitudinal positions (aspects) of the planets in our solar system.
🏅 Shoutout to @LuxAlgo for the circle code!
Astro: Planetary Aspect TableIn astrology, planetary aspects refer to the angles formed between two or more planets in a horoscope or birth chart. These angles are created by the positions of the planets in the sky and are thought to represent a particular energy or influence that can impact events on Earth.
The most common planetary aspects are the conjunction (when two planets are in the same position in the zodiac), the opposition (when two planets are direct across from each other in the zodiac), the trine (when two planets are 120 degrees apart in the zodiac), and the square (when two planets are 90 degrees apart in the zodiac).
This chart overlay displays a real-time table of current interplanetary aspects for all AstroLib celestial body combinations.

Astro: Planetary Aspect DatesIn astrology, planetary aspects refer to the angles formed between two or more planets in a horoscope or birth chart. These angles are created by the positions of the planets in the sky and are thought to represent a particular energy or influence that can impact events on Earth.
The most common planetary aspects are the conjunction (when two planets are in the same position in the zodiac), the opposition (when two planets are direct across from each other in the zodiac), the trine (when two planets are 120 degrees apart in the zodiac), and the square (when two planets are 90 degrees apart in the zodiac).
This chart overlay is a simple companion indicator that highlights aspect dates for the following oscillator:

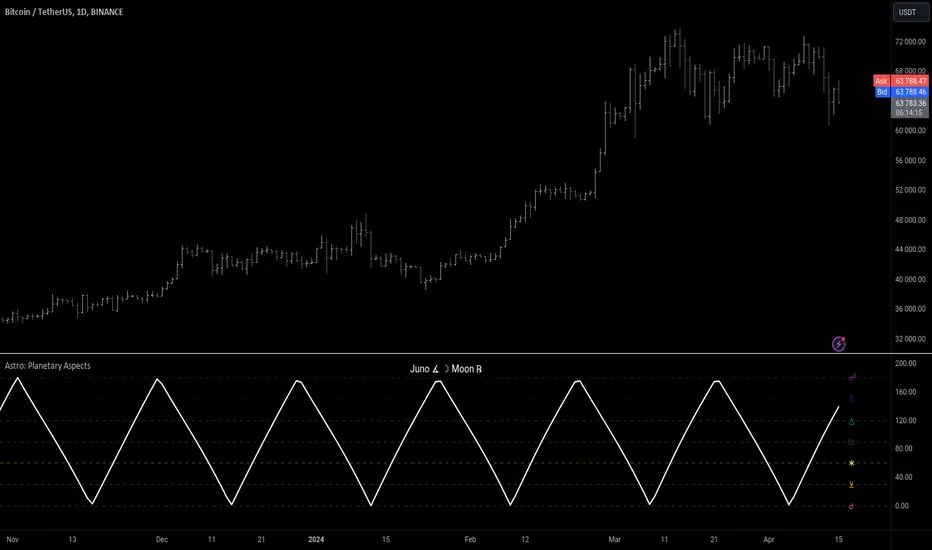
Astro: Planetary AspectsIn astrology, planetary aspects refer to the angles formed between two or more planets in a horoscope or birth chart. These angles are created by the positions of the planets in the sky and are thought to represent a particular energy or influence that can impact events on Earth.
The most common planetary aspects are the conjunction (when two planets are in the same position in the zodiac), the opposition (when two planets are direct across from each other in the zodiac), the trine (when two planets are 120 degrees apart in the zodiac), and the square (when two planets are 90 degrees apart in the zodiac).
This oscillator plots the current geocentric/heliocentric aspect for up to two planets and features a customizable precision of degree (up to +/- 15 degrees) for each aspect.
Astro: Planetary LongitudesPlanetary longitude is a measurement of the position of a planet in its orbit around the Sun, expressed in degrees of arc along the plane of the planet's orbit. It is one of the fundamental coordinates used in astronomy to describe the position of a planet or other celestial object.
The concept of planetary longitude is important in astrology, where it is used to determine the position of the planets in the zodiac. In this context, the longitude is measured along the ecliptic, which is the apparent path of the Sun on the celestial sphere. Astrologers use the position of the planets in the zodiac to make predictions and interpretations about personality traits, life events, earthquakes, market events, and other aspects of human experience.
This indicator includes geocentric/heliocentric longitude lines with retrograde identification, Vedic Nakshatras, and astrological zodiac & aspects for each of the 9 planets plus the Sun & Moon. Hover over labels for additional information.
🏅Shoutout to @AdzAdama and @Virinchi for all the help with this indicator
AstroLibLibrary "AstroLib", or Astro Library, is a collection of public Pinescript functions & calculations for use in astrology & astronomy indicators. Unless noted otherwise, this library was written jointly by @badsector666 and @BarefootJoey.
Library "AstroLib"
t_(txt)
Parameters:
txt (string)
JDNv2(t, withFraction)
Parameters:
t (float)
withFraction (bool)
J2K(t)
Parameters:
t (float)
J2KtoUnix(TimeInJDN)
Parameters:
TimeInJDN (float)
atan2(y, x)
Parameters:
y (float)
x (float)
DegSin(x)
Parameters:
x (float)
DegCos(x)
Parameters:
x (float)
DegTan(x)
Parameters:
x (float)
DegArcsin(x)
Parameters:
x (float)
DegArccos(x)
Parameters:
x (float)
DegArctan(x)
Parameters:
x (float)
DegAtan2(y, x)
Parameters:
y (float)
x (float)
range2pi(x)
Parameters:
x (float)
range360(x)
Parameters:
x (float)
gst(days)
Parameters:
days (float)
DegDecimal(Degrees, Minutes, Seconds)
Parameters:
Degrees (float)
Minutes (float)
Seconds (float)
Rectangular(R, theta, phi, Index)
Parameters:
R (float)
theta (float)
phi (float)
Index (float)
rLength(x, y, z)
Parameters:
x (float)
y (float)
z (float)
spherical(x, y, z, Index)
Parameters:
x (float)
y (float)
z (float)
Index (float)
obliquity(d)
Parameters:
d (float)
requatorial(x, y, z, d, Index)
Parameters:
x (float)
y (float)
z (float)
d (float)
Index (float)
recliptic(x, y, z, d, Index)
Parameters:
x (float)
y (float)
z (float)
d (float)
Index (float)
sequatorial(R, theta, phi, d, Index)
Parameters:
R (float)
theta (float)
phi (float)
d (float)
Index (float)
secliptic(R, theta, phi, d, Index)
Parameters:
R (float)
theta (float)
phi (float)
d (float)
Index (float)
precess(d1, d2, DEC, RA, Index, ddec, dra)
Parameters:
d1 (float)
d2 (float)
DEC (float)
RA (float)
Index (float)
ddec (float)
dra (float)
riset(J2000, DEC, RA, GLat, GLong, Index)
Parameters:
J2000 (float)
DEC (float)
RA (float)
GLat (float)
GLong (float)
Index (float)
ssun(d, Index)
Parameters:
d (float)
Index (float)
rsun(d, Index)
Parameters:
d (float)
Index (float)
sun(d, Index)
Parameters:
d (float)
Index (float)
SunLongitude(d, Index)
Parameters:
d (float)
Index (float)
Sunrise(J2000, GLat, GLong, Index, altitudex)
Parameters:
J2000 (float)
GLat (float)
GLong (float)
Index (float)
altitudex (float)
smoon(dx, Index)
Parameters:
dx (float)
Index (float)
rmoon(d, Index)
Parameters:
d (float)
Index (float)
tmoon(d, GLat, GLong, Index)
Parameters:
d (float)
GLat (float)
GLong (float)
Index (float)
moon(d, Index)
Parameters:
d (float)
Index (float)
Element(d, pnum)
Parameters:
d (float)
pnum (int)
kepler(m, ecc, eps)
Parameters:
m (float)
ecc (float)
eps (float)
rplanet(d, pnumber, Index)
Parameters:
d (float)
pnumber (int)
Index (float)
planet(d, pnumber, Index)
Parameters:
d (float)
pnumber (int)
Index (float)
altaz(d, DEC, RA, GLat, GLong, Index)
Parameters:
d (float)
DEC (float)
RA (float)
GLat (float)
GLong (float)
Index (float)
prise(d, P, GLat, GLong, Index)
Parameters:
d (float)
P (int)
GLat (float)
GLong (float)
Index (float)
MoonSize(d)
Parameters:
d (float)
Refraction(Temperature_C, Atmospheric_Pressure_mBar, Altitude_Deg)
Parameters:
Temperature_C (float)
Atmospheric_Pressure_mBar (float)
Altitude_Deg (float)
MoonRise(d, Longitude, Latitude, Index)
Parameters:
d (float)
Longitude (float)
Latitude (float)
Index (float)
f_to_sec(dec)
Parameters:
dec (float)
f_to_time(sec)
Parameters:
sec (float)
deg_to_time(deg)
Parameters:
deg (float)
toDMS(coordinate)
Parameters:
coordinate (float)
convertDMS(lat, lng)
Parameters:
lat (float)
lng (float)
convlatdec(deg)
Parameters:
deg (float)
PlanetName(pnum)
Parameters:
pnum (int)
PlanetNameV(pnum)
Parameters:
pnum (int)
PlanetSign(pnum)
Parameters:
pnum (int)
PlanetColor(pnum)
Parameters:
pnum (int)
zodiaccolor(deg)
Parameters:
deg (float)
degsign(deg)
Parameters:
deg (float)
degsignf(deg)
Parameters:
deg (float)
degnash(deg)
Parameters:
deg (float)
degname(deg)
Parameters:
deg (float)
retrogradesym(deg)
Parameters:
deg (float)
degaspsign(deg)
Parameters:
deg (float)
degaspname(deg)
Parameters:
deg (float)
degaspfull(deg)
Parameters:
deg (float)
degaspfullV2(deg)
Parameters:
deg (float)
degaspnameV2(deg)
Parameters:
deg (float)
degtolowest180(deg)
Parameters:
deg (float)
degaspfullapproach(deg)
Parameters:
deg (float)
virinchiaspectcol(deg, bull_col, bear_col)
Parameters:
deg (float)
bull_col (color)
bear_col (color)
virinchiaspectemo(deg, bull_emo, bear_emo)
Parameters:
deg (float)
bull_emo (string)
bear_emo (string)
aspectfastsigndeg(deg)
Parameters:
deg (float)
aspectfastfull(deg)
Parameters:
deg (float)
aspectslowfull(deg)
Parameters:
deg (float)
aspectslowsigndeg(deg)
Parameters:
deg (float)
aspectslowsign(deg)
Parameters:
deg (float)
aspectsignprecision(deg, precision)
Parameters:
deg (float)
precision (int)
aspectsignprecisionV2(deg, precision)
Parameters:
deg (float)
precision (float)
aspectsignprecisionV2ext(deg, precision)
Parameters:
deg (float)
precision (float)
IPaspectsignprecision(planet1, planet2, precision)
Parameters:
planet1 (float)
planet2 (float)
precision (float)
IPaspectsignprecisionFull(planet1, planet2, precision)
Parameters:
planet1 (float)
planet2 (float)
precision (float)
IPaspectlineprecision(planet1, planet2, precision, style, width)
Parameters:
planet1 (float)
planet2 (float)
precision (float)
style (string)
width (int)
rDeg(deg)
Parameters:
deg (float)
AngToCirc(angle)
Parameters:
angle (float)
AngToCirc180(angle)
Parameters:
angle (float)
sidereal(deg, sidereal)
Parameters:
deg (float)
sidereal (bool)
J2000(JDN)
Parameters:
JDN (float)
JDN(t, d, tz)
Parameters:
t (float)
d (float)
tz (float)
getsun(index, day, dayr, latitude, longitude, tz)
Parameters:
index (int)
day (float)
dayr (float)
latitude (float)
longitude (float)
tz (float)
getmoon(index, day, dayr, latitude, longitude)
Parameters:
index (int)
day (float)
dayr (float)
latitude (float)
longitude (float)
getplanet(planet, index, day, dayr, latitude, longitude, tz)
Parameters:
planet (int)
index (int)
day (float)
dayr (float)
latitude (float)
longitude (float)
tz (float)

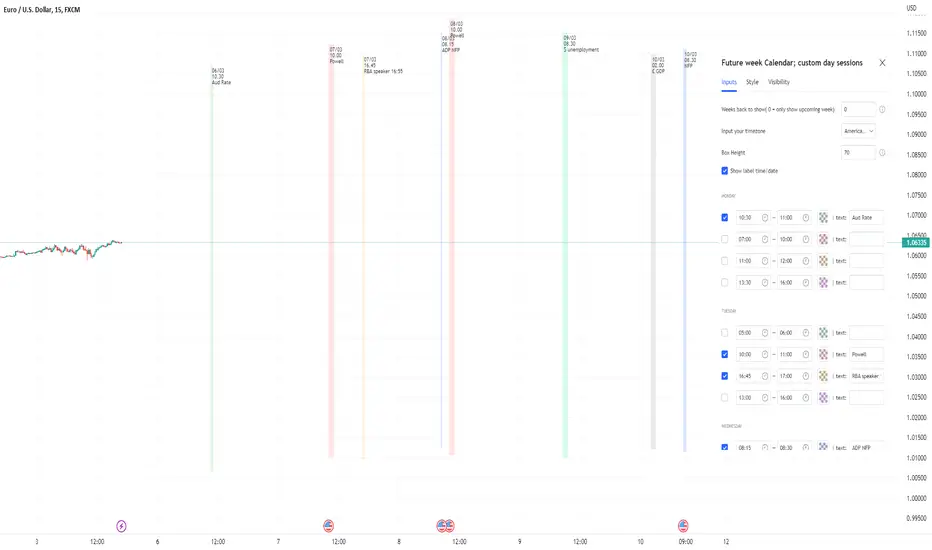
Future week Calendar; Each day's custom sessions & LabelsOn-Chart Calendar for the week ahead with 4x customizable intraday sessions (each day with it's own unique sessions)
-add your own text labels and optional time/date stamps to each session; for key events of the week.
-toggle on/off each individual session.
-Choose number of weeks of history to show (default is 0: only show upcoming week.
-Works on BTC too (includes Saturday/Sunday sessions).
//Notes//
~timestamps and labels anchor to the start of the session box
~when using with default 'weeks back to show' = 0; Session boxes will disappear as price passes through their right hand side.
~to remove the very long indicator status line (due to so many sessions): Go to chart settings >> status line, and under 'indicator' toggle off 'arguments'
Example usage: Each day's 4x custom sessions showing; only upcoming week; no labels
Example usage: Each day's 4x custom sessions showing; Showing 1 week of history too; no labels
Gamification IndicatorDo you want your charts to look like a video game? Look no further! Would you rather be an alien racing through a lava tube, a surfer with great white sharks, an airplane flying through the clouds, or some other custom emoji setup of your choice? Traders can choose their own custom player emoji, trend indicator, obstacle emoji, and celestial emoji. This indicator is just for fun and is not intended to be used when making trading decisions. Enjoy!
This indicator also contains a live sun/moon emoji that should accurately reflect day/night and can give information about the current moon phases.
Shoutout to @citlacom for the public Moon Ephemeris and calculations. Building this indicator was a useful & fun introduction to financial astrology in Pinescript.

Astro | Angular Distance | θAstro | Angular Distance | θ
Also known as Angular Separation , Apparent Distance , or Apparent Separation is the angle between the two sightlines, or between two point objects as viewed from an observer, in our case we can use it as Geocentric/Heliocentric prospective calculated from a combination of some trigonometry functions
We can use it to calculate the Angular Distance between two planets.
How to use it:
- 1st Ascension : The Right Ascension of the first object expressed in degrees.
- 1st Declination : The Declination of the first object expressed in degrees.
- 2nd Ascension : The Right Ascension of the second object expressed in degrees.
- 2nd Declination : The Declination of the second object expressed in degrees.
The result ll'be returned near the table "Angulare Distance" and all the values entered will be plotted on the table in top-right position of the screen.
