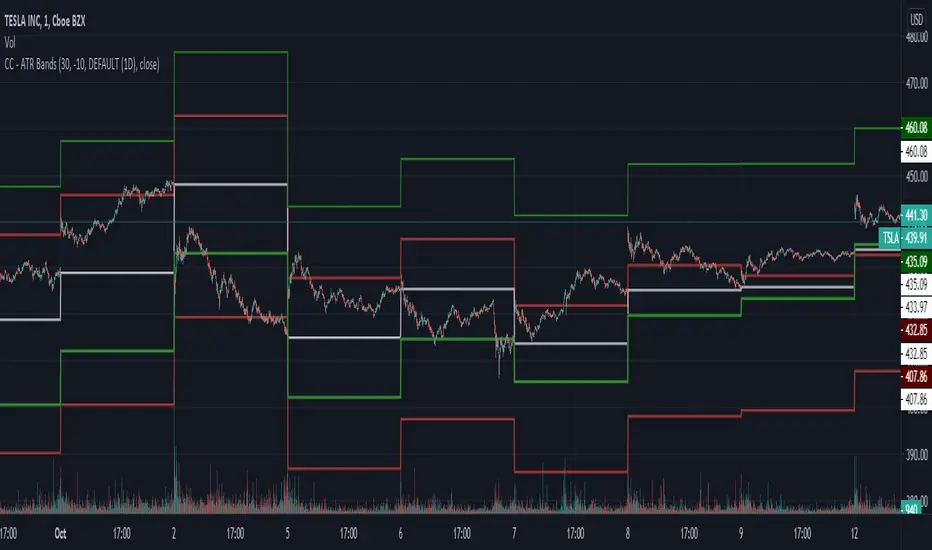
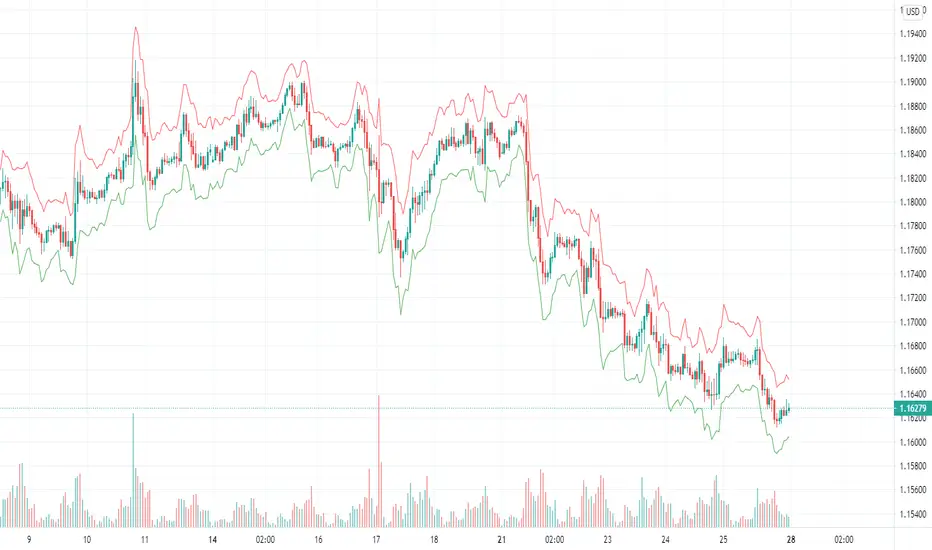
ATR
Indicator SuperTrend AllIndicator SuperTrend All:
An indicator that is an aggregate of other SuperTrend Values (Buy/Sell)
Indicator SuperTrend AllIndicator SuperTrend All:
A composite of using values from individual SuperTrends
DepthHouse - ATR Fib CloudsDepth House ATR Fib Clouds is used to help traders spot dynamic support, resistance, retracement zones, and over-extensions.
Here is a video which I give a brief overview and show it in action:
youtu.be
Based on the zoning colors above:
Red and Blue zones represent common retracement zones.
Green and Orange zones represent possible over-extension zones, and trend changes.
This tool can also help differentiate between bull and bear markets on larger time frames. Trending markets tend to stick within the bottom or top of the loud zones.
Please Note: There are NOT trading signals. Each colored candle represents nothing other than a possibility of which way the trend may go. Be sure to use your own adequate analysis. Use at your own financial risk.
How to get:
As you can see this is an invite only script. In the coming months this indicator, along with many others will become pay to use only. (website on my profile page)
However all my indicators will be FREE until May 1, 2018. So please try them out!
To take advantage of this FREE trial :
1. Subscribe to my YouTube channel. I have many more videos to come! Maybe even leave a comment of what you would like to see next!
2. Comment on this indicator post! Maybe even give me a follow :D
I hope you all enjoy!!
Indicator website: depthhouse.com
Triple 3 EMA ConvergenceThis indicator was made specifically to trigger alerts when multiple EMA lines are converging on multiple time frames.
You change which 3 time frames it looks at (Default 1h, 3h, D) and 3 EMA lengths (Default 8,21,100).
You can also change the threshold in which the convergence is triggered (How tight the convergence must be to trigger (Default 1))
It uses ATR as a filter on each of the time frames with the ATR length set to the FastEMA length setting
If the Daily chart only (Or largest Resolution) is converging, you will see a red column with the value of 100.
If 2 of 3 resolutions are converging, you will see a yellow column with the value of 200.
If all 3 resolutions are converging, you will see a green column with the value of 300.
With this in mind you can set alerts when the value is above any or all of these levels.
Please contact me if you need any further explanation or have suggestions.
Donations are not required but are always welcomed and much appreciated.
LTC - MGgHzsHsQRkLYrDwpQqowHuWNgaYUhMQcZ
BTC -0.30% - 34AoewZtXPW2cj3wqw9Bs5GE6ibUJpjQRv
ETH - 0xCf665150B9b0F65952A201e035aa6BA681016490
Happy Trading Yall. Keep Calm and HODL Litecoin
nATR Reversal StrategyATR Reversal Strategy that has been extended to add an additional ATR based stoploss, trailing stop and take profit.
This script was developed as part of a professional development service. It is published for customer verification and acceptance.
For people interested in professional services, please visit the backtest-rookies (.com) website.
Features
nATR based Stop Loss added
nATR based Trailing stop added
nATR based Take profit added
Switches for each exit type to turn them on or off in the strategy
Plotting of all exit levels on the chart
Prevent reversing when using newly added exits.
Allow reversing when all exit switches are off and opposite long/short conditions are met.
Daily ATR LinesThis script plots the daily Average True Range lines low and high for each day. Even when using a lower interval it will continue to plot daily lines.
Some traders find this helpful for day trading and consider these as Support and Resistance. For me I use it to see the reasonable move within a day so I can sell options against, I don't necesarily consider them S/R.
For more information on ATR click here.
www.investopedia.com
Fractal Regression Bands [DW]This study is an experimental regression curve built around fractal and ATR calculations.
First, Williams Fractals are calculated, and used as anchoring points.
Next, high anchor points are connected to negative sloping lines, and low anchor points to positive sloping lines. The slope is a specified percentage of the current ATR over the sampling period.
The median between the positive and negative sloping lines is then calculated, then the best fit line (linear regression) of the median is calculated to generate the basis line.
Lastly, a Golden Mean ATR is taken of price over the sampling period and multiplied by 1/2, 1, 2, and 3. The results are added and subtracted from the basis line to generate the bands.
Williams Fractals are included in the plots. The color scheme indicated whether each fractal is engulfing or non-engulfing.
Custom bar color scheme is included.
FIBONACCI BANDS by KIVANCfr3762Calculated with a default value of 14 periods of EMA and 14 periods of Average True Range ( SMA )
There are 4 levels of upper bands and 4 levels of lower bands in the indicator
its calculated adding and subtracting ATR( SMA ) values with coefficients 1, 1.618, 2.618 and 4.236 (Fibonacci ratios) to EMA of close prices.
Top and Bottom Fibo lines are aceepted as significant Resistance and Support levels.
DepthHouse - ATR BandsDepthHouse ATR Bands is a FREE INDICATOR
Similar to the well-known Bollinger Bands.
Instead of using the standard deviation formula, ATR Bands determines the size of the bands based on the adjustable average range.
IF you use this FREE Indicator:
Please like and comment!
Check out my channel on YouTube! youtu.be
Bitcoin and Ethereum Donations are always appreciated :)
BTC : 1MLnVPqebcFTqYEVAKm9dSCRWhyNDmAb5W
ETH : 0xEEcD7Ce6E22AfA6083074c4CCd326Be0b1C932d9
How to use:
The bands tighten while the markets’ range becomes lower, and widens as its' range becomes broader. Giving the indicator a loaded spring effect.
A break outside of the bands in either direction indicates a possible breakout.
All 3 bands serve as possible support and/or resistance. Meaning breaks back into the bands could indicate a reversal, or end of the breakout.
This indicator is completely customizable, so compiling multiple sized bands on top of each other may create a strong competitive edge.
--
IF YOU SUBSCRIBED
This indicator was intended to be available for purchase Jan 2018.
However, with recent change of mind I have decided to make it free to use.
IF you previously subscribed. I greatly appreciate your interest and I hope you enjoy this now FREE indicator!
Once again, thank you!
Hawkeye Levels ATRExit at the right time with Levels ATR!
Levels ATR is a powerful series of user pre-defined levels, which act as both potential exit positions and stop loss management.
The Levels ATR indicator helps traders identify clear exit strategies.
Inexperienced traders can:
spend too long focusing on where to enter the position
spend no time on where to exit or take profits
allow the market to dictate the exit following a particular chart pattern or set up
be panicked into exiting
Few traders concentrate on their exit strategies, yet this is where the big profits are made!
KAMA Fibonacci Bands [DW]This study is an experimental combination of the Kaufman Adaptive Moving Average with ATR and Fibonacci percentages.
Smooth Regression Bands [DW]This is an experimental study using Kaufman Adaptive Moving Average (KAMA), ATR Decay, Linear Regression Bands, and McGinley Dynamic smoothing.
DepthHouse - ATR BandsDepthHouse ATR Bands works very similar to the well-known Bollinger Bands.
However, these bands are calculated slightly different.
Instead of using the standard deviation formula, ATR Bands determines the size of the bands based on the average range.
How to use:
The bands tighten while the markets’ range becomes lower, and widens as its' range becomes broader. Giving the indicator a loaded spring effect.
A break outside of the bands in either direction usually indicates a breakout.
All 3 bands serve as possible support and/or resistance. Meaning breaks back into the bands could indicate a reversal, or end of the breakout.
This indicator is completely customizable, so compiling multiple sized bands on top of each other may create a strong competitive edge.
This indicator is free until January,1st 2018 – see how to get below
--
DepthHouse's ATR Bands is 1 of 3 indicators that will be available for purchase via subscription come Jan 2018.
This indicator package will come with the following 3 indicators:
:: MaxADX ::
::Premium oscillator to help spot forming trends and reversals.
:: MaxADX Signals ::
::Taking MaxADX a step farther by creating an overlay that show possible trend strengthening and reversals via bar colors and shapes.
:: ATRBands ::
::Like Bollinger Bands , this indicator is uses to help spot breakouts, and overbought/sold areas.
--
How to get:
To qualify for the trial period which ends January, 1st 2018, please go to the link on my profile and click subscribe!
You will then be sent directions for your account to be added to the whitelist.
If you have already subscribed to one of my previous indicators, you will be added to the list shortly
Likes and comments are so very much appreciated!
DepthHouse - MaxADX LayoverThis indicator takes our MaxADX a step further by giving possible trend change signals.
MaxADX combines directional information and smoothed moving averages to help traders indicate trend reversals and strengthening trends. As you can see in the chart above this indicator makes it very easy to spot trend reversals in trending markets.
How to use MaxADX Oscillator:
The top circles represent the immediate trend. Used as very early indication of trend changes and/or reversals
The solid line just below that represents the general trend direction. Green meaning up white red meaning down.
The histogram below that represents the general trend strength. A change in that indicate a reversal or a breakout in either direction.
The MaxADX Layover:
The layover then calculates three variables above, and determines the possible direction with symbols and/or bar colors which can easily be turned on or off.
Where this indicator falls short unfortunately, is its use in ranging markets.
Which leaves this as a great indicator for all beginners and professionals who prefer to trade in volatile markets such as cryptocurrencies.
This indicator will be free until January,1st 2018 – see how to get below
--
DepthHouse's MaxADX is 1 of 3 indicators that will be available for purchase via subscription come Jan 2018.
This indicator package will come with the following 3 indicators:
:: MaxADX ::
:: Premium oscillator to help spot forming trends and reversals.
:: MaxADX Signals ::
:: Taking MaxADX a step farther by creating an overlay that show possible trend strengthening and reversals via bar colors and shapes.
:: ATRBands ::
:: Like Bollinger Bands , this indicator is uses to help spot breakouts, and overbought/sold areas.
--
How to get:
To qualify for the trial period which ends January, 1st 2018, please go to the link in my bio and click subscribe!
You will then be sent directions for your account to be added to the whitelist.
If you have already subscribed, you will be added to the list shortly.
Umbral de RuidoSe trata de usar el ATR para crear un umbral de ruido alrededor del precio. La rotura de ese umbral nos dara señales de entrada y salida. El ATR viene multiplicado por una constante que suele ser de entre 1.5 y 3.0. Se recomiendan valores cercanos a 3 para el stoploss y 1.5 o 2.0 para la entrada.
Esta estrategia esta recomentada para activos que tengan una volatilidad controlada. Da buenos resultados en los indices, pero por lo que yo he probado no es buena para el EURUSD, me gustaria probarla tambien en acciones. Pero de momento la tengo funcionando en DAX con buenos resultados.
Procedimiento para largos:
Usamos la banda superior para marcar la entrada. Siempre que la banda marque un valor menor colocaremos una orden pendiente ahi. Con stoploss en su banda inferior. Si el valor de la banda aumenta, no actualizaremos la orden. Por lo tanto buscamos el menor valor posible del umbral de ruido.
Cuando el precio atraviese ese valor empezaremos a actualizar el stoploss siempre a un valor superior. Es decir si el umbral nos da un valor de stoploss menor nosotros no lo bajaremos.
La salida se produce por stop loss.
Procedimiento para cortos:
Usamos la banda inferior para marcar la entrada. Siempre que la banda marque un valor mayor colocaremos una orden pendiente ahi. Con stoploss en su banda superior. Si el valor de la banda disminuye, no actualizaremos la orden. Por lo tanto buscamos el mayor valor posible del umbral de ruido.
Cuando el precio atraviese ese valor empezaremos a actualizar el stoploss siempre a un valor inferior. Es decir si el umbral nos da un valor de stoploss menor nosotros no lo subiremos.
La salida se produce por stop loss.
Funciona mejor combinado con una media lenta de 100 o 200 para filtrar si ir a largos o cortos.
sadig172 - Average True Range Multiplied by factorCalculates and shows a percentage of the Average True Range.
Default is 120% ATR.
ATR+ (Stop Loss Indicator)This script is designed to aid in back-testing and trade execution.
It displays three sets of values - the teal colored value is the current ATR, the green colored value is your stop loss distance (in pips) below the most recent swing low for long trades , and the red colored value is your stop loss distance (in pips) above the most recent swing high for short trades .
You can change the stop loss settings to base your stop loss on a set pip amount or by however many multiples of the current ATR as you wish (eg. 1.5x ATR).
Feel free to ask any questions or edit the script without permission :)
- Matt.
Supertrend CloudSupertrend is a simple yet great indicator which is based hard data, especially when combined with an additional ST line which has its multiplication doubled.
Enjoy :)
ATR True Range - Multi Timeframe - BonavestTo add this indicator to your charts:
Click the 'Add to Favorite Scripts' button down below this description.
This simple indicator is merely for displaying mulitple ATR ranges at a glance on one chart.
SETTINGS
Each ATR is completely configurable:
Length - to base the ATR on
Timeframe - 'Chart' uses the current chart resolution; other timeframes are available on pull downs
Multiplier - Each ATR can use a multiplier to be able to show multiples or fractions of the full ATR. (i.e. 85=85%, 150=150%)
Dark Theme - Default colors for black or dark backgrounds
I use this indicator for:
Determining price ranges
Setting stop losses and take profit levels