Multiple Moving AveragesThis is an indicator with 4 moving average slots and 6 exponential moving average slots
It also has bollinger bands and a volume weighted moving average slot
Feel free to edit this and add/remove some and publish your own
Averages
Krowns 10 PACK Combo (5 EMAs, 5 SMAs) - v2Version 2 - Krowns Crypto 10 pack moving average set - written by "Kick Back Time" also known as Mr.Scrogers Neighborhood
...after receiving a lot of likes from the first version I thought I would go ahead and put out the updated version that I've been using
There's a few things I've changed to make it easier to adapt to.
This set is very similar to what Krown uses - I rarely look at the 100 SMA, but I do like the 128 SMA, so I made it default over the 100...
It's all adjustable in values, colors, line thicknesses, etc... it's all good
Tweeks/Improvements:
1) now has a shorter overlay title so it takes up less space on the chart and is less distractive
2) the 30, 50 and 128 SMA's are now default pink which stand out well and are easier to associate as SMA's
10/20 MA Cross-Over with Heikin-Ashi Signals by SchobbejakThe 10/20 MA Heikin-Ashi Strategy is the best I know. It's easy, it's elegant, it's effective.
It's particularly effective in markets that trend on the daily. You may lose some money when markets are choppy, but your loss will be more than compensated when you're aboard during the big moves at the beginning of a trend or after retraces. There's that, and you nearly eliminate the risk of losing your profit in the long run.
The results are good throughout most assets, and at their best when an asset is making new all-time highs.
It uses two simple moving averages: the 10 MA (blue), and the 20 MA (red), together with heikin-ashi candles. Now here's the great thing. This script does not change your regular candles into heikin-ashi ones, which would have been annoying; instead, it subtly prints either a blue dot or a red square around your normal candles, indicating a heikin-ashi change from red to green, or from green to red, respectively. This way, you get both regular and heikin ashi "candles" on your chart.
Here's how to use it.
Go LONG in case of ALL of the below:
1) A blue dot appeared under the last daily candle (meaning the heikin-ashi is now "green").
2) The blue MA-line is above the red MA-line.
3) Price has recently breached the blue MA-line upwards, and is now above.
COVER when one or more of the above is no longer the case. This is very important. You want to keep your profit.
Go SHORT in case of ALL of the below:
1) A red square appeared above the last daily candle (meaning the heikin-ashi is now "red").
2) The red MA-line is above the blue MA-line.
3) Price has recently breached the blue MA-line downwards, and is now below.
Again, COVER when one or more of the above is no longer the case. This is what gives you your edge.
It's that easy.
Now, why did I make the signal blue, and not green? Because blue looks much better with red than green does. It's my firm believe one does not become rich using ugly charts.
Good luck trading.
--You may tip me using bitcoin: bc1q9pc95v4kxh6rdxl737jg0j02dcxu23n5z78hq9 . Much appreciated!--

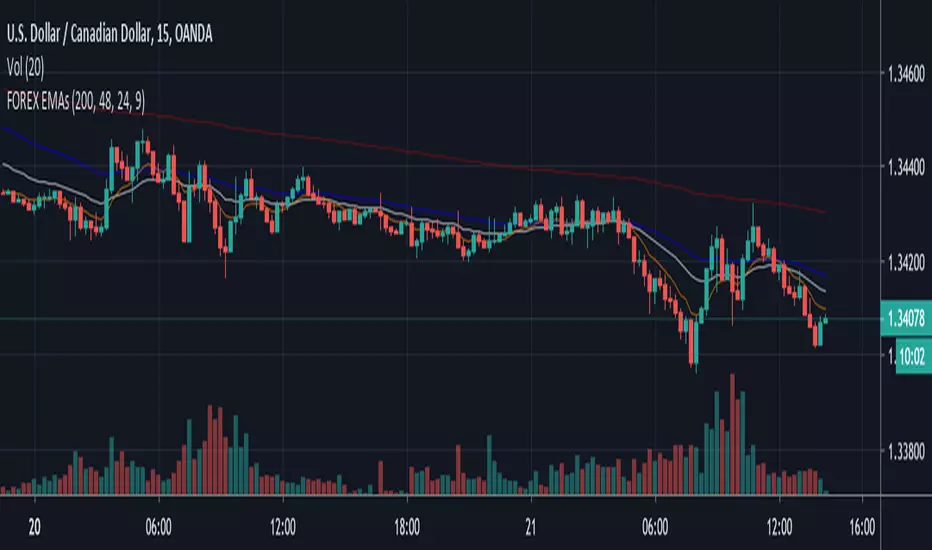
FOREX EMAsPretty simple here - this is the base EMAs I suggest most traders use in the FOREX market for swings and scalp trading. Works well on 5m, 15m, 1H, 4H, and daily trading if you design an edge to interpret the relationship these averages of price are telling you.
The 9EMA is not as valuable on the 1HR timeframe.
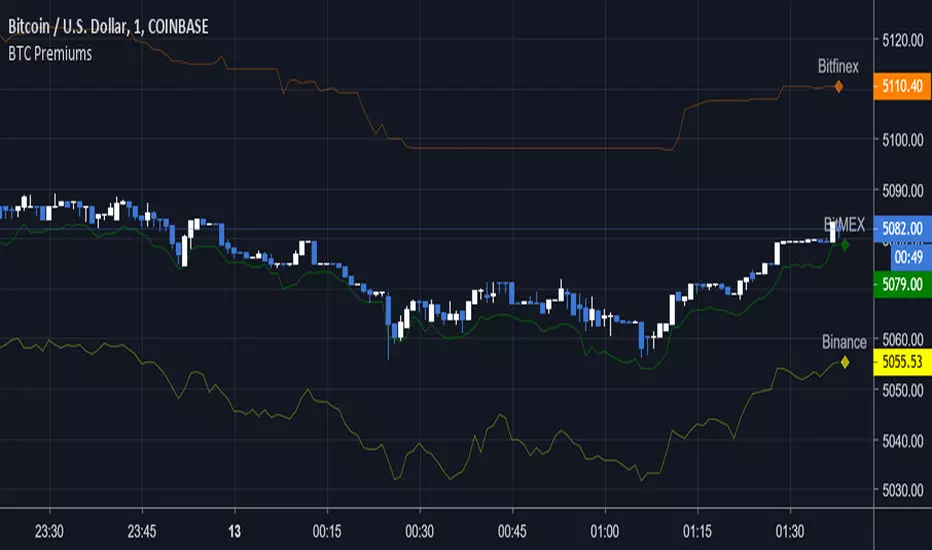
BTC Multi-Premiums — SharkCIAShows the price of BTC on multiple exchanges, helps to see which is leading in price and if the current price is above or below average.
For use on COINBASE:BTCUSD unless you customize it
To use on other platforms (Bitfinex, BitMEX, etc) go to options and enable "Show Coinbase" then hide whatever exchange you're currently on.
To disable exchanges, uncheck them under the Styles tab.
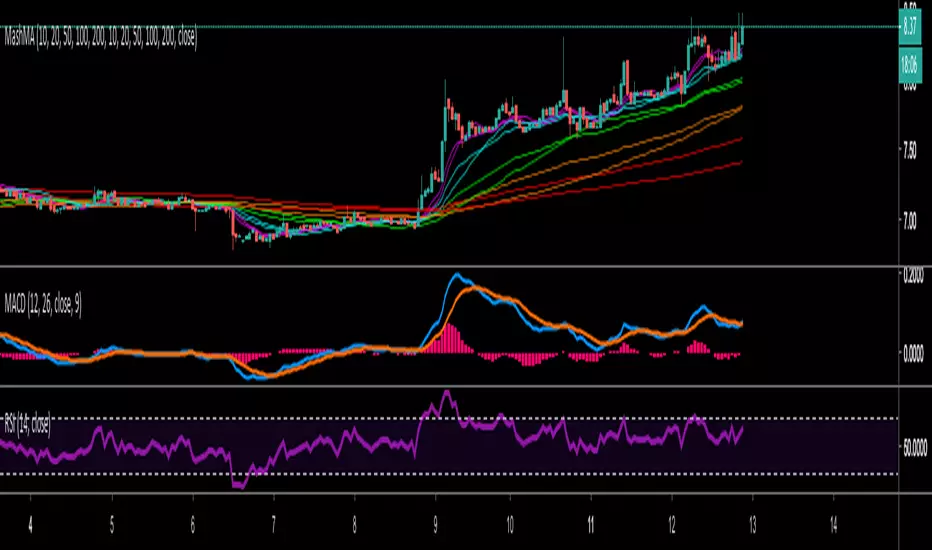
Mash Moving AveragesThis tweaked Moving averages script allows you to edit your Moving Averages to whatever you like, plus you have the option of choosing EMA and SMA
MIA - Most Important AveragesUn unico indicatore vi mostrerà le due medie più importanti, SMA 50 e SMA 200.
Evidenzia inoltre gli incroci fra le medie
-------
A single indicator will show you the two most important averages, SMA 50 and SMA 200
It also highlights the crossings between the averages

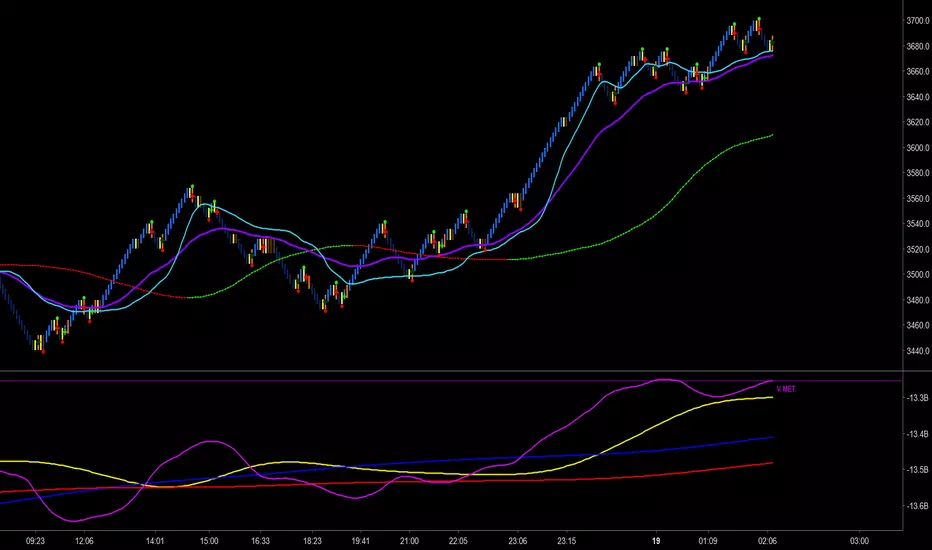
Trader Set - Volume MetricThe last tool in my methodology set, another one of those tools that has unique unpublished formulas, this one purely for following volume and reading smart money's hand, YES it's possible. This indicator has few Alerts built in that you can use, will update the rest of the scripts for additional alerts. You can easily set the alert to play a sound that is not disturbing in long run and check mark open ending and have easy time being alerted when some crossings are happening.
Please, don't ask for access, only my students from my classes will have access to this indicator. The English version of the website and learning material is under development and the moment they get ready I will announce it under each related script.
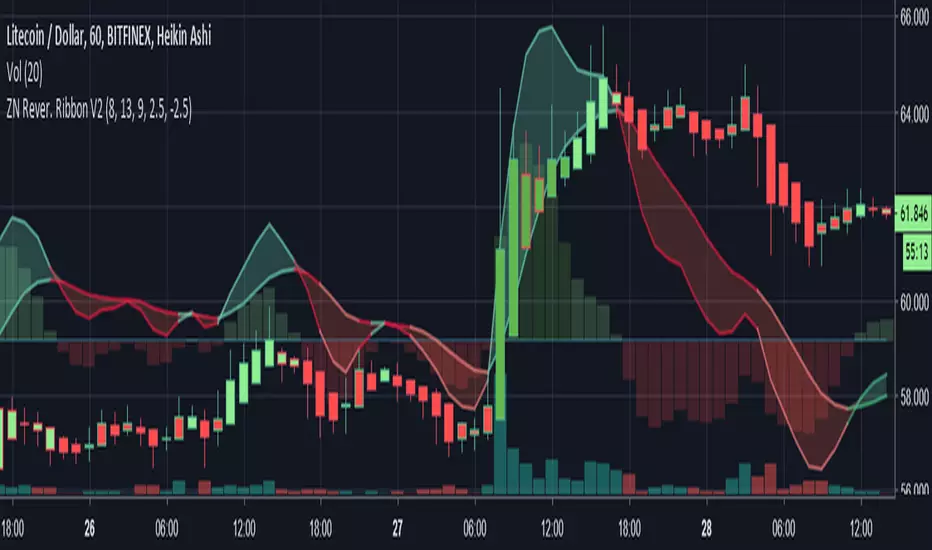
Librehash Reversion Ribbon V2Out of all the indicators created by this brand, this is probably the grandest of them all.
Known as the ‘ZN Reversion Ribbon V2’, for short, this indicator is designed to:
1. Create multiple buy and sell signals
2. Help users gauge the momentum of the price movement.
3. Re-color candles to give users a better understanding of price direction as well as plotting entries and exits.
4. Serve as an enhanced version of the MACD indicator.
5. Effectively gauge buy and sell pressure at any given point in time by using former price data.
There are a lot of moving parts to this indicator, so this guide will be dedicated to dissecting these moving parts, piece by piece.
#1 — Histogram
Perhaps the simplest part of the indicator to dissect at the start is the Histogram. This is also the part of the indicator that can be the most important complement to any other readings that are being made.
You read the histogram in the same manner that you would read the Histogram for the MACD.
The bars in the background are the histogram. Reading this portion of the indicator is fairly simple though.
1. As the green bars get darker, the buy pressure is increasing.
2. As the red bars get darker, the sell pressure is increasing.
3. If the current bar is larger than the last, the trend is sustained. This is the same principle that you would observe in the MACD. The core difference, however, is that this indicator is plugged in with a specific formula (beyond just the basic moving averages), that make them more responsive to price movement in a way that allows for the anticipation of signals being formed.
#2 — Ribbon
The ribbon on this indicator has about 3 different buy/sell signals embedded within it that will allow traders to anticipate an impending change in trend well before it EVER occurs.
This may be the most valuable part of the indicator itself.
Let’s start with the first facet of the ribbon.
A) — The ‘widening’ of the ribbon
When the ribbon ‘expands’, that means that the trend is ‘strengthening’ or growing. When the ribbon narrows or ‘contracts’, that means that the trend is becoming weaker and that this may serve as a warning of impending trend reversal.
In the picture above, you can see the color change of the ribbon itself as well.
You’ll notice that the ribbon transitions from a darker red to a lighter red. That’s a sign of waning sell pressure. You can apply this concept to the green portion of the ribbon too.
B)— The Line Sometimes Signals Before the Cross
This one is a bit harder to explain, but the way that the indicator is programmed is not to turn ‘green’ or ‘red’ based on the crosses, but rather on a mathematical formula.
Now, because of the way the indicator is programmed, the cross often coincides with the color change — but not always.
Below is an example:
Of course, beyond this, there are the usual buy and sell signals that come with the MACD as well.
For instance, there is —
C) The Change in Direction of the is a ‘Buy’ or ‘Sell’ Signal As Well
--------------
Changes in the Candle Colors
Perhaps the most elaborate part of this indicator is the fact that it changes the colors of the candles on the chart in live time without repainting.
In order to understand the candles, here’s a quick guide:
a) dark green with green outline = extreme buy pressure
b) lighter green with green outline = normal buy pressure
c) dark red = heavy sell pressure
d) light red = light sell pressure
e) dark green with red outline = impending reversal downward
f) purple with any outline = ambiguous / neutral
g) light green with red outline = very, very weak sell pressure
h) dark green with red outline = exhausted buy pressure
f) dark red with green outline = exhausted sell pressure
Effectiveness of Indicator
This indicator has the ability to be a ‘game changer’ in terms of its ability to dissect price action.
This next picture is another awesome example of how this indicator works.
Check it out:
Here are the multiple reasons why we could’ve anticipated the reversal in price direction before red candles started showing up:
1. The actual reversion lines themselves began to converge.
2. The Histogram is declining.
3. The bar colors move from dark green to light green.
Now, you may be looking at the above picture and thinking, ‘Well it seems that it didn’t catch the major upswing in the price later though’.
This is true, however —
The gain from this move was preposterous.
Even still, the indicator ensures that we still garner some pretty significant profits.
Conclusion
What you see here sums up this indicator for the most part. However, there are continued updates that will be put out for the indicator in the near future as well.
As always, these can be pushed directly through TradingView (which will happen soon).
Trend Trader AVR This is plots the indicator developed by Andrew Abraham
in the Trading the Trend article of TASC September 1998
It was modified, result values wass averages.

ALL Philakone's EMA's (8,13,21,55,100, 200)These are Philakone's EMA's. I added the 100 day in there as I didn't see that anyone had done that.
The 100 might be the same color as the 200 looking at the code, I changed it on my chart, but just make sure you check the colors.


SMA/EMA 12|26|50SMA/EMA 12|26|50
Exactly as title says
SMA is bold
EMA is light
Orange 12
Green 26
Blue 50

Moving Averages 20,50,128,200 (Exponential optional)4 moving averages in one indicator...
I found the 128 (over the 100) to be more in tune with the BTCUSD Bitfinex chart and more in tune with crypto in general...
With this indicator the stock setting is for Simple Moving Averages and if you want to use Exponential just check the box in the settings


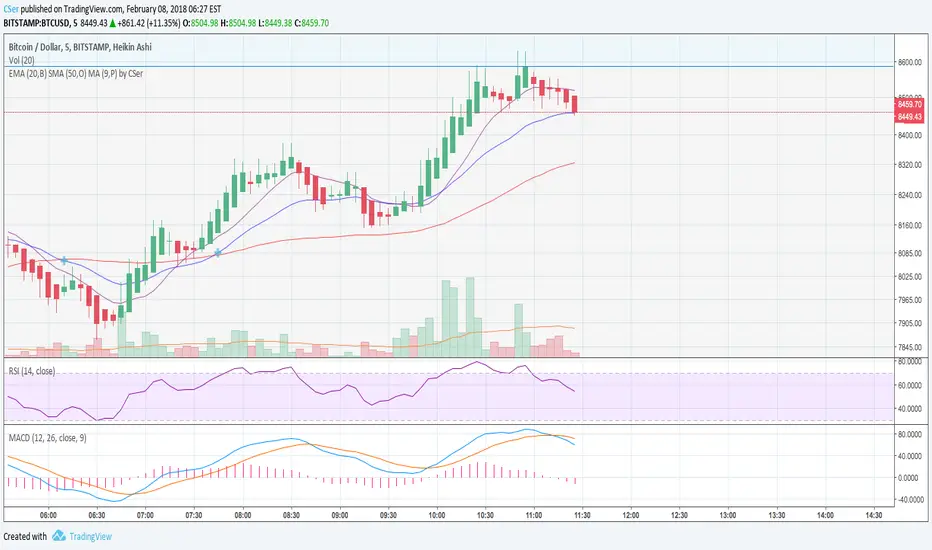
EMA / SMA / MA by CSerCombination of EMA (20), SMA (50) and the default MA (9) with the addition of crosses for EMA and SMA for quick decisions. Let me know your thoughts, corrections and/or additions.
MACDAS by KIVANCfr3762 with Plots and AlertsMACDAS script by KIVANCfr3762, i added Plots and Alerts
original script

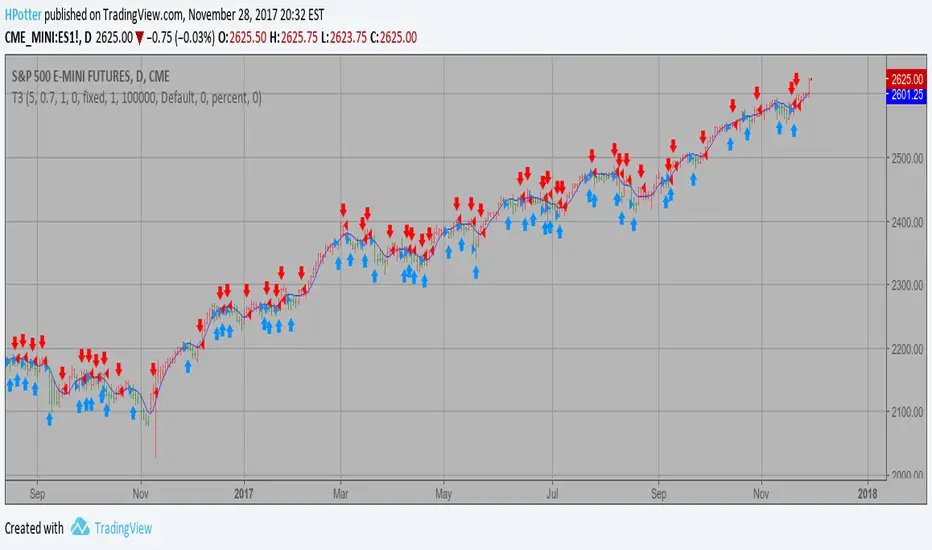
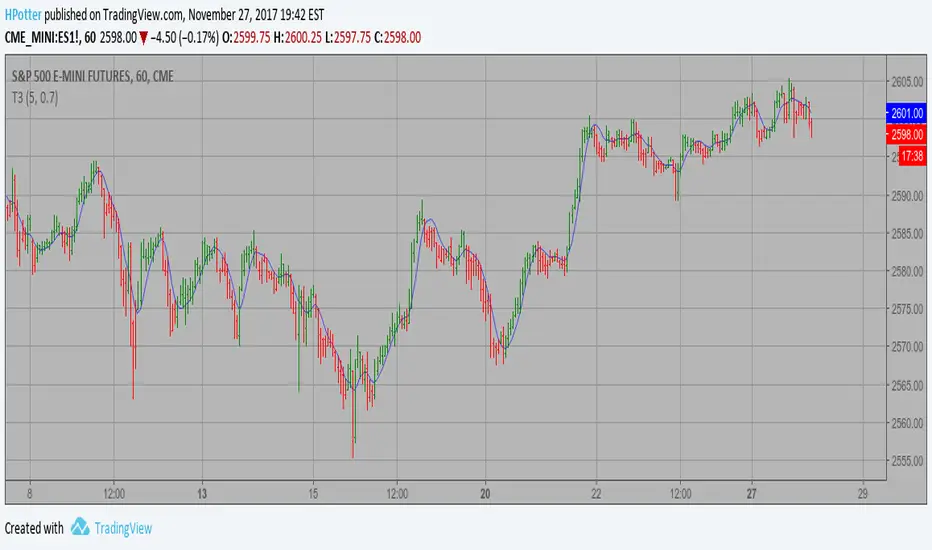
T3 Averages Backtest This indicator plots the moving average described in the January, 1998 issue
of S&C, p.57, "Smoothing Techniques for More Accurate Signals", by Tim Tillson.
This indicator plots T3 moving average presented in Figure 4 in the article.
T3 indicator is a moving average which is calculated according to formula:
T3(n) = GD(GD(GD(n))),
where GD - generalized DEMA (Double EMA) and calculating according to this:
GD(n,v) = EMA(n) * (1+v)-EMA(EMA(n)) * v,
where "v" is volume factor, which determines how hot the moving average’s response
to linear trends will be. The author advises to use v=0.7.
When v = 0, GD = EMA, and when v = 1, GD = DEMA. In between, GD is a less aggressive
version of DEMA. By using a value for v less than1, trader cure the multiple DEMA
overshoot problem but at the cost of accepting some additional phase delay.
In filter theory terminology, T3 is a six-pole nonlinear Kalman filter. Kalman
filters are ones that use the error — in this case, (time series - EMA(n)) —
to correct themselves. In the realm of technical analysis, these are called adaptive
moving averages; they track the time series more aggres-sively when it is making large
moves. Tim Tillson is a software project manager at Hewlett-Packard, with degrees in
mathematics and computer science. He has privately traded options and equities for 15 years.
You can change long to short in the Input Settings
WARNING:
- For purpose educate only
- This script to change bars colors.
T3 Averages Strategy This indicator plots the moving average described in the January, 1998 issue
of S&C, p.57, "Smoothing Techniques for More Accurate Signals", by Tim Tillson.
This indicator plots T3 moving average presented in Figure 4 in the article.
T3 indicator is a moving average which is calculated according to formula:
T3(n) = GD(GD(GD(n))),
where GD - generalized DEMA (Double EMA) and calculating according to this:
GD(n,v) = EMA(n) * (1+v)-EMA(EMA(n)) * v,
where "v" is volume factor, which determines how hot the moving average’s response
to linear trends will be. The author advises to use v=0.7.
When v = 0, GD = EMA, and when v = 1, GD = DEMA. In between, GD is a less aggressive
version of DEMA. By using a value for v less than1, trader cure the multiple DEMA
overshoot problem but at the cost of accepting some additional phase delay.
In filter theory terminology, T3 is a six-pole nonlinear Kalman filter. Kalman
filters are ones that use the error — in this case, (time series - EMA(n)) —
to correct themselves. In the realm of technical analysis, these are called adaptive
moving averages; they track the time series more aggres-sively when it is making large
moves. Tim Tillson is a software project manager at Hewlett-Packard, with degrees in
mathematics and computer science. He has privately traded options and equities for 15 years.
WARNING:
- This script to change bars colors.
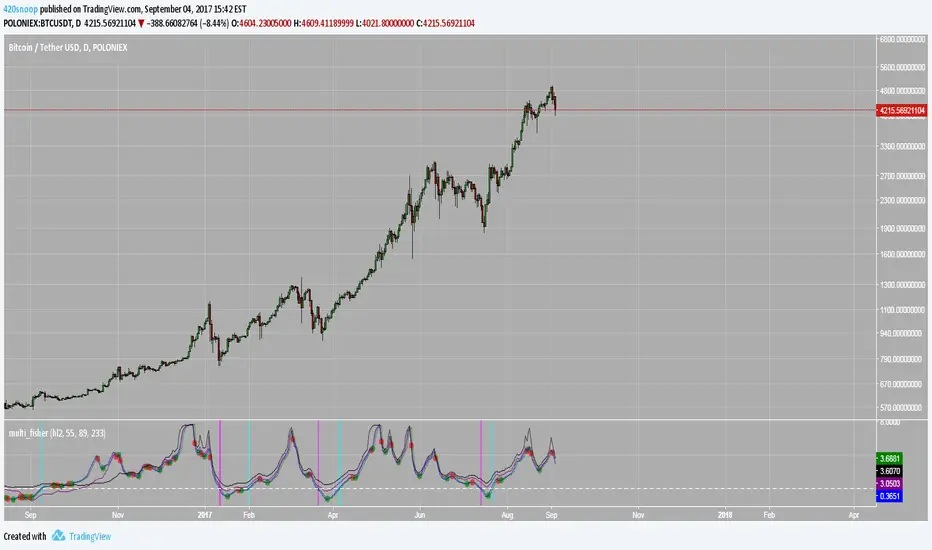
Multi Fisher Transform + AlertBased on 3 Fisher transforms -- this script look for confluence on crosses of 0
this is alert enabled; make sure to use 'once per bar on close'
hope it helps
xoxo
--sn00p