TICK Strength Background ShadeThis indicator shades the background of each candle based on the strength off the current TICK.US chart. User can define the strength levels, which are by default set to 1-299 (lightest), 300-599, and 600+ (darkest). Best used on lower timeframe charts to help identify whether or not to remain in a trend, or if a trend is possibly reversing when you start to see the opposite color begin to appear following a trend.
Background-color

Plot background depending on Index EMA 10 and EMA 20This indicator gives the user an easy way to check the conditions of the market.
Up market should be good for breakout traders.
Down market should be good for breakdown shortsellers
The others should be good for pullback buyers.
This script automaticlly check which index should be used for the depending on which ticker is view. If no match is found indicator will use IXIC as reference.
The script works for Nordic and US stocks.
"OMXSPI"
"OBX"
"OMXSPI"
"OMXHPI"
"OMXCPI"
"IXIC"
It then alculated the EMA10 and EMA20 for the index and plots the background depending on 6 differnet conditions.
EMA10 below EMA20 and EMA10 and EMA20 is sloping down. //Down market
EMA10 above EMA20 and EMA10 and EMA20 is sloping up. //Up market
EMA10 below EMA20 and EMA10 sloping up and EMA20 is sloping down. //First indication by market to move up
EMA10 above EMA20 and EMA10 sloping down and EMA20 is sloping up. //First indication by market to move down
EMA10 below EMA20 and EMA10 sloping up and EMA20 is sloping up. //Possible MA cross over
EMA10 below EMA20 and EMA10 sloping down and EMA20 is sloping down. //Possible MA cross over

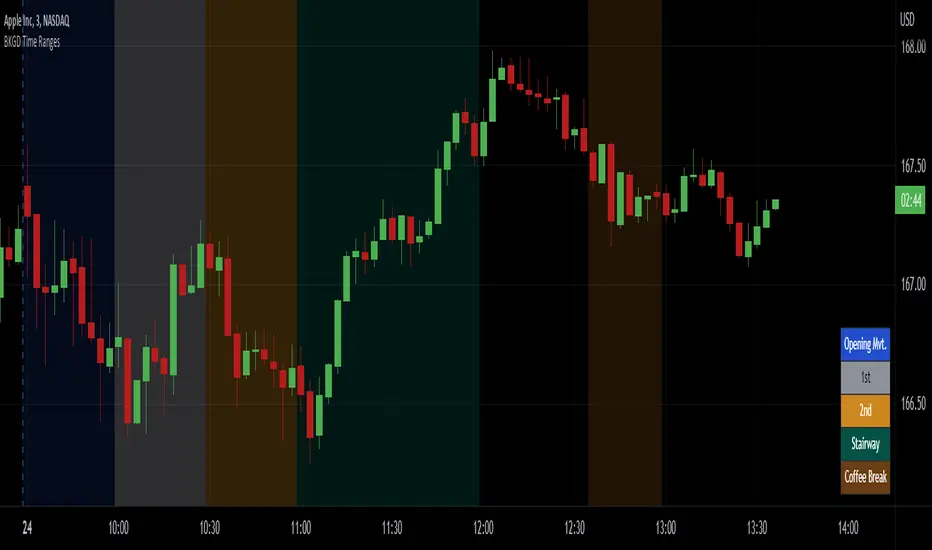
Intraday Background Time RangesThis simple script was written for studying recurring intraday behaviours of financial instruments. With it, you can highlight up to 13 customizable time ranges on your chart, filling the corresponding background space with colors you prefer. You can then write a note for each range and it will be shown in the optional related table.
The experience shows that every financial instrument has its own personality. With this in mind, the script can be useful to study intraday charts with the purpose of discovering recurring behaviours of specific instruments over a certain time range and under specific circumstances (normal days, earnings days, days with catalysts, etc.) This can help the trader to deeply understand the instrument personality, and therefore also to decide whether to enter or exit the market if its behaviour meets or not his expectations.
Please note that this script only works on minute/hourly charts.
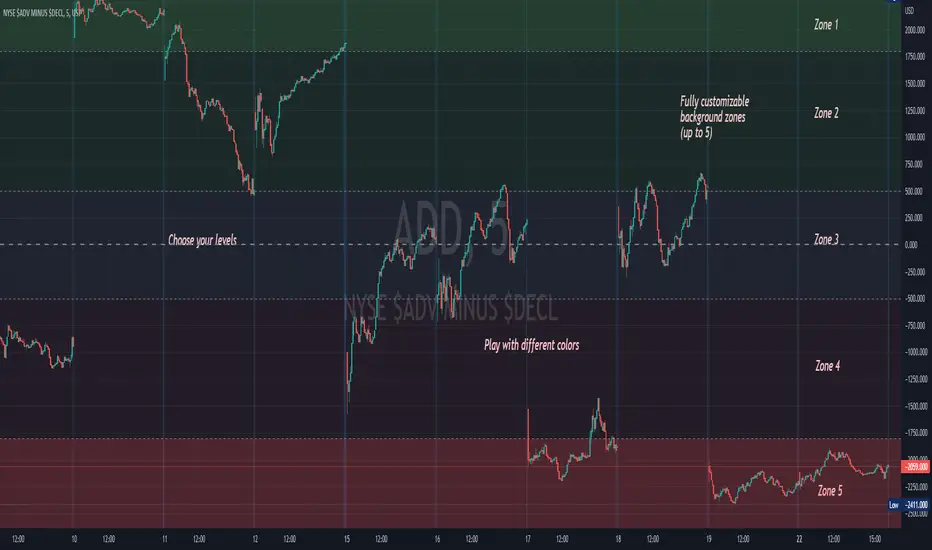
Background ZonesThis script provides up to 5 zones to apply background colors. This is especially useful for applying to indices such as USI:TICK , USI:ADD , and USI:VOLD , where certain levels provides significant meaning to market sentiment and directions. This script will give you the visual cue to help with your trading.
All levels and colors are fully customizable.
Enjoy~!!
Example:
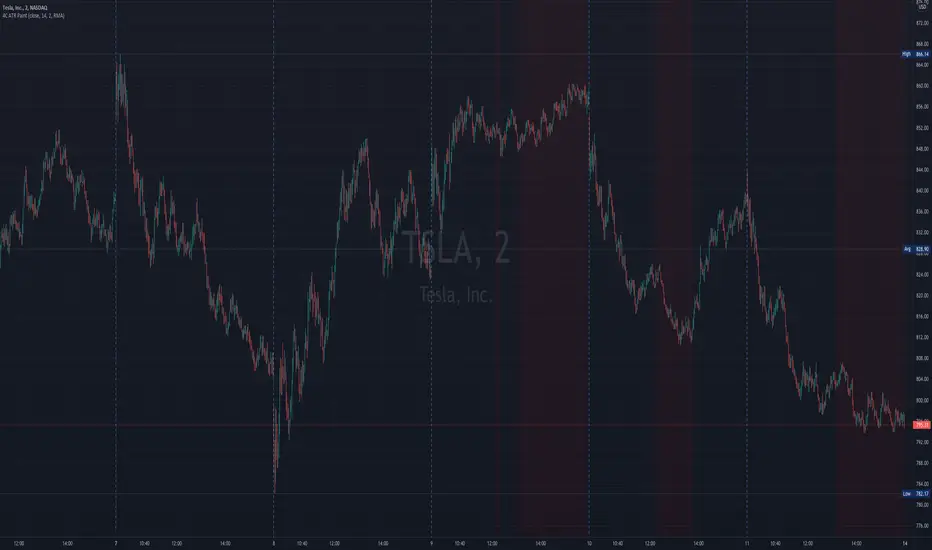
4c ATR ThresholdThe 4C ATR Threshold is a simple indicator that paints the chart background red when the ATR goes below the user defined ATR minimum.
Some trading setups have specific criteria that require a minimum ATR on a certain timeframe for the instrument to be playable.
The painting of the chart background based on the ATR value is useful as a quick visual reference.
The minimum ATR value can be adjusted to any specific level for any timeframe.
If the ATR dips below the user defined minimum, the trader can quickly see that the ATR is below the minimum criteria, and should not trade that instrument (based on their personal trade criteria).
If the background is not painted by the indicator, then the ATR is above the user defined minimum.
Parts of this script used the default/stock Tradingview ATR indicator to build from.
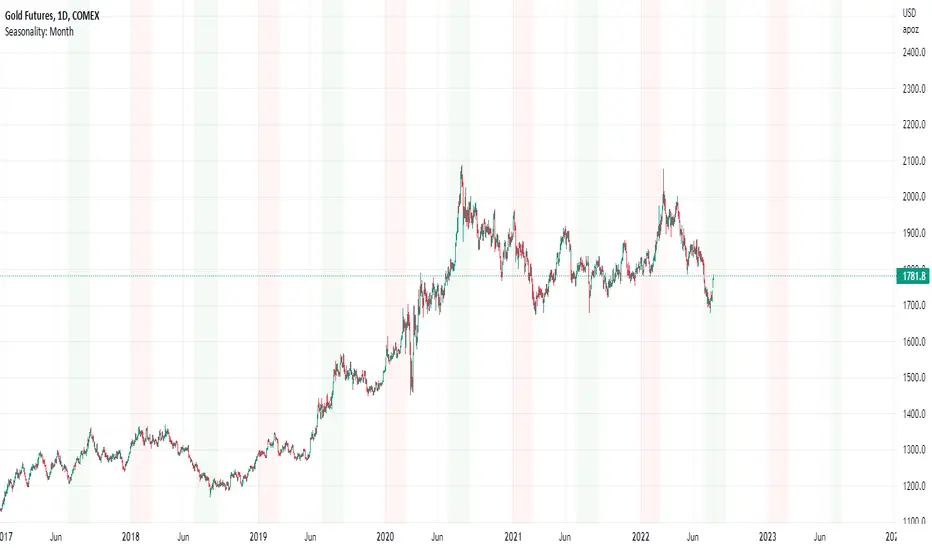
Seasonality: Month HighlightMany Assets, especially Commodities , have patterns of seasonality: Periods in the year when they have shown a greater tendency to rise or a greater tendency to fall.
The Seasonality of an asset is based on historical data (20yrs+): Specific asset seasonality charts can be found via an online search.
This is a simple tool that allows users to highlight and color code each of the 12 months of the year; depending on the seasonality of the specific asset.
The above chart shows Sugar Futures ; which are a seasonal 'sell' in February , and a seasonal 'buy' in May and August.
Seasonality should only be used to compliment a trading setup, NOT as a single reason in itself to buy or sell. Simply put: if you find a good setup, AND you have seasonality on your side; your odds of success are increased.
Day and Time HighlightYet another sweet little tool that highlights only specific days and time.
For example, you can highlight only Tuesday's and Friday's from 0930-1600
You can adjust to any day of the week and any time of the day.
You can request more improvements upon this version. Cheers!
Like if you Like and Follow me for upcoming indicators/strategies: www.tradingview.com

Background Color Based on EMAHello Traders,
this is a very simple script. It paints the background color based on the close price in reference to an exponential moving average.
If the close is above the EMA the background color will be green.
If the close is under the EMA the background color will be red.
You can adjust colors and the EMA period by yourself.
This little indicator script is just to get a better overview, for example in combination with other indicators.
Hope you guys like this script. Wish you a great trading week.

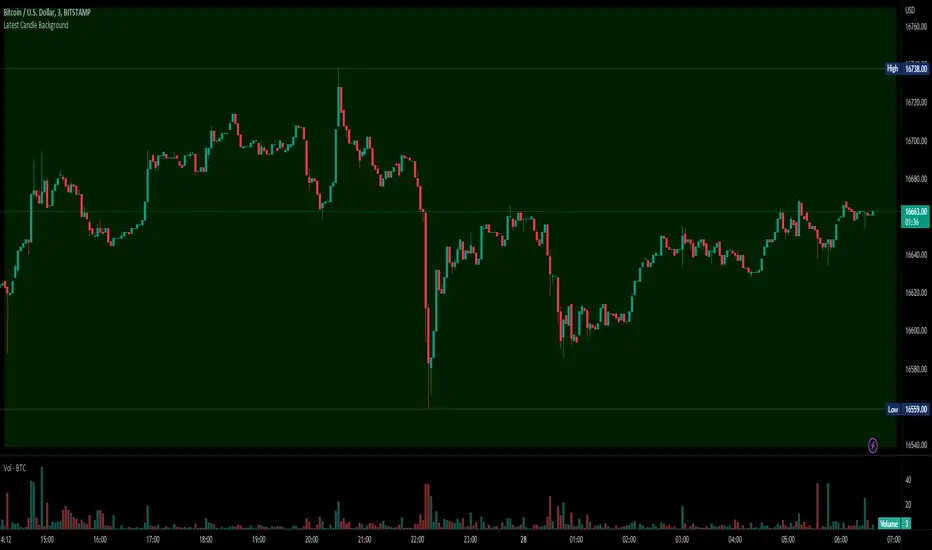
Weekly/Daily/Hourly/Minutes Colored Background IntervalsThis is my "Weekly/Daily/Hourly/Minutes Colored Background Intervals" assistant. I wouldn't describe it as an indicator, it just exhibits coloration of referenced periods of time with bgcolor() in Pine. With the arrival of 2021, I pondered the necessity of needing a visualization pre-2021 to visually recognize periodicity of market movements by the week, day, hour, or an adjustable period of minutes. While this script is simply generic, I hope you may find useful in your endeavors as a member on TradingView.
Explaining the script's usage, the "Minutes" input can be adjusted from anywhere between 5-55 minutes for only intraday. This can be modified to accommodate 90 minutes (1.5hrs) or any other minutes period desirable by tweaking certain numbers up to 1440. Minutes and Hourly backgrounds are disabled by default for most daily traders. Changing the input() code to `true` will provide them on by default when the script loads, if you choose that route. Each time periods background color is enable/disable capable. All of the colors are easily adjustable to any combination you can ponder for your visual acuity with the color swatch provided by input(type=input.color). The coloring can be "swapped" by input() depending on how you wish to start and end the day visually. I thought this would come in handy. The weekly background can have different starting points, whether it be Sunday, Monday, or any other day such as Friday for example.
The entire script's contents isn't intended for complete re-use as is for publicly published scripts. It's more along the lines of code that could be used to personally modify indicators you have, depending on the time frames you may actually be trading on. The code is basically modular, so you can use bits and pieces of it in your personally modified Pine Editor scripts that you wish to customize for yourself. I will say that the isXxx() functions are completely reusable in any script without any need for author permission inquiries from me, as easy as copy and paste. Those may come in handy for many folks. If you find them useful in certain circumstances, use isXxx() functions as you please. Day of the week detection by functions will have applications beyond my current intended use for them.
Of notable mention, this is a miniature lesson by example of how the new input(type=input.color) may be used. I'm also using `var` inside functions to aid in computational efficiency of the script runtime. The colors are permanently stored at the very beginning of the scripts operation inside the function and just reused from that point onward. Its a rare use case, but well suited for this scripts intention. Once again I have demonstrated the "Power of Pine" for developers of any experience level to learn from via code elegance.
When available time provides itself, I will consider your inquiries, thoughts, and concepts presented below in the comments section, should you have any questions or comments regarding this indicator. When my indicators achieve more prevalent use by TV members , I may implement more ideas when they present themselves as worthy additions. Have a profitable future everyone!

NSDT Institution Trading ZoneA simple script that adds background color to highlight the Institutional Trading Hours during the USA market (8am-4pm Eastern). Timeframes and colors can be modified as needed.

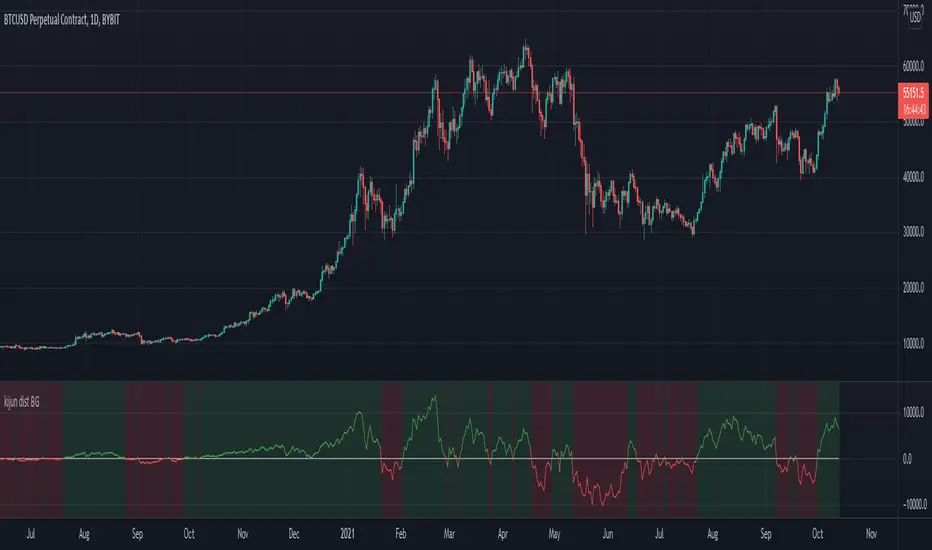
Kijun-Price DistanceThis script shows optional:
- distance between close price and Kijun-Sen
- distance btween Tenkan-Sen and Kijun-Sen
- Background color of current time frame
- Background color of the next higher time frame
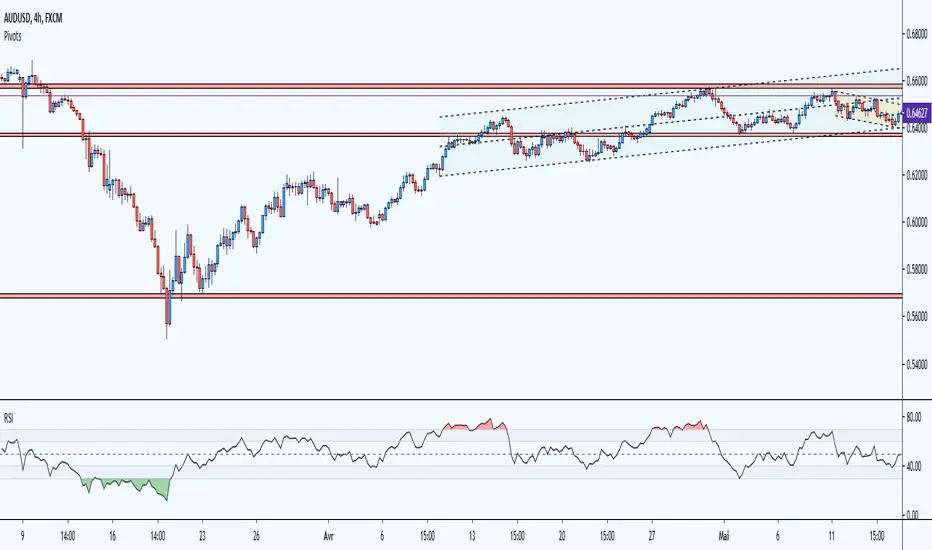
RSI Multicolor editableEN:
RSI with overbought and oversold area in color and editable level. visually more interesting than the basic version the overbought and oversold areas catch the eye quickly. Depending on the strategies and your personal use of the RSI, you can modify all the lines and add colors to each defined zone.
overbought zone, oversold and editable noise zone
I wanted to have a modifiable RSI like some trading platforms.
please excuse me for my english and my code, i'm just getting started.
FR:
RSI avec zone de surachat et survente en couleur et niveau éditable. visuellement plus intéressant que la version basique les zones de surachat et survente attirent l’œil rapidement. Selon les stratégies et l'utilisation personnel que vous faite du RSI, vous pouvez modifier toutes les lignes et ajouter des couleurs à chaque zone défini.
zone de surachat, survente et zone de bruit éditable
je souhaitais avoir un RSI modifiable comme certaines plateforme de trading.
veuillez m'excuser pour mon anglais et mon code, je débute.
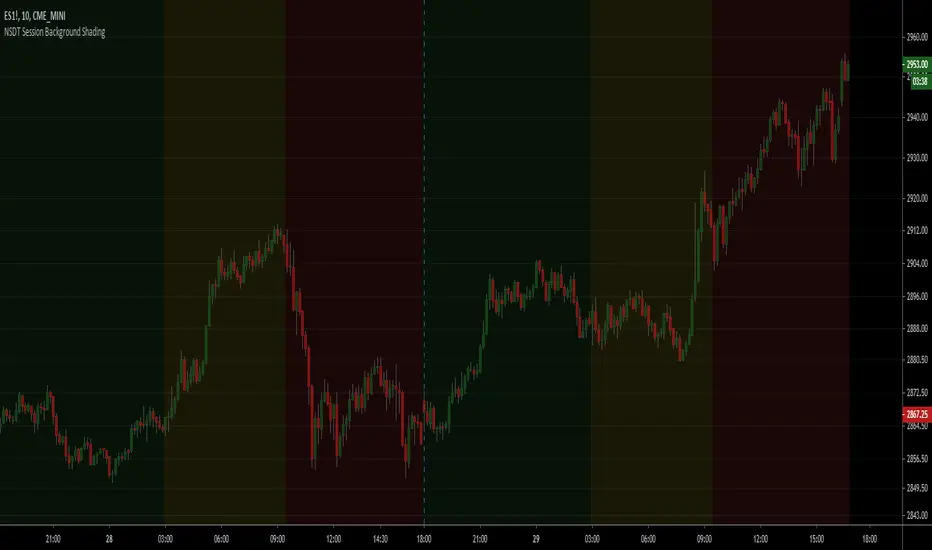
NSDT Session Background ShadingA simple script to add background colors to specific timeframes. Great for trading futures so you can separate sessions for easier viewing. Use for stocks to separate pre, open, and post market times.
There are three timeframes that can be set and all colors can be modified.