Multi BB Heat Vis - SMA/EMA/Breakout - r2I don't expect to iterate any further on this script, unless any weird issue crops up.
Description and usage detailed in the comments at the top of the script. Cheers!
To repaint or not to repaint, all the relevant sources are exposed as inputs for customisation - so the choice is yours.
Cheers!
Bands
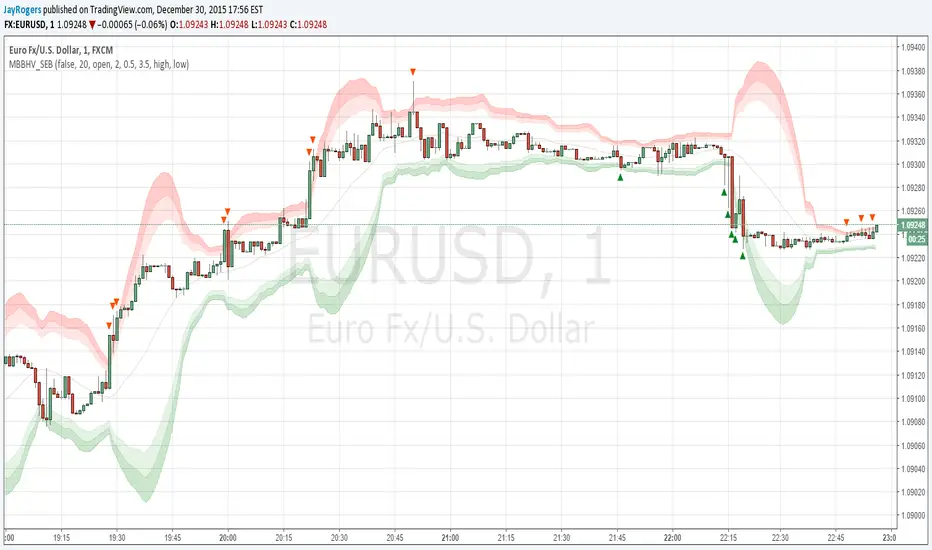
[JR] Multi Bollinger Heat Bands - EMA/Breakout optionsA little, yet hopefully useful update over my previous "Multi Bollinger Heat Bands". For those who like quick visual cue's.
In short: It's your Basic Bollinger Bands, but 3 of them, and some pointy things.
In full:
Three stacked SMA based Bollinger Bands designed just to give you a quick visual on the "heat" of movement.
Set inner band as you would expect, then set your preferred additional multiplier increments for the outer 2 bands.
Option to use EMA as alternative basis, rather than SMA.
Breakout indication shapes, which have their own multiplier (but still tied to same length/period as the BB's) so you can make them pop on their own separate "band".

[JR] Multi Bollinger Heat BandsBollinger Bands, with incremented additional outer bands.
Set as you would normally, but with the addition of an incremental value for the added outer bands.
Defaults with Length 20, base multiplier of 2.0, and an Increment value of 0.5 for additional outer bands at 2.5 and 3.0. Adjust values to suite your needs.
All lines and zones have colour and formatting options available - because why not eh?

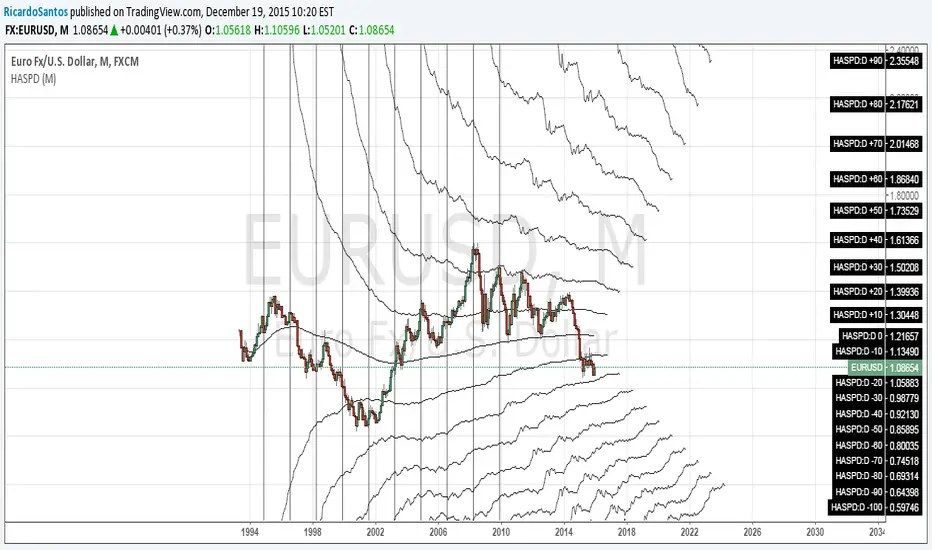
EVWMA Acc/Dist. Pressure & FRACTAL BANDS by @XeL_ArjonaEVWMA ACCUMULATION/DISTRIBUTION PRESSURE & FRACTAL BANDS
Version: 3.0 @ 4.11.2015
By Ricardo M Arjona @XeL_Arjona
DISCLAIMER:
The following indicator IS NOT INTENDED TO BE A FORMAL INVESTMENT ADVICE OR TRADING RECOMMENDATION BY THE AUTHOR, nor should be construed as such. Users will be fully responsible by their use regarding any kind of trading vehicles or assets.
The following script and ideas within this work are FREELY AND PUBLICLY availables on the Web for NON LUCRATIVE ACTIVITIES and must remain as is.
-== IMPORTANT: THIS IS AN EXPERIMENTAL INDICATOR ==-
What is this?
This work is a derivation of my previous Accumulation/Distribution scripts publicly available in TradingView in an effort to clean, speedup and make the indicator cleaner as possible.
The current indicator is based on already tested and Mathematically proof concepts as described below:
The MAIN Rolling back median line or "Vortex" is constructed by a simple and equal weighting of distributed volume along the candle range (This approach is just an "estimator" of Buyers Vs. Sellers given the lack of tick resolution in TradingView, a real "DELTA" can only be 100% reliable with Market Depth (Ask/Bid ticks)), Given this, with each "volume weights", the price is post-processed against a true statistical Average calculation formerly: ELASTIC VOLUME WEIGHTED MOVING AVERAGE.
The FRACTAL BANDS are just Standard Deviation's with GOLDEN RATIO as multiplier (1.618) derived one from each other within it's origin on the former "Vortex Median".
The Standard Error Bands comply as the original indicator described by Jon Andersen but given the true statistical nature of EVWMA, the original LinReg line has been substituted by the former.
ALL NEW IDEAS OR MODIFICATIONS to this indicator are welcome in favor to deploy a better technical tool. Any important addition to this work MUST REMAIN PUBLIC by means of CreativeCommons CC & TradingView user rules. (C) 2015 @XeL_Arjona
Standard Error Bands by @XeL_arjonaStandard Error Bands - Code by @XeL_arjona
Original implementation by:
Traders issue: Stocks & Commodities V. 14:9 (375-379):
Standard Error Bands by Jon Andersen
Version 1
For a quick and publicly open explanation of this Statistical indicator, you can refer at Here!
Extract from the former URL:
Standard Error bands are quite different than Bollinger's. First, they are bands constructed around a linear regression curve. Second, the bands are based on two standard errors above and below this regression line. The error bands measure the standard error of the estimate around the linear regression line. Therefore, as a price series follows the course of the regression line the bands will narrow, showing little error in the estimate. As the market gets noisy and random, the error will be greater resulting in wider bands.

Stochastic In BandsWhat about to display Stochastic Oscilator in EMA-ATR Bands? If you like the idea I would code advanced version

[RS]Linear Regression Bands V2EXPERIMENTAL:
added titles to inputs and plots for better understanding what is what(DCC)
M = middle, T = top, B = bottom, S = signal.

MA_FibBand_MTFMoving average of High, Low & Close with Fibonacci bands calculated from the average high and low. Four upper levels are to the power of 1.618, 2.618, 3.618 & 4.618. Four lower levels are to the power of 0.618, 1.618, 2.618 & 3.618. Included are a choice of time frames either current, semi-custom or fully custom allowing freedom to set any period you like which makes it great for historical averages. Adapted and expanded from Clarke Moody's MA_MTF i have tidied the script and included all CM's formulas although should be used in SMA or EMA i kept the other MA formulas for curiosity.
My preferred usage is to stick with 20ma and adjust the legnth of the period. Shown here is 20ema of 10day period.
More information can be learnt from 'endlessmountain' on youtube but only the very top and bottom levels are used with the High, Low & Close. Also i am not aware if this originates from any other source.
Thankyou to Clarke Moody and endlessmountain. Hope you like this tool.


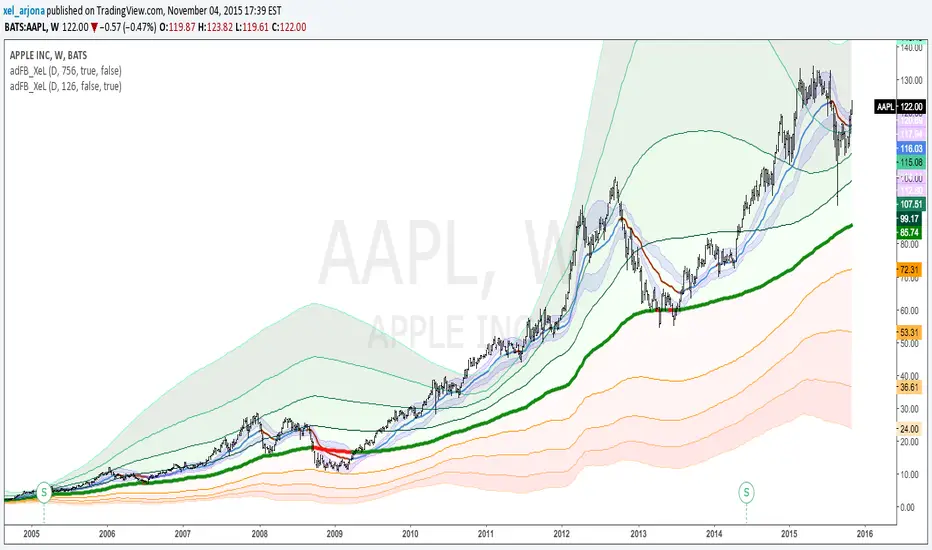
Acc/Dist. Cloud with Fractal Deviation Bands by @XeL_ArjonaACCUMULATION / DISTRIBUTION CLOUD with MORPHIC DEVIATION BANDS
Ver. 2.0.beta.23:08:2015
by Ricardo M. Arjona @XeL_Arjona
DISCLAIMER
The Following indicator/code IS NOT intended to be a formal investment advice or recommendation by the author, nor should be construed as such. Users will be fully responsible by their use regarding their own trading vehicles/assets.
The embedded code and ideas within this work are FREELY AND PUBLICLY available on the Web for NON LUCRATIVE ACTIVITIES and must remain as is.
Pine Script code MOD's and adaptations by @XeL_Arjona with special mention in regard of:
Buy (Bull) and Sell (Bear) "Power Balance Algorithm by Vadim Gimelfarb published at Stocks & Commodities V. 21:10 (68-72).
Custom Weighting Coefficient for Exponential Moving Average (nEMA) adaptation work by @XeL_Arjona with contribution help from @RicardoSantos at TradingView @pinescript chat room.
Morphic Numbers (PHI & Plastic) Pine Script adaptation from it's algebraic generation formulas by @XeL_Arjona
Fractal Deviation Bands idea by @XeL_Arjona
CHANGE LOG:
ACCUMULATION / DISTRIBUTION CLOUD: I decided to change it's name from the Buy to Sell Pressure. The code is essentially the same as older versions and they are the center core (VORTEX?) of all derived New stuff which are:
MORPHIC NUMBERS: The "Golden Ratio" expressed by the result of the constant "PHI" and the newer and same in characteristics "Plastic Number" expressed as "PN". For more information about this regard take a look at: HERE!
CUSTOM(K) EXPONENTIAL MOVING AVERAGE: Some code has cleaned from last version to include as custom function the nEMA , which use an additional input (K) to customise the way the "exponentially" is weighted from the custom array. For the purpose of this indicator, I implement a volatility algorithm using the Average True Range of last 9 periods multiplied by the morphic number used in the fractal study. (Golden Ratio as default) The result is very similar in response to classic EMA but tend to accelerate or decelerate much more responsive with wider bars presented in trending average.
FRACTAL DEVIATION BANDS: The main idea is based on the so useful Standard Deviation process to create Bands in favor of a multiplier (As John Bollinger used in it's own bands) from a custom array, in which for this case is the "Volume Pressure Moving Average" as the main Vortex for the "Fractallitly", so then apply as many "Child bands" using the older one as the new calculation array using the same morphic constant as multiplier (Like Fibonacci but with other approach rather than %ratios). Results are AWSOME! Market tend to accelerate or decelerate their Trend in favor of a Fractal approach. This bands try to catch them, so please experiment and feedback me your own observations.
EXTERNAL TICKER FOR VOLUME DATA: I Added a way to input volume data for this kind of study from external tickers. This is just a quicky-hack given that currently TradingView is not adding Volume to their Indexes so; maybe this is temporary by now. It seems that this part of the code is conflicting with intraday timeframes, so You are advised.
This CODE is versioned as BETA FOR TESTING PROPOSES. By now TradingView Admins are changing lot's of things internally, so maybe this could conflict with correct rendering of this study with special tickers or timeframes. I will try to code by itself just the core parts of this study in order to use them at discretion in other areas. ALL NEW IDEAS OR MODIFICATIONS to these indicator(s) are Welcome in favor to deploy a better and more accurate readings. I will be very glad to be notified at Twitter or TradingView accounts at: @XeL_Arjona

Bollinger Band TouchThis script simply colors the background when price hits or exceeds the bollinger bands. Just a nice visual cue.

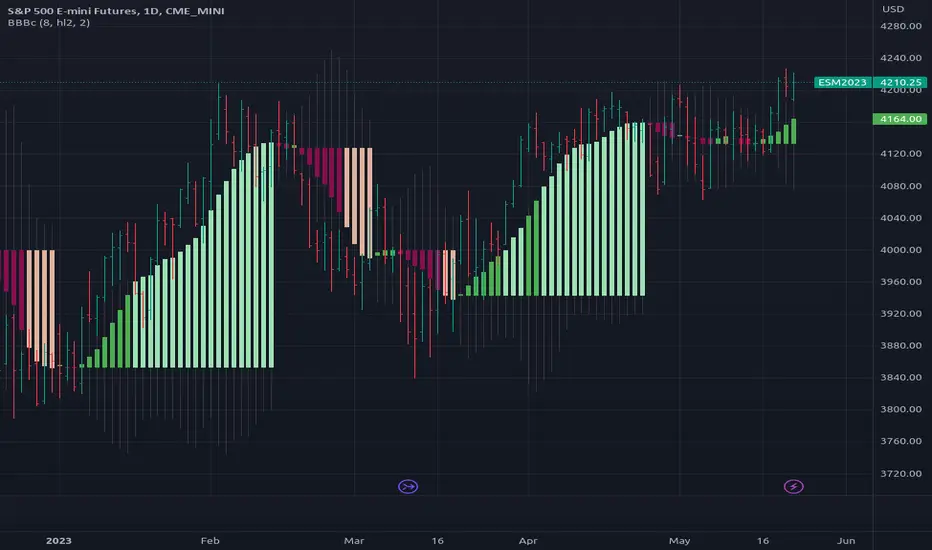
[RS]Bollinger Bands Breakout Candles V0EXPERIMENTAL: a experiment using bollingers and directional momentum, Breakout detector.
[RS]Linear Regression Bands V1experiment with linear regression, the purpose was to catch break outs early, but it creates to much visual noise
same as version 0 but with added margin filter and signal to mark entrys

Yacine EMA Bands V2Version 2, because of popular demand.
Default values are weekly.
Feel free to try other configurations.

Variable Moving Average Bands [LazyBear]VMA Bands are ATR bands with VMA as its centre. For a description of options, refer to my VMA post:
I have moved VMA calculation in to a separate function. Feel free to use calc_vma() in your scripts. For more MA calculation function (KAMA, VIDYA and others), refer to my complete list of indicators below.
Wish you all a very prosperous New year. Hope these indicators make you all more money this year too :)
List of my other indicators:
- GDoc: docs.google.com
- Chart:

Historical Volatility based Standard Deviation_V2This Plots the Standard Deviation Price Band based on the Historical Volatility. SD 1, 2, 3.
Version update:
Fixed the Standard Deviation mistake on Version 1.
Added Smoothing Options for those who prefer a less choppy version.
Standard Deviation 3 plot is not set to Default

UCSgears_Transaction Valuation IndexThis is an indicator, That works great in a wip-saw market range. Would not use this to trade in a breakout.
I am calling it the "Transaction Value Index (UCS_TVI)", The reason is because, it measure where the price currently from the mean trade value.
The cross represents the highest trade value on that day, circle represents the lowest trade value.
In other words, Top and bottom of the candle wicks, in relation to the mean trade value (MTV).
Watchout for Further Updates on Optimizing this indicator.
DO NOT CONFUSE IT WITH FUNDAMENTAL VALUATION, THIS IS PURELY TECHNICAL VALUATION TECHNIQUE
As Usual, Good Luck
List of All my Indicators - www.tradingview.com

UCS_Value BandsThis Indicator is yet another variation of KC. Inspired from Value Charts webinar. I have seen their videos on youtube. What appears to be a variation of KC.
They use 12 bands Showing the zone, and different MA for different timeframes.
You can get this indicator close to accuracy by changing the inputs (ATR) and (Deviations)
This also can be used with the triple ATR setup - Change the values to EMA to desired value. To obtain the First band to plot @ 1, Change the Band deviation to 0.25.
Also can be used as as the Acceleration Band. With Current Settings, the Third Band will plot the Acceleration band.
List of All my Indicators - www.tradingview.com
Lycka Till

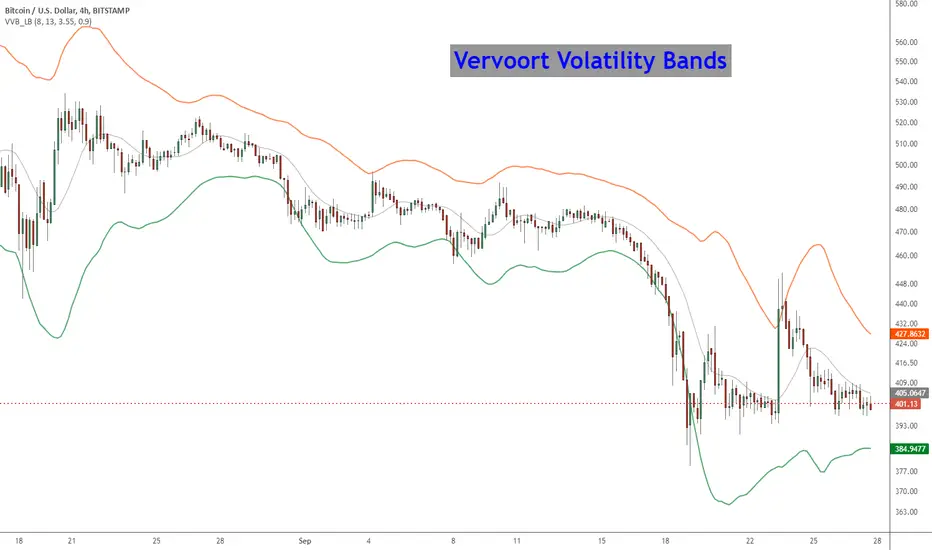
Vervoort Volatility Bands [LazyBear]This is Mr. Vervoort's take on volatility bands. Sticking to his style, he uses highly smoothed data everywhere, also improves on the way the bands are calculated. Is this better than others? I will let you guys decide :)
More info:
www.traders.com
List of my other indicators:
- Chart:
- GDoc: docs.google.com
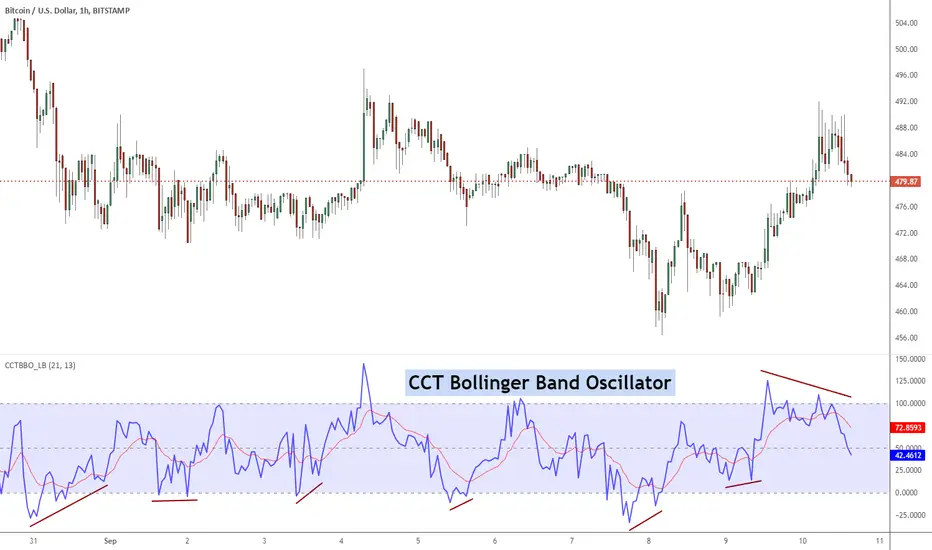
CCT Bollinger Band OscillatorThe CCT Bollinger Band Oscillator (CCTBO), developed by Steve Karnish of Cedar Creek Trading, reconfigures John Bollinger's classic Bollinger Bands (envelopes plotted at two Standard Deviations above and below a moving average) by drawing two parallel lines replacing the envelopes. The parallel lines represent a measurement of two Standard Deviations from the mean and are assigned a value of zero and 100 on the chart.
The indicator represents the price as it travels above and below the mean (50%) and outside the two standard deviations (zero and 100). Penetration of the upper band represents overbought conditions while penetration of the lower band signifies oversold conditions. Usage of the CCT Bollinger Band Oscillator to identify 'failure swings' and 'divergences' can lead to significant reversals.
List of my other indicators:
- Chart:
- GDoc: docs.google.com
vdubongCustom script I fabricated which I use for Binary Trading on the 1m & 3m charts together with Price action & Time management but the principles are the same for all mediums. Use Price action buy/sell in the clear zones. Use the outer 'pink' horizontal lines (highs / lows / pivots points) to place SL's.
I personally run an additional BB 50/2 for clearer BB higher highs & lower low perspective, but it's not part of the script. Script variables are fully customisable.
I don't take ownership of any part of the script, I not a programmer /script writer just a dabbler. Enjoy :) - VDUBONG UPDATED
