Dynamic Length RSI (DRSI)Dynamic Length RSI (DRSI)
This indicator is an advanced tool that seeks to improve the sensitivity and adaptability of the traditional Relative Strength Index (RSI).
Its main feature is that it uses a variable length calculation instead of a fixed length (like the standard 14), automatically adjusting to market volatility conditions. The length used to calculate the RSI dynamically adjusts between a predefined minimum and maximum, based on volatility (ATR).
The change in length is indicated by the candlestick background. Gray candles represent ascending Dyn (weakness/consolidation/declining volatility), blue or white candles represent descending Dyn (strength, trend, rising volatility).
Bande e canali

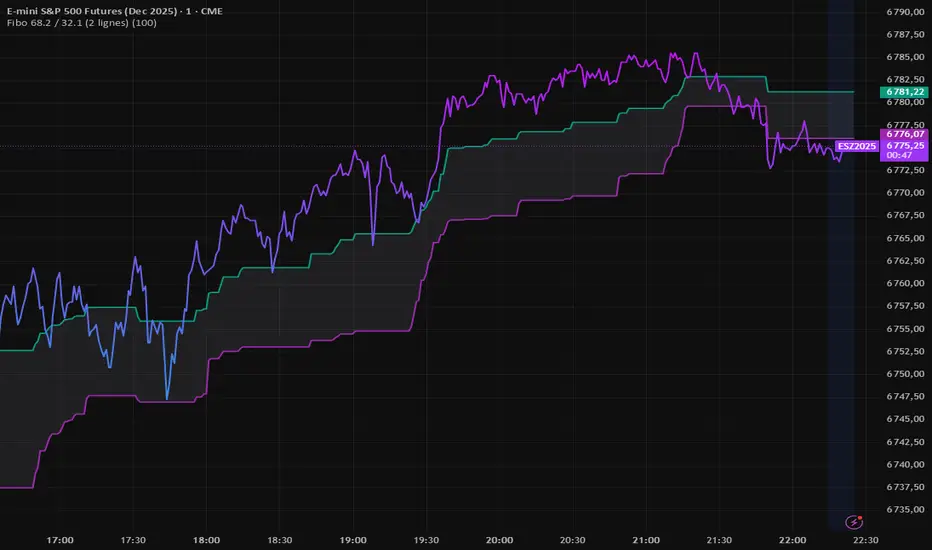
Fibo 68.2 / 32.1 (2 lignes)FIBO indicator that automatically plots two retracement lines (38.2 and 61.8).
Darvas Lines/Box1. Overview
The Darvas Lines/Box (v1.0) is a dynamic trend following indicator based on the renowned method developed by Nicolas Darvas. It's designed to identify clear price consolidation ranges and detect decisive breakouts, crucial for positional and swing trading strategies.
This indicator automatically draws and adjusts the consolidation ranges, and includes modern enhancements such as Advanced Retest Confirmation and exposed alert conditions, providing reliable signals for monitoring and acting on trend continuations.
2. Core Features
Custom Display Mode (Lines/Box): Allows the user to toggle the visualization between showing just the Breakout Lines (Lines) or displaying the consolidation area with a filled background box (Box).
Source Selection (Wicks/Body): Users can choose whether the box boundaries are defined by the candlestick wicks (price extremes) or the candlestick body (open/close price). This feature is critical for adjusting sensitivity to market noise.
Dynamic Box Drawing: Draws Darvas boxes automatically by tracking price highs and lows based on user-defined parameters (Bars to Define Range, Max Box Height).
Retest Confirmation: Detects if the old resistance/support line functions effectively after a breakout. When a retest is confirmed, the line is extended and its color changes.
Price Labels (Stable Lock): Displays the highest and lowest box prices, fixed to the left outer edge of the box. This ensures stable visibility.
Progress Labels: Visualizes the current line price and the percentage distance to the closing price on the right side of the box, showing progress toward the next breakout.
3. Trading Strategy: How to Use the Indicator
This indicator is primarily used to identify trend initiation and trend continuation signals.
A. Entry Strategy (Breakout)
Long Entry Action: Consider taking a long entry when the price closes above the Upper Line (Green Line), signaled by a BULLISH BREAKOUT alert.
Signal: Use the BULLISH BREAKOUT alert.
Short Entry Action: Consider taking a short entry when the price closes below the Lower Line (Red Line), signaled by a BEARISH BREAKOUT alert.
Signal: Use the BEARISH BREAKOUT alert.
B. Retest Strategy (Add-on/Confirmation)
Action: When the price pulls back to touch the broken line (signaled by RETEST CONFIRMED), this confirms the break's validity.
Alert: The RETEST CONFIRMED alert is triggered at this moment.
C. Risk Management (General)
Stop Loss: The initial stop-loss is typically set just beyond the opposite side of the broken box. As the trend progresses and new boxes form, the lower boundary of the most recently formed box can be used as a trailing stop for managing risk.
4. Setting Parameters
Line Source (Wicks/Body): Crucial for sensitivity. 'Wicks' tracks price extremes; 'Body' tracks stronger close-to-close movements, ignoring noise.
Bars to Define Range: Defines the calculation period (in bars) for the box.
Cooldown Bars After Breakout: Sets the waiting period after a breakout before a new box can start forming.
Retest Lookback Bars (Phase 3): Sets the maximum number of bars to check for a retest during the cooldown phase.
Max Gap for Retest (%): Defines the maximum percentage distance from the line allowed to confirm a retest (Set to Zero (0.0%) for near-touch detection).
Alert Frequency (Breakout): Allows selection between Continuous and Once per Box for breakout signals.
5. Alerts: How to Set Up the Triggers
This indicator exposes several specific conditions to the TradingView alert panel, allowing you to select the exact event you want to monitor.
Step-by-Step Alert Setup:
Open the Alert Panel on the chart.
In the Condition field, select the indicator's name.
In the Alert Condition field, choose the specific event you want to monitor:
1. ANY DARVAS EVENT (Consolidated)
2. BULLISH BREAKOUT (Individual)
3. BEARISH BREAKOUT (Individual)
4. RETEST CONFIRMED (Individual)
In the Trigger field (Frequency), select your preferred native option (e.g., "Once Per Bar Close" or "Once per bar").

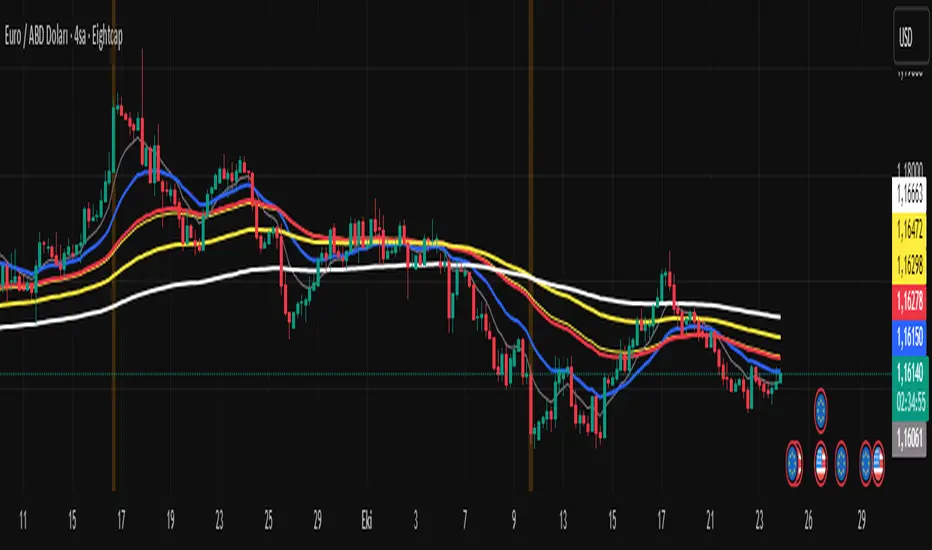
Multi-Timeframe EMA (5 Configurable)Here's a comprehensive description you can use for your indicator:
Multi-Timeframe EMA Indicator (5 Configurable Slots)
Description
This indicator displays up to 5 Exponential Moving Averages (EMAs) from different timeframes simultaneously on a single chart. Perfect for multi-timeframe analysis, it allows traders to visualize key EMAs from intraday to higher timeframes without switching charts.
Key Features
5 Independent EMA Slots: Each slot can be configured with its own timeframe, EMA length, and color
Flexible Configuration: Mix any timeframes and EMA lengths (e.g., 1m EMA 50, 15m EMA 200, 4h EMA 100)
Smart Label Formatting: Automatically displays timeframes in readable format (minutes, hours, or days)
Optional Data Table: Toggle a compact table showing EMA values and price distance percentages
Individual Toggle Controls: Enable/disable each EMA independently without losing settings
Customizable Styling: Adjust colors and line width to match your chart theme
Default Configuration
EMA 1: 1-minute timeframe, EMA 200 (Red)
EMA 2: 5-minute timeframe, EMA 200 (Purple)
EMA 3: 15-minute timeframe, EMA 200 (Yellow)
EMA 4: 1-hour timeframe, EMA 200 (Blue)
EMA 5: 4-hour timeframe, EMA 200 (Orange)
How to Use
Add the indicator to any chart
Configure each EMA slot in the settings:
Timeframe: Choose from 1m, 5m, 15m, 1h, 4h, D, W, M, or custom
Length: Set the EMA period (default 200)
Color: Select a color for easy identification
Enable "Show Line Labels" to see EMA identifiers on the right side
Enable "Show Values Table" for a detailed view of current values and distances
Use Cases
Trend Analysis: Identify alignment across multiple timeframes
Support/Resistance: Use higher timeframe EMAs as dynamic S/R levels
Entry/Exit Timing: Enter on lower timeframe signals near higher timeframe EMAs
Multi-Timeframe Confirmation: Validate setups when price is above/below key EMAs
Scalping: Monitor 1m/5m EMAs while respecting 1h/4h trend direction
Tips
All EMAs update in real-time and move with the chart
Use contrasting colors for easier visual distinction
Disable unused slots to declutter your chart
The table shows percentage distance from current price to each EMA
Works on any symbol and any chart timeframe

Fiyat - 55 EMA Uzaklık SinyaliThis indicator generates a signal when the price moves a certain percentage away from the 55-period Exponential Moving Average (EMA).
It helps traders identify when the market is stretched too far from its mean level, which can indicate potential reversal or continuation zones.
⚙️ How It Works
Calculates the 55 EMA on the selected chart.
Measures the percentage distance between the current price and the 55 EMA.
When the price distance exceeds the user-defined threshold (default: 0.50%), a visual signal (orange triangle) appears on the chart.
The background also highlights the signal candle.
🧩 Inputs
EMA Length: Default = 55 (can be changed).
Distance Threshold (%): Default = 0.50 → Change to detect stronger or weaker price deviations.
Blue Dot Red DotInspired by Dr Wish
This script is a confluence indicator designed to identify potential trend reversals or "mean reversion" trade setups. It plots buy (blue) and sell (red) dots directly on your price chart.
The core strategy is to find moments where price is overextended (using Bollinger Bands) and momentum is simultaneously reversing (using the Stochastic Oscillator). A signal is only generated when both of these conditions are met.
Core Components
The script combines two classic technical indicators:
Bollinger Bands (BB):
These create a "channel" around the price based on a simple moving average (the basis) and a standard deviation (dev).
Upper Band: Basis + (2.0 * StdDev)
Lower Band: Basis - (2.0 * StdDev)
In this script, the bands are used to identify when the price has moved significantly far from its recent average, suggesting it's "overbought" (at the upper band) or "oversold" (at the lower band) and may be due for a pullback.
Stochastic Oscillator:
This is a momentum oscillator that compares a closing price to its price range over a certain period.
It consists of two lines: %K (the main, faster line) and %D (a moving average of %K, the slower signal line).
It's used to identify overbought and oversold momentum conditions and, more importantly, momentum shifts, which are signaled by the %K and %D lines crossing.
Signal Logic: How the Dots Are Generated
This script's "secret sauce" is that it demands three specific conditions to be true at the same time before plotting a dot.
🔵 Blue Dot (Buy Signal)
A blue dot will appear below a price bar if all three of these conditions are met:
Stochastic Crossover: The faster %K line crosses above the slower %D line (ta.crossover(k, d)). This signals that short-term momentum is starting to turn bullish.
Was Oversold: On the previous bar, the %K line was below the "Oversold Threshold" (was_oversold = k < oversold). This ensures the bullish crossover is happening from an oversold (or at least bearish) momentum state.
Note: The default oversold threshold is set to 50. This is a key detail. It means the script is looking for a bullish crossover that originates from anywhere in the bottom half of the Stochastic range, not just the traditional "extreme" oversold area (like 20).
Price Extension: Within the last 3 bars (the current bar or the two before it), the price's low must have touched or gone below the lower Bollinger Band (bb_touch_lower). This confirms that the price itself is in an "oversold" or overextended area.
In plain English: A blue dot appears when the price has recently dipped to an extreme low (touching the lower BB) and its underlying momentum has just started to turn back up (Stoch cross from the lower half).
🔴 Red Dot (Sell Signal)
A red dot will appear above a price bar if all three of these conditions are met:
Stochastic Crossunder: The faster %K line crosses below the slower %D line (ta.crossunder(k, d)). This signals that short-term momentum is starting to turn bearish.
Was Overbought: On the previous bar, the %K line was above the "Overbought Threshold" (was_overbought = k > overbought). The default for this is 80, which is a traditional overbought level.
Price Extension: Within the last 3 bars (the current bar or the two before it), the price's high must have touched or gone above the upper Bollinger Band (bb_touch_upper). This confirms that the price itself is in an "overbought" or overextended area.
A red dot appears when the price has recently spiked to an extreme high (touching the upper BB) and its underlying momentum has just started to roll over and turn back down (Stoch cross from the overbought zone).

JOPA Channel (Dual-Volumed) v1 [JopAlgo]JOPA Channel (Dual-Volumed) v1
Short title: JOPAV1 • License: MPL-2.0 • Provider: JopAlgo
We have developed our own, first channel-based trading indicator and we’re making it available to all traders. The goal was a channel that breathes with the tape—built on a volume-weighted backbone—so the outcome stays lively instead of static. That led to the JOPA Channel.
All important features (at a glance)
In one line: A Rolling-VWAP channel whose width adapts with two volumes (RVOL + dollar-flow), adds order-flow asymmetry (OBV tilt) and regime awareness (Efficiency Ratio), and frames risk with outer containment bands from residual extremes—so you see fair value, momentum, and exhaustion in one view.
Feature list
Rolling VWAP centerline: Tracks where volume traded (fair value).
Dual-volume width: Bands expand/contract with relative volume and value traded (price×volume).
OBV tilt: Upper/lower widths skew toward the side actually pushing.
Regime adapter (ER): Tighter in trend, wider in chop—automatically.
Outer containment rails: Residual-extreme ceilings/floors, smoothed + margin.
20% / 80% guides: 20% light blue (discount), 80% light red (premium).
Squeeze dots (optional): Orange circles below candles during compression.
Non-repainting: Uses rolling sums and past-only math; no lookahead.
Default visual in this release
Containment rails + fill: ON (stepline, medium).
Inner Value rails + fill: Rails OFF (stepline, thin), fill ON (drawn only if rails are shown).
20% & 80% guides: ON (dashed, thin; 20% light blue, 80% light red).
Squeeze dots: OFF by default (orange circles when enabled).
What you see on the chart
RVWAP (centerline): Your compass for fair value.
Inner Value Bands (optional): Tight rails for breakouts and pullback timing.
Outer Containment Bands (default ON): High-confidence ceilings/floors for targets and fades.
20% / 80% guides: Quick read of “where in the channel” price is sitting.
Squeeze dots (optional): Volatility compression heads-up (no text labels).
Non-repainting note: The indicator does not revise closed bars. Forecast-Lock uses linear regression to extrapolate 1–3 bars ahead without using future data.
How to use it
Core reads (works on any timeframe)
Bias: Above a rising RVWAP → long bias; below a falling RVWAP → short bias.
Breakouts (momentum): Close beyond an Inner Value rail with RVOL ≥ threshold (alert provided).
Reversions (fades): Tag Outer Containment, stall, then close back inside → expect mean reversion toward RVWAP.
20/80 timing:
At/above 80% (light red) → premium/exhaustion risk; trim longs or consider fades if RVOL cools.
At/below 20% (light blue) → discount/exhaustion risk; trim shorts or consider longs if RVOL cools.
Squeeze clusters: When dots bunch up, expect a range break; use the Breakout alert as confirmation.
Playbooks by trading style
Day Trading (1–5m)
Setup: Keep the chart clean (Containment ON, Value rails OFF). Toggle Inner Value ON when hunting a breakout or timing a pullback.
Pullback Long: Dip to RVWAP / Lower Value with sub-threshold RVOL, then a close back above RVWAP → long.
Stop: Just beyond Lower Containment or the pullback swing.
Targets (1:1:1): ⅓ at RVWAP, ⅓ at Upper Value, ⅓ trail toward Upper Containment.
Breakout Long: After a squeeze cluster, take the Breakout Long alert (close > Upper Value, RVOL ≥ min). If no retest, demand the next bar holds outside.
Range Fade: Only when RVWAP is flat and dots cluster; short Upper Containment → RVWAP (mirror for longs at the lower rail).
Intraday (15m–1H)
HTF compass: Take bias from 4H.
Pullback Long: “Touch & reclaim” of RVWAP while RVOL cools; enter on the reclaim close or break of that candle’s high.
Breakout: Run Inner Value ON; act on Breakout alerts (RVOL gate ≈ 1.10–1.15 typical).
Avoid low-probability fades against the 4H slope unless RVWAP is flat.
Swing (4H–1D)
Continuation: In uptrends, buy pullbacks to RVWAP / Lower Value with sub-threshold RVOL; scale at Upper Containment.
Adds: Post-squeeze Breakout Long adds; trail on RVWAP or Lower Value.
Fades: Prefer when RVWAP flattens and price oscillates between containments.
Position (1D+)
Framework: Daily RVWAP slope + position within containment.
Add rule: Each reclaim of RVWAP after a dip is an add; trim into Upper Containment or near 80% light red.
Sizing: Containment distance is larger—size down and trail on RVWAP.
Inputs & Settings (complete)
Core
Source: Price input for RVWAP.
Rolling VWAP Length: Window of the centerline (higher = smoother).
Volume Baseline (RVOL): SMA window for relative volume.
Inner Value Bands (volatility-based width)
k·StdDev(residuals), k·ATR, k·MAD(residuals): Blend three measures into base width.
StdDev / ATR / MAD Lengths: Lookbacks for each.
Two-Volume Fusion
RVOL Exponent: How aggressively width responds to relative volume.
Dollar-Flow Gain: Adds push from price×volume (value traded).
Dollar-Flow Z-Window: Standardization window for dollar-flow.
Asymmetry (Order-Flow Tilt)
Enable Tilt (OBV): Lets flow skew upper/lower widths.
Tilt Strength (0..1): Gain applied to OBV slope z-score.
OBV Slope Z-Window: Window to standardize OBV slope.
Regime Adapter
Efficiency Ratio Lookback: Measures trend vs chop.
ER Width Min/Max: Maps ER into a width factor (tighter in trend, wider in chop).
Band Tracking (inner value rails)
Tracking Mode:
Base: Pure base rails.
Parallel-Lock: Smooth RVWAP & width; track in parallel.
Slope-Lock: Adds a fraction of recent slope (momentum-friendly).
Forecast-Lock: 1–3 bar extrapolation via linreg (non-repainting on closed bars).
Attach Strength (0..1): Blend tracked rails vs base rails.
Tracking Smooth Length: EMA smoothing of RVWAP and width.
Slope Influence / Forecast Lead Bars: Gains for the chosen mode.
Outer Containment Bands
Show Containment Bands: Master toggle (default ON).
Residual Extremes Lookback: Highest/lowest residual window.
Extreme Smoothing (EMA): Stability on extreme lines.
Margin vs inner width: Extra padding relative to smoothed inner width.
Squeeze & Alerts
Squeeze Window / Threshold: Width vs average; at/under threshold = dot (when enabled).
Min RVOL for Breakout: Required RVOL for breakout alerts.
Style (defaults in this release)
Inner Value rails: OFF (stepline, thin).
Inner & Containment fills: ON.
Containment rails: ON (stepline, medium).
20% / 80% guides: ON — 20% light blue, 80% light red, dashed, thin.
Squeeze dots: OFF by default (orange circles below candles when enabled).
Practical templates (copy/paste into a plan)
Momentum Breakout
Context: Squeeze cluster near RVWAP; Inner Value ON.
Trigger: Breakout Long (close > Upper Value & RVOL ≥ min).
Stop: Below Lower Value (tight) or below RVWAP (safer).
Targets (1:1:1): ⅓ Value → ⅓ Containment → ⅓ trail on RVWAP.
Pullback Continuation
Context: Uptrend; dip to RVWAP / Lower Value with cooling RVOL.
Trigger: Close back above RVWAP or break of reclaim candle’s high.
Stop: Just outside Lower Containment or pullback swing.
Targets: RVWAP → Upper Value → Upper Containment.
Containment Reversion (range)
Context: RVWAP flat; repeated containment tags.
Trigger: Stall at containment, then close back inside.
Stop: A step beyond that containment.
Target: RVWAP; runner only if RVOL stays muted.
Alerts included
DVWAP Breakout Long / Short (Value Bands)
Top Zone / Bottom Zone (20% / 80% guides)
Tip: On lower TFs, act on Breakout alerts with higher-TF bias (e.g., trade 5–15m in the direction of 1H/4H RVWAP slope/position).
Best practices
Let RVWAP be the compass; if unsure, wait until price picks a side.
Respect RVOL; low-RVOL breaks are prone to fail.
Use guides for timing, not certainty. Pair 20/80 zones with flow context.
Start with defaults; change one knob at a time.
Common pitfalls
Fading every containment touch → only fade when RVWAP is flat or RVOL cools.
Over-tuning inputs → the defaults are robust; small tweaks go a long way.
Fighting the higher timeframe on low TFs → expensive habit.
Footer — License & Publishing
License: Mozilla Public License 2.0 (MPL-2.0). You may modify and redistribute; keep this file under MPL and provide source for this file.
Originality: © 2025 JopAlgo. No third-party code reused; Pine built-ins and common formulas only.
Publishing: Keep this header/description intact when releasing on TradingView. Avoid promotional links in the public script text.

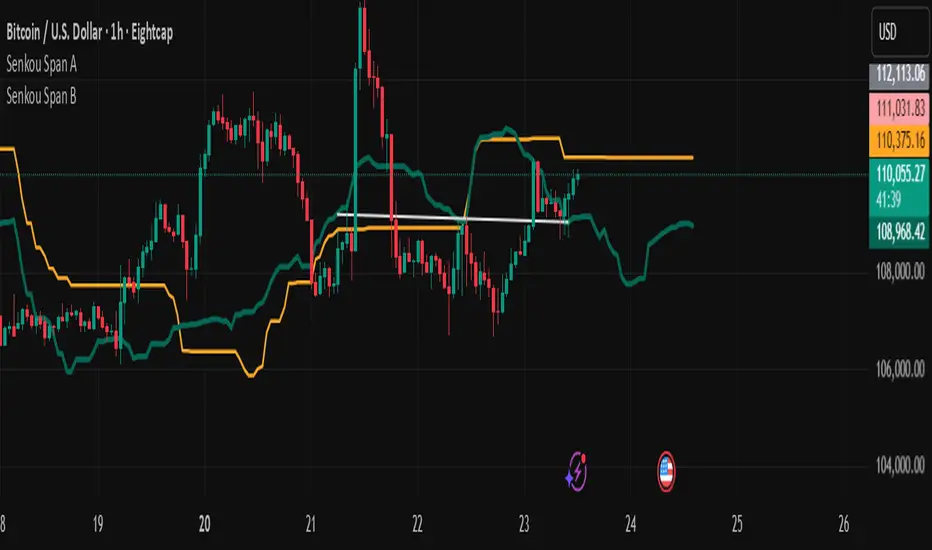
Senkou Span BUsing in conjunction with Senkou Span A to create effective kumo alert signals when kumo changes direction: bullish or bearish.
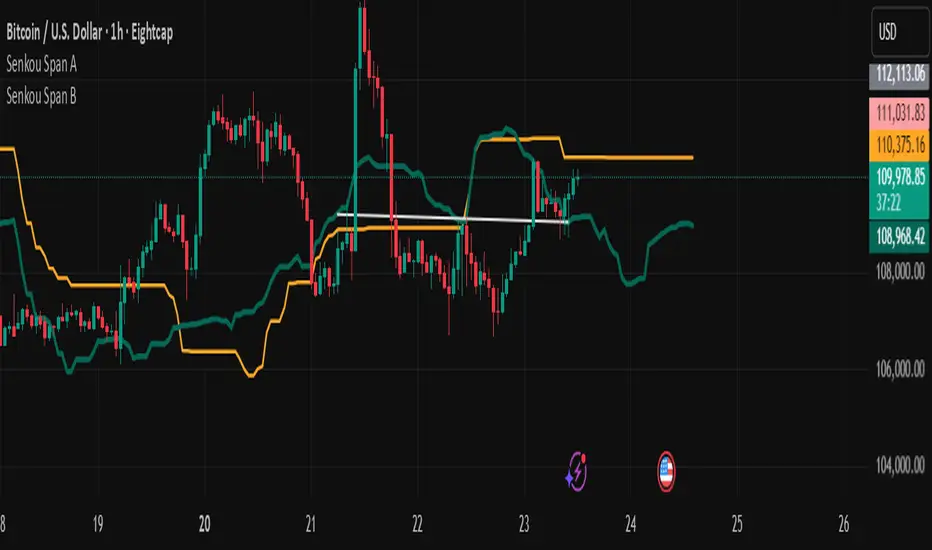
Senkou Span AUse it in conjunction with Senkou Span B to create effective kumo alert signals when kumo changes direction: bullish or bearish.
TR ADR/AWR/AMR (with 25%, 50%, 75%) - RodolfoThis script uses the TR ADR/AWR/AMR indicator code and only the 25 and 75% levels for all 3 volatilities

Multi-Timeframe EMA Trend Dashboard with Volume and RSI Filters═══════════════════════════════════════════════════════════
MULTI-TIMEFRAME EMA TREND DASHBOARD
═══════════════════════════════════════════════════════════
OVERVIEW
This indicator provides a comprehensive view of trend direction across multiple timeframes using the classic EMA 20/50 crossover methodology, enhanced with volume confirmation and RSI filtering. It aggregates trend information from six timeframes into a single dashboard for efficient market analysis.
The indicator is designed for educational purposes and to assist traders in identifying potential trend alignments across different time horizons.
═══════════════════════════════════════════════════════════
FEATURES
═══════════════════════════════════════════════════════════
MULTI-TIMEFRAME ANALYSIS
• Monitors 6 timeframes simultaneously: 1m, 5m, 15m, 1H, 4H, 1D
• Each timeframe analyzed independently using request.security()
• Non-repainting implementation with proper lookahead settings
• Calculates overall trend strength as percentage of bullish timeframes
EMA CROSSOVER SYSTEM
• Fast EMA (default: 20) and Slow EMA (default: 50)
• Bullish: Fast EMA > Slow EMA
• Bearish: Fast EMA < Slow EMA
• Neutral: Fast EMA = Slow EMA (rare condition)
• Visual EMA plots with optional fill area
VOLUME CONFIRMATION
• Optional volume filter for crossover signals
• Compares current volume against moving average (default: 20-period SMA)
• Categorizes volume as: High (>1.5x average), Normal (>average), Low (70), oversold (<30), and neutral zones
• Used in quality score calculation
• Optional display toggle
SUPPORT & RESISTANCE DETECTION
• Automatic detection using highest/lowest over lookback period (default: 50 bars)
• Plots resistance (red), support (green), and mid-level (gray)
• Step-line style for clear visualization
• Optional display toggle
QUALITY SCORING SYSTEM
• Rates trade setups from 1-5 stars
• Considers: MTF alignment, volume confirmation, RSI positioning
• 5 stars: 4+ timeframes aligned + volume confirmed + RSI 50-70
• 4 stars: 4+ timeframes aligned + volume confirmed
• 3 stars: 3+ timeframes aligned
• 2 stars: Exactly 3 timeframes aligned
• 1 star: Other conditions
VISUAL DASHBOARD
• Clean table display (position customizable)
• Color-coded trend indicators (green/red/yellow)
• Extended statistics panel (toggleable)
• Shows: Trends, Strength, Quality, RSI, Volume, Price Distance
═══════════════════════════════════════════════════════════
TECHNICAL SPECIFICATIONS
═══════════════════════════════════════════════════════════
CALCULATIONS
Trend Determination per Timeframe:
• request.security() fetches EMA values with gaps=off, lookahead=off
• Compares Fast EMA vs Slow EMA
• Returns: 1 (bullish), -1 (bearish), 0 (neutral)
Trend Strength:
• Counts number of bullish timeframes
• Formula: (bullish_count / 6) × 100
• Range: 0% (all bearish) to 100% (all bullish)
Price Distance from EMA:
• Formula: ((close - EMA) / EMA) × 100
• Positive: Price above EMA
• Negative: Price below EMA
• Warning when absolute distance > 5%
ANTI-REPAINTING MEASURES
• All request.security() calls use lookahead=barmerge.lookahead_off
• Dashboard updates only on barstate.islast
• Historical bars remain unchanged
• Crossover signals finalize on bar close
═══════════════════════════════════════════════════════════
USAGE GUIDE
═══════════════════════════════════════════════════════════
INTERPRETING THE DASHBOARD
Timeframe Rows:
• Each row shows individual timeframe trend status
• Look for alignment (multiple timeframes same direction)
• Higher timeframes generally more significant
Strength Indicator:
• >66.67%: Strong bullish (4+ timeframes bullish)
• 33.33-66.67%: Mixed/choppy conditions
• <33.33%: Strong bearish (4+ timeframes bearish)
Quality Score:
• Higher stars = better confluence of factors
• 5-star setups have strongest multi-factor confirmation
• Lower scores may indicate weaker or conflicting signals
SUGGESTED APPLICATIONS
Trend Confirmation:
• Check if multiple timeframes confirm current chart trend
• Higher agreement = stronger trend confidence
• Use for position sizing decisions
Entry Timing:
• Wait for EMA crossover on chart timeframe
• Confirm with higher timeframe alignment
• Volume above average preferred
• RSI not in extreme zones
Divergence Detection:
• When lower timeframes diverge from higher
• May indicate trend exhaustion or reversal
• Requires additional confirmation
CUSTOMIZATION
EMA Settings:
• Adjust Fast/Slow lengths for different sensitivities
• Shorter periods = more responsive, more signals
• Longer periods = smoother, fewer signals
• Common alternatives: 10/30, 12/26, 50/200
Volume Filter:
• Enable for higher-quality signals (fewer false positives)
• Disable in always-liquid markets or for more signals
• Adjust MA length based on typical volume patterns
Display Options:
• Toggle EMAs, S/R levels, extended stats as needed
• Choose dashboard position to avoid chart overlap
• Adjust colors for visibility preferences
═══════════════════════════════════════════════════════════
ALERTS
═══════════════════════════════════════════════════════════
AVAILABLE ALERT CONDITIONS
1. Bullish EMA Cross (Volume Confirmed)
2. Bearish EMA Cross (Volume Confirmed)
3. Strong Bullish Alignment (4+ timeframes)
4. Strong Bearish Alignment (4+ timeframes)
5. Trend Strength Increasing (>16.67% jump)
6. Trend Strength Decreasing (>16.67% drop)
7. Excellent Trade Setup (5-star rating)
Alert messages use standard placeholders:
• {{ticker}} - Symbol name
• {{close}} - Current close price
• {{time}} - Bar timestamp
═══════════════════════════════════════════════════════════
LIMITATIONS & CONSIDERATIONS
═══════════════════════════════════════════════════════════
KNOWN LIMITATIONS
• Lower timeframe data may not be available on all symbols
• 1-minute data typically limited to recent history
• request.security() subject to TradingView data limits
• Dashboard requires screen space (may overlap on small screens)
• More complex calculations may affect load time on slower devices
NOT SUITABLE FOR
• Highly volatile/illiquid instruments (many false signals)
• News-driven markets during announcements
• Automated trading without additional filters
• Markets where EMA strategies don't perform well
DOES NOT PROVIDE
• Exact entry/exit prices
• Stop-loss or take-profit levels
• Position sizing recommendations
• Guaranteed profit signals
• Market predictions
═══════════════════════════════════════════════════════════
BEST PRACTICES
═══════════════════════════════════════════════════════════
RECOMMENDED USAGE
✓ Combine with price action analysis
✓ Use appropriate risk management
✓ Backtest on historical data before live use
✓ Adjust settings for specific market characteristics
✓ Wait for higher-quality setups in important trades
✓ Consider overall market context and fundamentals
NOT RECOMMENDED
✗ Using as standalone trading system without confirmation
✗ Trading every signal without discretion
✗ Ignoring risk management principles
✗ Trading without understanding the methodology
✗ Applying to unsuitable markets/timeframes
═══════════════════════════════════════════════════════════
EDUCATIONAL BACKGROUND
═══════════════════════════════════════════════════════════
EMA CROSSOVER STRATEGY
The Exponential Moving Average crossover is a classical trend-following technique:
• Golden Cross: Fast EMA crosses above Slow EMA (bullish signal)
• Death Cross: Fast EMA crosses below Slow EMA (bearish signal)
• Widely used since the 1970s in various markets
• More responsive than SMA due to exponential weighting
MULTI-TIMEFRAME ANALYSIS
Analyzing multiple timeframes helps traders:
• Identify alignment between short and long-term trends
• Reduce false signals from single-timeframe noise
• Understand market context across different horizons
• Make informed decisions about trade duration
VOLUME ANALYSIS
Volume confirmation adds reliability:
• High volume suggests institutional participation
• Low volume signals may indicate false breakouts
• Volume precedes price in many market theories
• Helps distinguish genuine moves from noise
═══════════════════════════════════════════════════════════
TECHNICAL IMPLEMENTATION
═══════════════════════════════════════════════════════════
CODE STRUCTURE
• Organized in clear sections with proper commenting
• Uses explicit type declarations (int, float, bool, color, string)
• Constants defined at top (BULLISH=1, BEARISH=-1, etc.)
• Functions documented with @function, @param, @returns
• Follows PineCoders naming conventions (camelCase variables)
PERFORMANCE OPTIMIZATION
• var keyword for table (created once, not every bar)
• Calculations cached where possible
• Dashboard updates only on last bar
• Minimal redundant security() calls
SECURITY IMPLEMENTATION
• Proper gaps and lookahead parameters
• No future data leakage
• Signals finalize on bar close
• Historical bars remain static
═══════════════════════════════════════════════════════════
VERSION INFORMATION
═══════════════════════════════════════════════════════════
Current Version: 2.0
Pine Script Version: 5
Last Updated: 2024
Developed by: Zakaria Safri
═══════════════════════════════════════════════════════════
SETTINGS REFERENCE
═══════════════════════════════════════════════════════════
EMA SETTINGS
• Fast EMA Length: 1-500 (default: 20)
• Slow EMA Length: 1-500 (default: 50)
VOLUME & MOMENTUM
• Use Volume Confirmation: true/false (default: true)
• Volume MA Length: 1-500 (default: 20)
• Show RSI Levels: true/false (default: true)
• RSI Length: 1-500 (default: 14)
PRICE ACTION FEATURES
• Show Price Distance: true/false (default: true)
• Show Key Levels: true/false (default: true)
• S/R Lookback Period: 10-500 (default: 50)
DISPLAY SETTINGS
• Show EMAs on Chart: true/false (default: true)
• Fast EMA Color: customizable (default: cyan)
• Slow EMA Color: customizable (default: orange)
• EMA Line Width: 1-5 (default: 2)
• Show Fill Between EMAs: true/false (default: true)
• Show Crossover Signals: true/false (default: true)
DASHBOARD SETTINGS
• Position: Top Left/Right, Bottom Left/Right
• Show Extended Statistics: true/false (default: true)
ALERT SETTINGS
• Alert on Multi-TF Alignment: true/false (default: true)
• Alert on Trend Strength Change: true/false (default: true)
═══════════════════════════════════════════════════════════
RISK DISCLAIMER
═══════════════════════════════════════════════════════════
This indicator is provided for educational and informational purposes only. It should not be considered financial advice or a recommendation to buy or sell any security.
IMPORTANT NOTICES:
• Past performance does not indicate future results
• All trading involves risk of capital loss
• No indicator guarantees profitable trades
• Always conduct independent research and analysis
• Use proper risk management and position sizing
• Consult a qualified financial advisor before trading
• The developer assumes no liability for trading losses
By using this indicator, you acknowledge that you understand these risks and accept full responsibility for your trading decisions.
═══════════════════════════════════════════════════════════
SUPPORT & CONTRIBUTIONS
═══════════════════════════════════════════════════════════
FEEDBACK WELCOME
• Constructive comments appreciated
• Bug reports help improve the indicator
• Feature suggestions considered for future versions
• Share your experience to help other users
OPEN SOURCE
This code is published as open source for the TradingView community to:
• Learn from the implementation
• Modify for personal use
• Understand multi-timeframe analysis techniques
If you find this indicator useful, please consider:
• Leaving a thoughtful review
• Sharing with other traders who might benefit
• Following for future updates and releases
═══════════════════════════════════════════════════════════
ADDITIONAL RESOURCES
═══════════════════════════════════════════════════════════
RECOMMENDED READING
• TradingView Pine Script documentation
• PineCoders community resources
• Technical analysis textbooks on moving averages
• Multi-timeframe trading strategy guides
• Risk management principles
RELATED CONCEPTS
• Trend following strategies
• Moving average convergence/divergence
• Multiple timeframe analysis
• Volume-price relationships
• Momentum indicators
═══════════════════════════════════════════════════════════
Thank you for using this indicator. Trade responsibly and continue learning!
═══════════════════════════════════════════════════════════

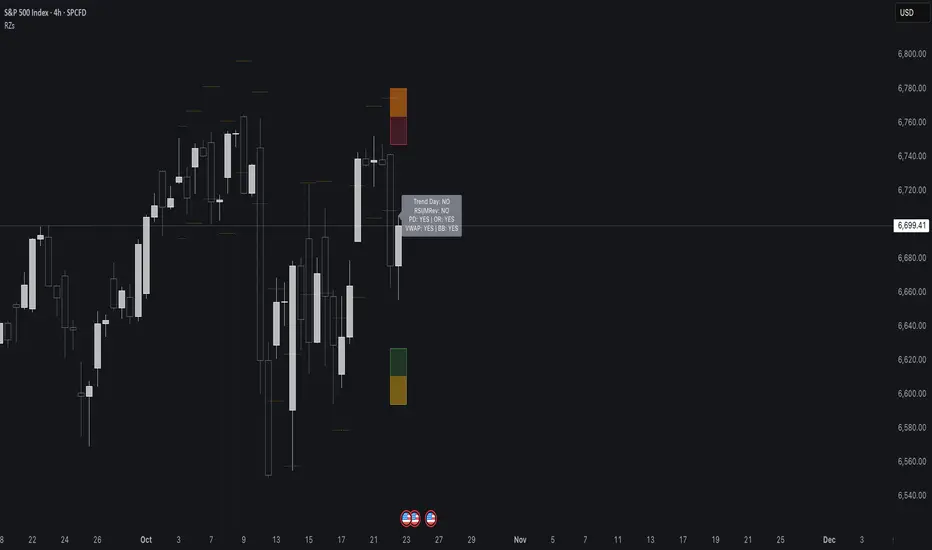
Reversal Zones// This indicator identifies likely reversal zones above and below current price by aggregating multiple technical signals:
// • Prior Day High/Low
// • Opening Range (9:30–10:00)
// • VWAP ±2 standard deviations
// • 60‑minute Bollinger Bands
// It draws shaded boxes for each base level, then computes a single upper/lower reversal zone (closest level from combined signals),
// with configurable zone width based on the expected move (EM). Within those reversal zones, it highlights an inner “strike zone”
// (percentage of the box) to suggest optimal short-option strikes for credit spreads or iron condors.
// Additional features:
// • Optional Expected Move lines from the RTH open
// • 15‑minute RSI/Mean‑Reversion and Trend‑Day confluence flags displayed in a dashboard
// • Toggles to include/exclude each signal and adjust styling
// How to use:
// 1. Adjust inputs to select which levels to include and set the expected move parameters.
// 2. Reversal boxes (red above, green below) show zones where price is most likely to reverse.
// 3. Inner strike zones (darker shading) guide optimal short-strike placement.
// 4. Dashboard confirms whether mean-reversion or trend-day conditions are active.
// Customize colors and visibility in the settings panel. Enjoy disciplined, confluence-based trade entries!
The Vishnu Zone Ver 2 by Dr. Sudhir Khollam## 📜 **The Vishnu Zone — Trade When the Brahma Zone Ends**
**Author:** Dr. Sudhir Khollam (SALSA© Method of Astrology & Market Psychology)
**Category:** Volatility Phase Detection / Bollinger Band Expansion Analysis
---
### 🔶 **Concept Overview**
In the **SALSA© Market Philosophy**, every market phase follows a cosmic rhythm —
* **Brahma Phase** represents *creation and expansion* (high volatility and strong directional movement).
* **Vishnu Phase** represents *maintenance and stability* (where expansion cools down and balanced opportunities appear).
**“The Vishnu Zone”** indicator identifies the exact moments when the **Brahma Phase ends** — signaling that the expansion has completed and the market is likely to enter a more stable, tradable state.
This is a **precision-timing indicator** that helps traders avoid entering at the end of impulsive phases and instead prepare for equilibrium-based trades (mean reversion, range setups, or steady trends).
---
### ⚙️ **How It Works**
The indicator measures **Bollinger Band Width (BBW)** to quantify expansion and contraction in volatility.
1. It calculates the **adaptive expansion threshold** using the average BBW over a rolling lookback period.
2. When the current BBW **drops below** this adaptive threshold **after being above it**, the script marks it as the **end of the Brahma Phase**.
3. This moment is shown visually as:
* 🕉 **“Vishnu” label** above the candle
* A **horizontal dotted line** extending for several bars
Together, these mark a **Vishnu Zone**, where the market transitions from expansion to consolidation — an ideal time for stabilization or entry planning.
---
### 📊 **Inputs & Settings**
| Parameter | Description |
| ---------------------------------- | ------------------------------------------------------------------------------ |
| **Bollinger Band Length** | The number of bars used for SMA and standard deviation (default 20). |
| **Bollinger Multiplier** | Determines the width of Bollinger Bands (default 2.0). |
| **Adaptive Lookback Period** | Rolling window to calculate the mean BBW for dynamic adjustment (default 150). |
| **Expansion Multiplier** | Multiplies the mean BBW to define the expansion threshold (default 1.35). |
| **Horizontal Line Extension Bars** | Number of bars to extend the Vishnu Zone line into the future (default 40). |
| **Show End-of-Brahma Labels?** | Toggle 🕉 labels on/off. |
| **Show Horizontal Lines?** | Toggle Vishnu Zone lines on/off. |
---
### 🔔 **Alerts**
When the **Brahma Phase ends**, the indicator triggers an alert:
> *“Brahma Phase Ends, Vishnu has taken over.”*
This helps traders receive real-time notification of volatility contraction and possible entry zones.
---
### 🧠 **Best Practices**
* Works effectively on **5-minute to 1-hour timeframes** for intraday trading.
* Best paired with **momentum or volume filters** to confirm trend exhaustion.
* Avoid entering during rapid expansion (Brahma phase). Wait for a Vishnu signal to ensure market stabilization.
---
### 🌌 **Philosophical Interpretation (SALSA© Principle)**
Just as Vishnu sustains the universe after Brahma’s creation, the market too enters a **maintenance phase** after every burst of expansion.
Recognizing this shift allows traders to align with **cosmic rhythm and price psychology**, not just technical metrics.
---
### 🧩 **Summary**
✅ Detects when expansion volatility ends
✅ Marks transition zones between impulsive and stable phases
✅ Sends real-time alerts
✅ Adaptive and self-adjusting across markets and assets
✅ Simple, clean visualization — ideal for disciplined trading
---
### ⚡ **Use Case**
Perfect for traders who:
* Prefer **low-risk entries** after volatility spikes
* Trade **mean reversion**, **range breakouts**, or **volatility collapses**
* Believe in the **cyclic nature of market energy**
---

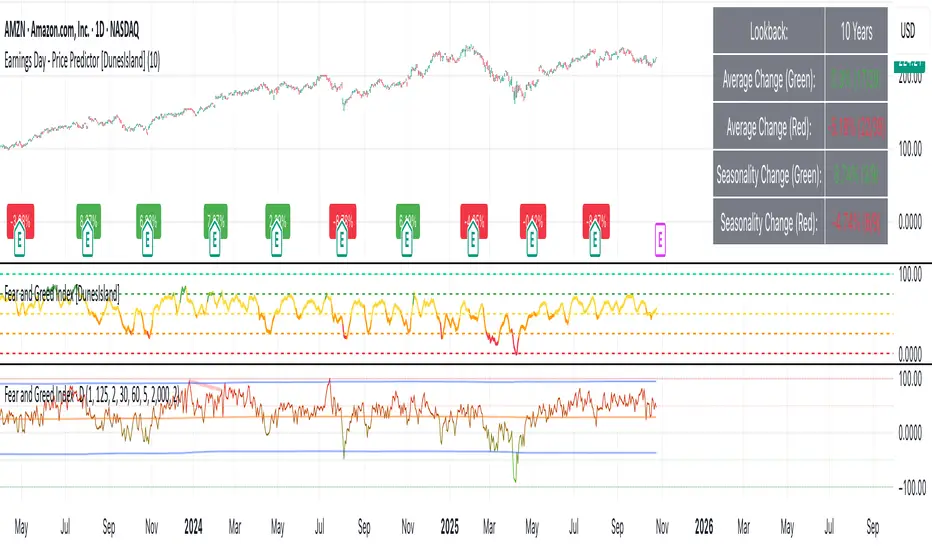
Earnings Day - Price Predictor [DunesIsland]It's designed to analyze and visualize historical stock price movements on earnings report days, focusing on percentage changes.
Here's a breakdown of what it does, step by step:
Key Inputs and Setup
User Input: There's a single input for "Lookback Years" (default: 10), which determines how far back in time (approximately) the indicator analyzes earnings data. It uses a rough calculation of milliseconds in that period to filter historical data.
Data Fetching: It uses TradingView's request.earnings function to pull actual earnings per share (EPS) data for the current ticker. Earnings days are identified where EPS data exists on a bar but not on the previous one (to avoid duplicates).
Price Change Calculation: For each detected earnings day, it computes the percentage price movement as (close - close ) / close * 100, representing the change from the previous close to the current close on that day.
Processing and Calculations (on the Last Bar)
Lookback Filter: It calculates a cutoff timestamp for the lookback period and processes only earnings events within that window.
Overall Averages:
Separates positive (≥0%) and negative (<0%) percentage changes.
Seasonality (Next Quarter Prediction):
Identifies the most recent earnings quarter (latest_q).
Predicts the "next" quarter (e.g., if latest is Q4, next is Q1;
Again, separates positive and negative changes, computing their respective averages.
Visual Outputs
Lookback: How far to fetch the data in years.
Average Change (Green): Showing the average of all positive changes.
Average Change (Red): Showing the average of all negative changes.
Seasonality Change (Green): Showing the average of positive changes for the predicted next quarter.
Seasonality Change (Red): Showing the average of negative changes for the predicted next quarter.
Purpose and Usage
This indicator helps traders assess a stock's historical reaction to earnings announcements. The overall averages give a broad sense of typical gains/losses, while the seasonality focuses on quarter-specific trends to "predict" potential movement for the upcoming earnings (based on past same-quarter performance). It's best used on daily charts for stocks with reliable earnings data. Note that quarter inference is calendar-based and may not perfectly match fiscal calendars for all companies—it's an approximation.
Smooth Theil-SenI wanted to build a Theil-Sen estimator that could run on more than one bar and produce smoother output than the standard implementation. Theil-Sen regression is a non-parametric method that calculates the median slope between all pairs of points in your dataset, which makes it extremely robust to outliers. The problem is that median operations produce discrete jumps, especially when you're working with limited sample sizes. Every time the median shifts from one value to another, you get a step change in your regression line, which creates visual choppiness that can be distracting even though the underlying calculations are sound.
The solution I ended up going with was convolving a Gaussian kernel around the center of the sorted lists to get a more continuous median estimate. Instead of just picking the middle value or averaging the two middle values when you have an even sample size, the Gaussian kernel weights the values near the center more heavily and smoothly tapers off as you move away from the median position. This creates a weighted average that behaves like a median in terms of robustness but produces much smoother transitions as new data points arrive and the sorted list shifts.
There are variance tradeoffs with this approach since you're no longer using the pure median, but they're minimal in practice. The kernel weighting stays concentrated enough around the center that you retain most of the outlier resistance that makes Theil-Sen useful in the first place. What you gain is a regression line that updates smoothly instead of jumping discretely, which makes it easier to spot genuine trend changes versus just the statistical noise of median recalculation. The smoothness is particularly noticeable when you're running the estimator over longer lookback periods where the sorted list is large enough that small kernel adjustments have less impact on the overall center of mass.
The Gaussian kernel itself is a bell curve centered on the median position, with a standard deviation you can tune to control how much smoothing you want. Tighter kernels stay closer to the pure median behavior and give you more discrete steps. Wider kernels spread the weighting further from the center and produce smoother output at the cost of slightly reduced outlier resistance. The default settings strike a balance that keeps the estimator robust while removing most of the visual jitter.
Running Theil-Sen on multiple bars means calculating slopes between all pairs of points across your lookback window, sorting those slopes, and then applying the Gaussian kernel to find the weighted center of that sorted distribution. This is computationally more expensive than simple moving averages or even standard linear regression, but Pine Script handles it well enough for reasonable lookback lengths. The benefit is that you get a trend estimate that doesn't get thrown off by individual spikes or anomalies in your price data, which is valuable when working with noisy instruments or during volatile periods where traditional regression lines can swing wildly.
The implementation maintains sorted arrays for both the slope calculations and the final kernel weighting, which keeps everything organized and makes the Gaussian convolution straightforward. The kernel weights are precalculated based on the distance from the center position, then applied as multipliers to the sorted slope values before summing to get the final smoothed median slope. That slope gets combined with an intercept calculation to produce the regression line values you see plotted on the chart.
What this really demonstrates is that you can take classical statistical methods like Theil-Sen and adapt them with signal processing techniques like kernel convolution to get behavior that's more suited to real-time visualization. The pure mathematical definition of a median is discrete by nature, but financial charts benefit from smooth, continuous lines that make it easier to track changes over time. By introducing the Gaussian kernel weighting, you preserve the core robustness of the median-based approach while gaining the visual smoothness of methods that use weighted averages. Whether that smoothness is worth the minor variance tradeoff depends on your use case, but for most charting applications, the improved readability makes it a good compromise.


Constant Auto Trendlines (Extended Right)📈 Constant Auto Trendlines (Extended Right)
This indicator automatically detects market structure by connecting swing highs and lows with permanent, forward-projecting trendlines.
Unlike standard trendline tools that stop at the last pivot, this version extends each trendline infinitely into the future — helping traders visualize where price may react next.
🔍 How It Works
The script identifies pivot highs and lows using user-defined left/right bar counts.
When a new lower high or higher low appears, the indicator draws a line between the two pivots and extends it forward using extend.right.
Each new confirmed trendline stays fixed, creating a historical map of structure that evolves naturally with market action.
Optional filters:
Min Slope – ignore nearly flat trendlines
Show Latest Only – focus on the most relevant trendline
Alerts – get notified when price crosses the most recent uptrend or downtrend line
🧩 Why It’s Useful
This tool helps traders:
Spot emerging trends early
Identify dynamic support/resistance diagonals
Avoid redrawing trendlines manually
Backtest structure breaks historically
⚙️ Inputs
Pivot Left / Right bars
Min slope threshold
Line color, width, and style
Show only latest line toggle
Alert options

NWOG/NDOG + EHPDA🌐 ENGLISH DESCRIPTION
Hybrid NWOG/NDOG + EHPDA – Advanced Gaps & Event Horizon Indicator
(Enhanced with Real-Time Alerts and Info Table)
📊 Overview
This advanced indicator combines automatic detection of weekly gaps (NWOG) and daily gaps (NDOG) with the Event Horizon (EHPDA) concept, now featuring customizable alerts and a real-time info table for a more efficient trading experience. Designed for traders who operate based on institutional price structures, liquidity zones, and SMC/ICT confluences.
✨ Key Features
1. Gap Detection & Visualization
NWOG (New Week Opening Gap): Identifies and visualizes the gap between Friday’s close and Monday’s open.
NDOG (New Day Opening Gap): Detects daily gaps on intraday timeframes.
Enhanced visualization: Semi-transparent boxes, price levels (top, middle, bottom), and lines extended to the current bar.
Customizable labels: Display gap formation date and price levels (optional).
2. Event Horizon (EHPDA)
Automatically calculates the Event Horizon level between two non-overlapping gaps.
Dashed line marking the equilibrium zone between bullish and bearish gaps.
3. Advanced 5pm-6pm Mode
Special option to detect the Sunday-Monday gap using 4H bars.
4. Real-Time Alerts
New gaps (NWOG/NDOG): Immediate notification when a new gap forms.
Gap fill: Alert when price completely fills a gap.
Event Horizon active: Notification when the Event Horizon level is triggered.
5. Info Table
Real-time display: number of active gaps, Event Horizon status, time remaining until weekly/daily close.
Customizable: position, size, and style.
🎨 Customization
Configurable colors for bullish gaps, bearish gaps, and Event Horizon line.
Customizable price labels and date format.
📈 Use Cases
Reversal trading, price targets, liquidity zones, SMC/ICT confluences.
⚙️ Recommended Settings
Timeframes: Daily and intraday (15m, 1H, 4H, etc.).
NWOG: Enable on all timeframes.
NDOG: Enable only on intraday.
Max Gaps: 3-5 for clean charts, 10-15 for historical analysis.
📝 Important Notes
Works best on 24/5 markets (Forex, Crypto).
Gaps automatically close when filled.
Event Horizon only appears with at least 2 non-overlapping gaps.

VBE Pro - Advanced Volatility Bands with Zero Lag & PredictionVBE Pro: Zero-Lag Predictive Bands
A next-gen volatility envelope that blends zero-lag smoothing with forward-looking volatility models (EWMA/GARCH/HAR/ML) to keep bands tight in calm markets, responsive in shocks, and adaptive across regimes.
What it does
Builds volatility from multiple methods (ATR, StDev, Parkinson, Garman-Klass, Rogers-Satchell, Yang-Zhang).
Projects near-term vol with your choice of predictor, then blends it via a weight slider.
Applies zero-lag smoothing (ZLEMA/ZLMA/DEMA/TEMA/HMA/JMA/Ehlers/Kalman/T3) to cut delay without over-shoot.
Auto-adapts band width by regime (high/low/normal) and can expand dynamically with price acceleration.
Optional displacement to align with your execution style.
On-chart
Upper/Lower zero-lag bands with optional fill.
Middle line (ZL-smoothed source).
Regime-tinted background (High/Low).
Displacement marker (if used).
Compact top-right info table: current vs predicted vol, regime, squeeze, multiplier, methods, ZL gain, est. lag reduction.
Signals & Alerts
Break↑ / Break↓ when price crosses the bands.
Vol↑ / Vol↓ expansion/contraction sequences.
“Squeeze” when band width compresses vs its ZL average.
“ZL” marker when significant zero-lag is active.
Prediction divergence ⚠ when projected vol deviates > threshold.
Built-in alertconditions for all of the above.
Quick start
Method: ATR or Hybrid for robustness.
Smoothing: ZLEMA, length 5–8, ZL gain 2–3 (push higher only if you accept more projection).
Bands: Multiplier 2.0, Adaptive on, Dynamic off to start.
Prediction: EWMA, weight 0.25–0.35. Move to GARCH in mean-reverty tapes; HAR-RV for mixed regimes.
Regime lookback: 50.

PulseRPO Zero-Lag BandsPulseRPO is a momentum and volatility timing suite built on a zero-lag Relative Price Oscillator. It pairs an RPO (fast vs slow MA spread, in %) with adaptive volatility envelopes that tighten or widen as conditions change, so you can spot true momentum bursts, exhaustion and “quiet-before-the-move” squeezes—without the usual MA lag.
What it shows
Zero-Lag RPO: Choose EMA, SMA, WMA, RMA, HMA or ZLEMA for the base, then apply ZLEMA/DEMA/TEMA/HMA zero-lag smoothing to cut delay.
Adaptive Bands: StdDev, ATR, Range or Hybrid volatility; bands auto-tighten in high vol and widen in quiet regimes.
Dynamic OB/OS: Levels scale with current regime so extremes mean something even as volatility shifts.
Signal & Histogram: Classic signal cross plus histogram for quick read of acceleration vs deceleration.
Squeeze Paint: Subtle background highlight when band width compresses below its average.
Divergences & Triggers: Optional bullish/bearish divergence tags, plus band-cross and signal-cross alerts out of the box.
How to use it (general guide)
Momentum entries: Look for RPO crossing up its signal from below or snapping out of a squeeze; extra weight if it also re-enters from below the lower band.
Trend continuation: RPO riding outside the upper (or lower) band with rising histogram = power move; trail risk on pullbacks to the signal line.
Exhaustion / fades: Taps beyond dynamic OB/OS or band re-entries can mark mean-revert windows—confirm with price/volume.
Risk filter: During squeeze, size down and prepare for expansion; after expansion, respect extremes.
Tweak the MA type, band method and zero-lag strength to match your timeframe. PulseRPO is designed to be a self-contained read: regime → setup → trigger → alert.

MA Oscillator Map [ChartPrime]⯁ OVERVIEW
The MA Oscillator Map transforms moving average deviations into an oscillator framework that highlights overextended price conditions. By normalizing the difference between price and a chosen moving average, the tool maps oscillations between -100 and +100 , with gradient coloring to emphasize bullish and bearish momentum. When the oscillator cools from extreme levels (-100/100), the indicator marks potential reversal points and extends short-term levels from those extremes. A compact side table and dynamic bar coloring make momentum context visible at a glance.
⯁ KEY FEATURES
Oscillator Mapping (±100 Scale):
Price deviation from the selected MA is normalized into a percentage scale, allowing consistent overbought/oversold readings across assets and timeframes.
// MA
MA = ma(close, maLengthInput, maTypeInput)
diff = src - MA
maxVal = ta.highest(math.abs(diff), 50)
osc = diff / maxVal * 100
Customizable MA Types:
Choose SMA, EMA, SMMA, WMA, or VWMA to fine-tune the smoothing method that powers the oscillator.
Extreme Signal Diamonds:
When the oscillator retreats from +100 or -100, the script plots diamonds to flag potential exhaustion and reversal zones.
Dynamic Levels from Extremes:
Upper and lower dotted lines extend from recent overextension points, projecting temporary barriers until broken by price.
Gradient Bar Coloring:
Candles and oscillator values adopt a bullish-to-bearish gradient, making shifts in momentum instantly visible on the chart.
Compact Momentum Map:
A table at the chart’s edge plots the oscillator position with a gradient scale and live percentage label for precise momentum tracking.
⯁ USAGE
Watch for diamonds after the oscillator exits ±100 — these mark potential exhaustion zones.
Use extended dotted levels as short-term reference lines; if broken, trend continuation is favored.
Combine gradient bar coloring with oscillator shifts for confirmation of momentum reversals.
Experiment with different MA types to adapt sensitivity for trending vs. ranging markets.
Use the side momentum table as a quick-read gauge of trend strength in percent terms.
⯁ CONCLUSION
The MA Oscillator Map reframes moving average deviations into a visual momentum tracker with extremes, reversal signals, and dynamic levels. By blending oscillator math with intuitive visuals like gradient candles, diamonds, and a live gauge, it helps traders spot overextension, exhaustion, and momentum shifts across any market.

SuperBandsI've been seeing a lot of volatility band indicators pop up recently, and after watching this trend for a while, I figured it was time to throw my two chips in. The original spark for this idea came years ago from RicardoSantos's Vector Flow Channel script, which used decay channels with timed events in an interesting way. That concept stuck with me, and I kept thinking about how to build something that captured the same kind of dynamic envelope behavior but with a different mathematical foundation. What I ended up with is a hybrid that takes the core logic of supertrend trailing stops, smooths them heavily with exponential moving averages, and wraps them in Donchian-style filled bands with momentum-based color gradients.
The basic mechanism here is pretty straightforward. Standard supertrend calculates a trailing stop based on ATR offset from price, then flips direction when price crosses the trail. This implementation does the same thing but adds EMA smoothing to the trail calculation itself, which removes a lot of the choppiness you get from raw supertrend during sideways periods. The smoothing period is adjustable, so you can tune how reactive versus stable you want the bands to be. Lower smoothing values make the bands track price more aggressively, higher values create wider, slower-moving envelopes that only respond to sustained directional moves.
Where this diverges from typical supertrend implementations is in the visual presentation and the separate treatment of bullish and bearish conditions. Instead of a single flipping line, you get persistent upper and lower bands that each track their own trailing stops independently. The bullish band trails below price and stays active as long as price doesn't break below it. The bearish band trails above price and remains active until price breaks above. Both bands can be visible simultaneously, which gives you a dynamic channel that adapts to volatility on both sides of price action. When price is trending strongly, one band will dominate and the other will disappear. During consolidation, both bands tend to compress toward price.
The color gradients are calculated by measuring the rate of change in each band's position and converting that delta into an angle using arctangent scaling. Steeper angles, which correspond to the band moving quickly to catch up with accelerating price, get brighter colors. Flatter angles, where the band is moving slowly or staying relatively stable, fade toward more muted tones. This gives you a visual sense of momentum within the bands themselves, not just from price movement. A rapidly brightening band often precedes expansion or breakout conditions, while fading colors suggest the trend is losing steam or entering consolidation.
The filled regions between price and each band serve a similar function to Donchian channels or Keltner bands, creating clearly defined zones that represent normal price behavior relative to recent volatility. When price hugs one band and the fill area compresses, you're in a strong directional regime. When price bounces between both bands and the fills expand, you're in a ranging environment. The transparency gradients in the fills make it easier to see when price is near the edge of the envelope versus safely inside it.
Configuration is split between bullish and bearish settings, which lets you asymmetrically tune the indicator if you find that your market or timeframe has different characteristics in uptrends versus downtrends. You can adjust ATR period, ATR multiplier, and smoothing independently for each direction. This flexibility is useful for instruments that exhibit different volatility profiles during bull and bear phases, or for strategies that want tighter trailing on longs than shorts, or vice versa.
The ATR period controls the lookback window for volatility measurement. Shorter periods make the bands react quickly to recent volatility spikes, which can be beneficial in fast-moving markets but also leads to more frequent whipsaws. Longer periods smooth out volatility estimates and create more stable bands at the cost of slower adaptation. The multiplier scales the ATR offset, directly controlling how far the bands sit from price. Smaller multipliers keep the bands tight, triggering more frequent direction changes. Larger multipliers create wider envelopes that give price more room to move without breaking the trail.
One thing to note is that this indicator doesn't generate explicit buy or sell signals in the traditional sense. It's a regime filter and envelope tool. You can use band breaks as directional cues if you want, but the primary value comes from understanding the current volatility environment and whether price is respecting or violating its recent behavioral boundaries. Pairing this with momentum oscillators or volume analysis tends to work better than treating band breaks as standalone entries.
From an implementation perspective, the supertrend state machine tracks whether each direction's trail is active, handles resets when price breaks through, and manages the EMA smoothing on the trail points themselves rather than just post-processing the supertrend output. This means the smoothing is baked into the trailing logic, which creates a different response curve than if you just applied an EMA to a standard supertrend line. The angle calculations use RMS estimation for the delta normalization range, which adapts to changing volatility and keeps the color gradients responsive across different market conditions.
What this really demonstrates is that there are endless ways to combine basic technical concepts into something that feels fresh without reinventing mathematics. ATR offsets, trailing stops, EMA smoothing, and Donchian fills are all standard building blocks, but arranging them in a particular way produces behavior that's distinct from each component alone. Whether this particular arrangement works better than other volatility band systems depends entirely on your market, timeframe, and what you're trying to accomplish. For me, it scratched the itch I had from seeing Vector Flow years ago and wanting to build something in that same conceptual space using tools I'm more comfortable with.

Bitgak [Osprey]🟠 INTRODUCTION
Bitgak , translated as "Oblique Angle" in Korean, is a strategy used by multi-hundred-million traders in Korea, sometimes more heavily than Fibonacci retracement.
It is a concept that by connecting two or more pivot points on the chart and creating equidistant parallel lines, we can spot other pivot points. As seen in the example, a line at a different height but with the same angle spots many pivot points.
This indicator spots pivot points on the chart and tests all different possible Bitgak lines with a brute-force method. Then it shows the parallel line configuration with the most pivots hitting it. You may use the lines drawn on the chart as possible reversal points.
It is best to use on Day and Week candles . In the very short range of time, the noise makes it hard to capture meaningful data.
🟠 HOW TO USE
The orange dots are the major pivot points (you can set the period of the long-term pivot) upon which the lines are built.
Change the "Manual Lookback Bars" from 300 to a meaningful period upon your inspection.
"Hit Tolerance %" means how close a pivot needs to be to the line to be considered as having touched the line.
If the line is too narrow, which is not very useful, you may consider increasing the "Long-term Pivot Bars" and experimenting with different settings for Channel Lines and Heuristics.
The result:
"Top Anchors to Test (L)" is how many L highest peaks and L lowest troughs should be weighed heavily when testing the lines. That is, with L = 1, the algorithm will reward the Bitgak lines that touch 1 highest peak and 1 lowest trough. It doesn't make much intuitive sense, so I suggest just testing it out.
🟠 HOW IT WORKS
Step 1: Pivot Detection
The indicator runs two parallel detection systems:
Short-term pivots (default: 7 bars on each side) - Captures minor swing highs/lows for detailed analysis
Long-term pivots (default: 17 bars on each side) - Identifies major structural turning points
These pivots form the foundation for all channel calculations.
Step 2: Anchor Point Selection
From the detected long-term pivots, the algorithm identifies:
The L highest peaks (default L=1, meaning the single highest peak)
The L lowest troughs (default L=1, meaning the single lowest trough)
These become potential "anchor points" for channel construction. Higher L values test more combinations but increase computation time.
Step 3: Channel Candidate Generation
For support channels: Every pair of troughs becomes a potential base line (A-B)
For resistance channels: Every pair of peaks becomes a potential base line (A-B)
The algorithm then tests each peak (for support) or trough (for resistance) as pivot C.
Step 4: Optimal Spacing Calculation
For each A-B-C combination, the algorithm calculates:
Unit Spacing = (Distance from C to A-B line) / Multiplier
It tests multipliers from 0.5 to 4.0 (or your custom range), asking: "If pivot C sits on the 1.0 line, what spacing makes the most pivots hit other lines?"
Step 5: Scoring & Selection
Each configuration is scored by counting how many pivots fall within tolerance (default 1% of price) of any parallel line in the range . The highest-scoring channel is drawn on your chart.
