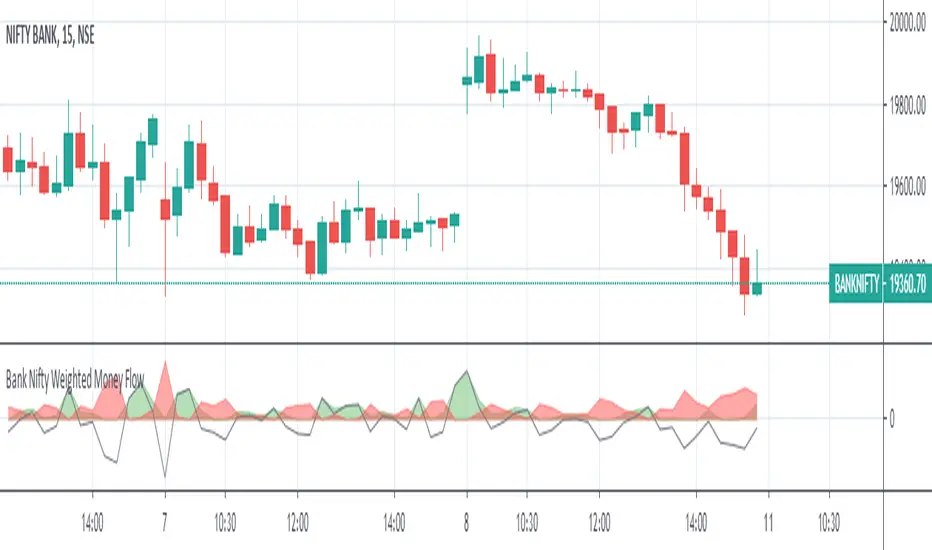
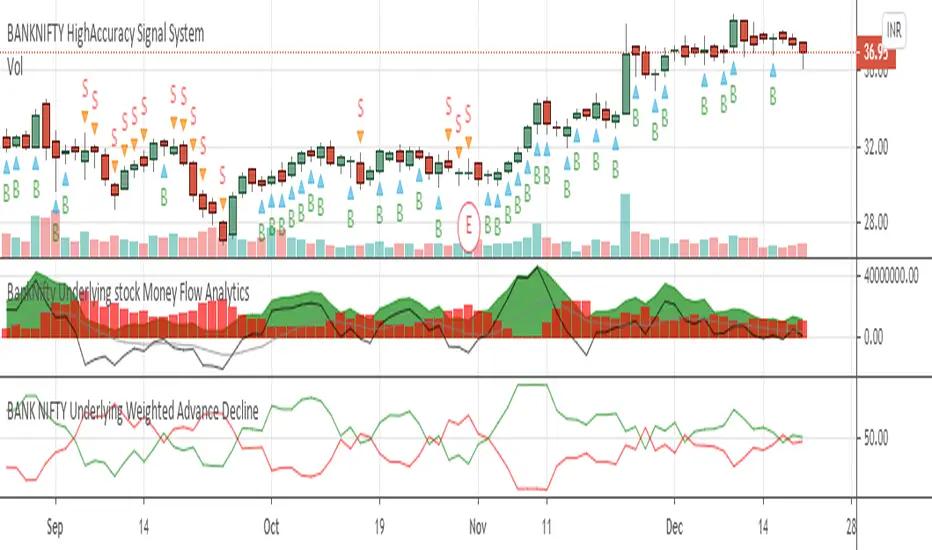
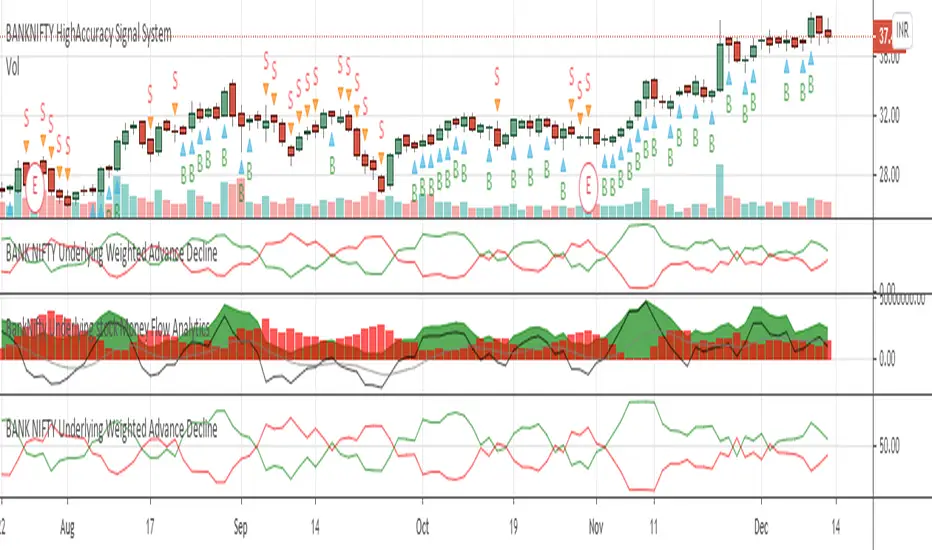
Bank Nifty Weighted Money FlowThe indicator comprises of 2 areas ( one in green and another in red ) that depict the money flowing in and out the underlying 12 banks under BANK NIFTY index
The money flowing in and flowing out is calculated by identifying the buying pressure and selling pressure of each of 12 underlying banks within a 15 minute period ( which is internally further broken down by 15 one minute candles ), there by identifying the buy volume and sell volume multiplied by the price of the stock for the given minute aggregated for 15 minutes
The derived value for each bank is further weighted as per their weight in the index ( as of May 2nd 2020 ) and then summed up separately for both money flowing in and flowing out and plotted which shall help traders take decision based on the magnitude of money flowing in and out ( the weights shall be updated as and when the same changes in the index calculations )
The green color area represents the money flown in and the red color area represents the money that has flown out
A gradually increasing green area along with the decrease in the red area can be considered as the market is more into buying and less into selling and vice versa ( this can be observed in the chart before the rally begins , there should be an increasing green area which could potentially signifies money has started to flow in )
An equal or almost equal areas could signify a sideways market and the black line moving across shows the difference of money flowing and flowing out
Comments and feedback are welcome
Should you have any doubts or wish to access the script then please feel free to DM me.
***** The indicator works only in 15 minutes time frame *****
BANKNIFTY
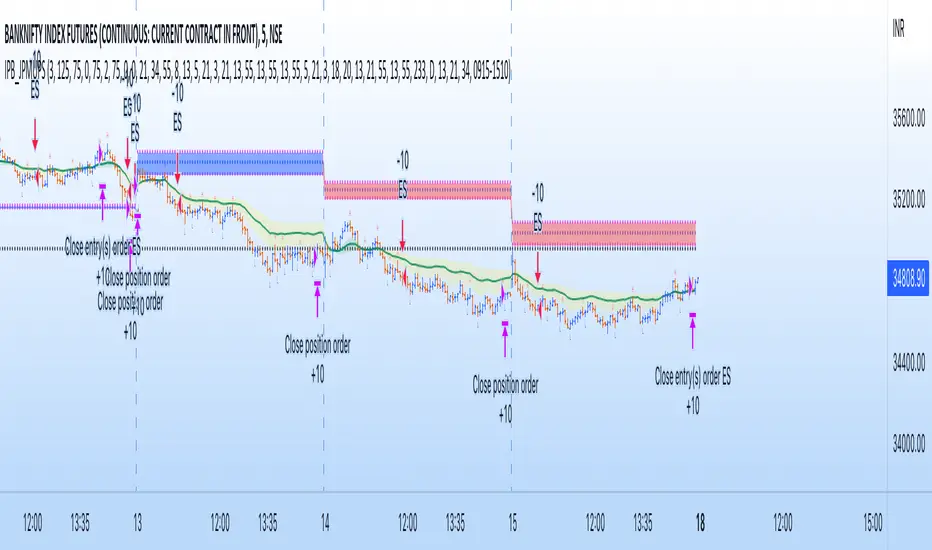
IndianPivotBossJP_MUPSThis is an advanced form of MUPS pivot intraday trading system.
Use this indicator with the following indicators :
1) IndianPivotBossPivotShift.
2) IndianPivotBossPivotRSI
3) PBOscillator
4) IndianPivotBossADMIN
When all the four indicators are sloping upwards, the long setup is triggered.
The indicators bars turns blue when each of them begins to slope upwards.
For a convincing indication, look for 3 consecutive blue bars in all of them for a long setup.
Once the setup is confirmed, all you have to do is to plan your entry.
Ensure there is no overhead resistance in the form of any pivot levels or any other key levels when you go long after the setup.
Reverse logic for short.
IndianPivotBoss_ADMINThis is a momentum index derived from the number of advances - number of declines of the stocks comprising the index.
This is called Advance Decline Momentum INdex (ADMIN).
It is a leading indicator to spot reversals.
This can be used in any time frames right from intraday to higher time frames.
By default it is configured for Bank Nifty (12 stocks).
Stocks can be changed with provision to have maximum of 12 stocks only.
How to use this while trading ?
The bars represent the 55 period ema of the momentum of difference between advances and declines
The line represent the 13 period ema of the momentum of difference between advances and declines.
If the bars are upward sloping, the color becomes blue and it becomes red if they are sloping downwards.
If the line crosses above the bars and moves past 50 with bars having blue color, it suggests a possible upward bias.
If the line crosses below the bars and moves below 50 with bars having red color, it suggests a possible downward bias.
Practice spotting in any time frames. I am confident this will form a major tool in your trading arsenal.
Respect Risk management. There is no holy grail.

Custom VolumeIdea : Idea of script is getting the volume of index BNF and NIFTY50 ( as Tradingview don't provide the volume information of the indexes )
How it works : Script works on getting the weighted volume of underlying stocks and the plotting them by weight in volume
Benefits:
1. Can server as example how, once can plot the mixed volume of symbols
2. Will help the traders who consider volume also as decision making factor while trading BNF from tradingview chart
3. Can give volume information on any TF **in my knowledge only available for premium users
Important factor to note: Weight of stocks may change time to time depending on Exchange decision.

Breadth Indicator : RVC-BNifty-Adv-Dec-LineBreadth Indicators
Summary : Script calculates Advance and Declain value based on weightage of each Bank share in BankNifty Index
Bank NIfty is not an asset and it does not have value.
It is composition based on multiple bank stocks with different weightage.
This tool display the indicator based on "Number of Stocks Moving on UP TICK" and "Number of Stocks Moving on DOWN TICK"
Currently this calculation is based on 12 stocks based on their weightage.
Axis Bank , Bank of Baroda
Federal Bank, HDFC Bank
ICICI Bank, IDFC Bank Ltd.
IndusInd Bank, Kotak Mahindra Bank
Punjab National Bank , RBL Bank
State Bank of India (SBI), Yes Bank

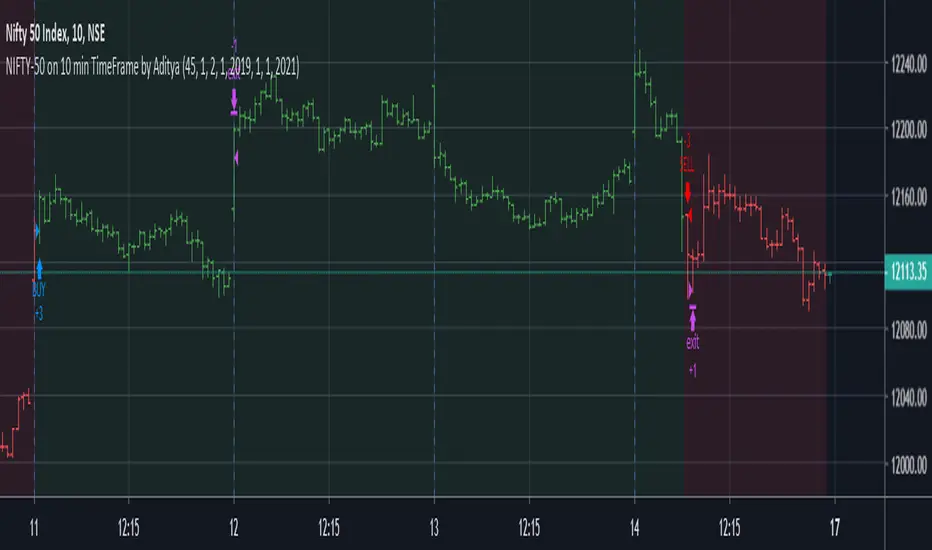
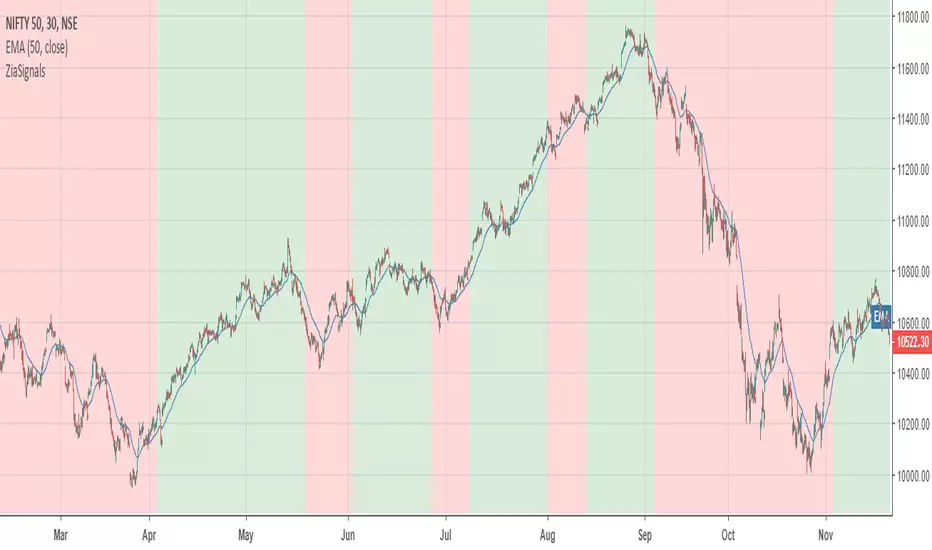
NIFTY-50 on 10 min TimeFrame by Aditya
I have developed this strategy for NIFTY-50 Index on which is traded National Stock of Exchange(India). It is non-repainting indicator and uses @version=4
This script uses hourly and daily price data.
The results will be very different depending on the chart and time-frame of your choice and date range of your choice.
The default contract quantity is set to 2 .You can adjust as per your risk management.
I have found that taking partial profit (1 contract) and continuing the with remaining (1 contract) keeps you in trade until next trend reversal.
It has following usage setting:
1. Enable/Disable take partial profit.
2. Partial profit points.(45 points gives better results)
3. No. of contracts for partial profit booking.
4. Date Range (From and To) to check for different date range.
4. Enable/Disable Bar Color.
5. Enable/Disable Background Color.
Thanks © allanster for script"How To Set Backtest Range" for Date Range functionality .
I have tested this indicator on 10 minutes time-frame on National Stock of Exchange(India) which gives good results and the time period is almost 1 year
from 21/01/2019 to 14/02/2020.
Points=5632.
No. of trades=202
Profit Factor=1.9
Sharpe Ratio=0.626
The NIFTY-50 contract size is 75.
This strategy gives better results on Index as this is optimized for Indexes. You can always try on other instruments or you can private message me.
Use proper risk management.
This is a premium indicator so send me a private message in order to access this script. This script is for information and educational purpose.
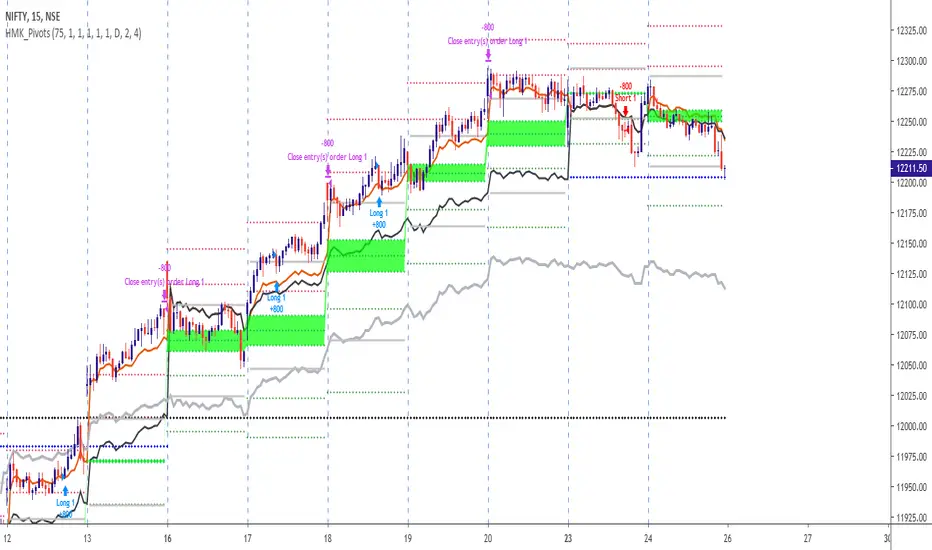
RVC-Weekly-Pivots-GANN-LevelsPurpose:
Weekly - Fibonacci pivot levels and Gann levels calculation and marking on Chart automatically.
Mainly expected to use for trading on NIFTY and BankNifty
Kindly share your comments and suggestions to improve

@scorpiomanojFRM CBOSThis is a Camarilla pivot based trading strategy.
It falls under the category of initiative trading strategy and not responsive trading strategy.
This strategy buys or sells when price crosses Camarilla 4th level and exits at the close of the day or it breaches Camarilla 3rd level.
Backtested results are not guaranteed to perform in the future. Hence please use it at your own risk.
Respect risk management.

JARVISJARVIS is a technical indicator primarily designed for Nifty Bank. But, it also works on other instruments like stocks for example. You may apply it on other instruments if you find it useful.
Once the indicator is plotted, it will have bars with 3 colours
1) Blue - It's watching
2) Green - It's bullish
3) Red - It's bearish
So, it's that easy to interpret.
Following are few examples on NSE:BANKNIFTY
September 20, 2019 - Indicator turned green and remained so till end of the day. If you would have followed this, you would have made more than 2000 points.
September 25, 2019 - Indicator turned red and remained so till end of the day. If you would have followed this, you would have made more than 100 points.
September 26, 2019 and September 27, 2019 - Indicator remained blue and you see that the market was just consolidating.
Above are just a few examples of what this is capable of. Apart from Nifty Bank, it also works well on popular stocks like Reliance, TCS, SBIN etc
Recommended time frame for this is 15 mins, but, you may experiment with other time frames as well. It's all about finding the right time frame for that particular instrument, for example it works best on 2H when applied on Nifty.
Should you have any doubts, feel free to DM me.

PivotIntradayStrategy@scorpiomanojFRMThis is an intraday trading strategy using Floor Pivots for BankNifty.
This strategy overlays on the charts with wide variety of drawing floor pivots and previous day levels.
VERY IMPORTANT :
1) LONGS AND SHORTS TO BE TAKEN IN 5 MIN CHART. 15 MIN CHART IS DISPLAYED BECAUSE TV DOESNT ALLOW TO PUBLISH WITH TF LESS THAN 15 MIN.
2) BACKTEST RESULTS ASSUME EXITS AT DAY CLOSE ONLY AND NOT BASED ON ANY OTHER CONDITIONS. HENCE ONCE LONG OR SHORT INITIATED IT IS SUGGESTED TO EXIT USING TRAILING STOP OR YOUR OWN RISK APPETITE. EVEN DAY CLOSE INTRADAY EXITS OFFERS A FAIRLY GOOD RESULT WITH ABOVE AVERAGE SUCCESS RATE AND PROFIT FACTOR IN EXCESS OF 1.75.
3) STRATEGY IS BASED ON COMBINATION OF PATTERNS INVOLVING DAILY PIVOTS AND PREV DAY LEVELS THAT IS FOUND TO REPEAT IN BANKNIFTY.
THE DETAILS OF THE STRATEGY IS CONFIDENTIAL.
4) THIS WILL BE AVAILABLE PUBLICLY ONLY FOR A LIMITED PERIOD. THIS LIMITED PERIOD AVAILABILITY IS TO TEST THE RESULTS AMONG VARIOUS PARTICIPANTS INORDER TO SEE THE CONSISTENCY.
YOU CAN REACH ME AT MY TWITTER ID scorpiomanojfrm or my email scorpiomanojfrm AT gmail DOT com
Price Action + Bollinger Strategy Simple Price Action + Bollinger Band Strategy
Buy Setup --------
- Price closes below Bollinger Band
- Last candle closes in green, confirming bulls have returned
- Buy trade is taken
Short Setup --------
- Price closes above Bollinger Band
- Last candle closes in red , confirming bears have returned
- Short trade is taken
Strategy open for suggestions and updation

RvZ - Reversal Zones Indicator..!Hello Traders...!
Yet another indicator from myself following to my previous indicator "FIRST-5-MINUTES-ZONE-AND-HI-LO-BRKOUTS",
this is TO IDENTIFY INTRADAY REVERSAL ZONES...!!!
- It works on any time frame
- along with those zones i have added two more lines Red and Green which will be used as Intraday Resistance and Support lines .
- Pls donot expect Profit and Stop points, that is upto you.
- If market goes beyond those zones well then consider that market is trading stronger. So..trade with strict stops accordingly. If the market goes beyond those zones then LOOK LEFT for the previous zones and trade.
- 80% of time, the market respects those zones.
- The zones colours are CUSTOMIZABLE
- A simple strategy to use this in confluence with,
RSI (7) Range , EMA (100)
**** If stock trading above 100 EMA, Rsi in overbought, price in upper reversal zones, then voila...get some sack ready to fill the money...!!! same goes for opposite side *****
well then Traders, Enjoy and let's put some money in Bank....!!!!!
--cheers,
Sanjay Ramanathan
