Double BB + Multi Ema Supports 2.0 // by Mochero Use this indicator to identify the market trend, possible dynamic support or resistance, and possible reversals or corrections.
Take the moving averages (50,75,100,200) as a reference to identify whether the market is bullish or bearish.
Use the Parabolic Sar, to identify minor trends.
Take as reference the Moving Averages (5,9,15,25) as possible support or dynamic resistance.
You can also use a DEMA 9.
This indicator marks past Supports and Resistances to have a reference and mark reversal zones.
Take the BB as a reference, to identify possible setbacks or trend changes.
Added a third BB (optional).
-Added 3 types of signals, with RSI, Stoch, DMI. They indicate possible reversals or changes in trends.
Suggested values
-RSI 4
-Stoch 1 (5,1,1)
-Stoch 2 (14,1,1)
-DMI (10, 3)
BB

Advanced Bollinger Bands StrategyAdvanced Bollinger Bands Strategy
Why is it an advanced Bollinger Bands Strategy?
The purpose of Bollinger Bands is to provide a relative definition of high and low prices of a market. By definition, prices are high at the upper band and low at the lower band. This definition can aid in rigorous pattern recognition and is useful in comparing price action to the action of indicators to arrive at systematic trading decisions. Adding a Moving Average filter which only allows trades if MA and Price are outside of the BB increases the probability of profitable trades with the sacrifice of a lower trade-frequency.
Inputs for Bollinger Bands
-> BB Source
-> BB Length
-> BB Multiplier
-> Moving Average Period
-> Moving Average Source
-> Strategy Condition Options:
-> Exit Trades if Price crosses Basis Line
-> Enable Moving Average Filter

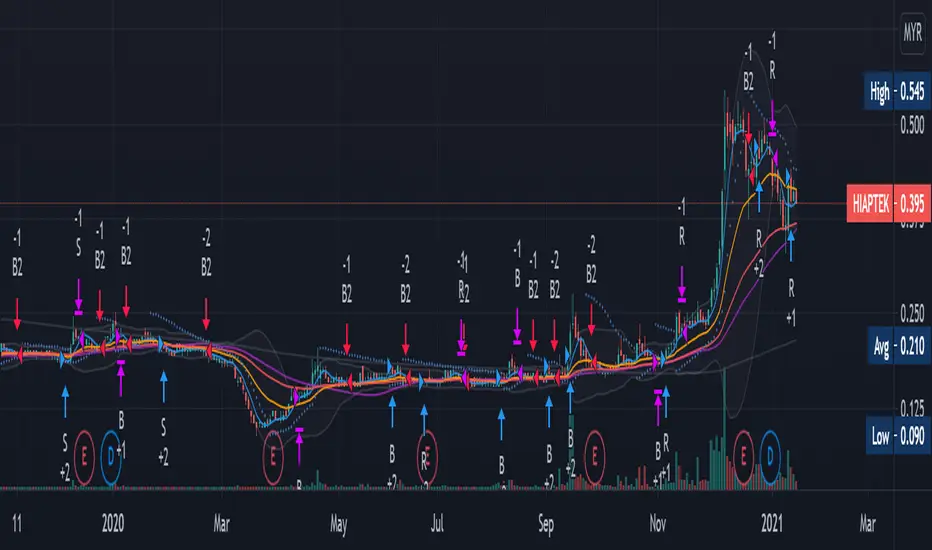
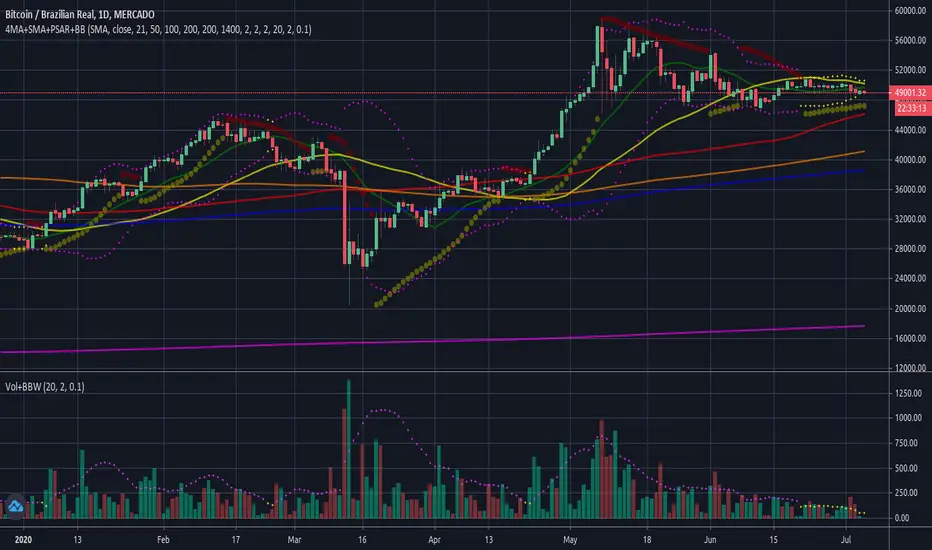
Renovation-10 (Including 10 Traditional Indicators)This idea is not rare. It is just a combination of 10 most well know and traditional Indicators to form one renovated indicator. There are Moving Average (MA), Volume (V), Bollinger Band (BB), Relative Strength Index ( RSI ), Stochastic RSI, Modified Stochastic RSI, Moving Average Convergence Divergence ( MACD ), Average directional index ( ADX ), Average True Range (ATR) and Parabolic Stop and Reverse (PSAR). These indicators most I found was just showing entering position strategic alone. I just want to know how well them work together when combination. I modified many times and thinking for the strategic enter and exist position with the choice of these 10 indicators to maximize the profitability which shows in strategic tester in every stock and conditions.
THEORY:
Fluctuation of price is like a Wave which I categorized it into four period. They are Sideway, Breakout Positive and Negative, Retracement and Consolidation. Breakout is rare to happen, either go up or go down. After a breakout usually will have small retracement, then trend will go for sideway. After long period of sideway, the wave is starting to run out of energy and there will be consolidation period.
STRATEGIC OPTION:
S: Sideway Period
B: Breakout Period
R: Retracement Period
(+): Buy
(-): Sell
PROBLEM:
1. Not performing very well at very penny stock which the graph looks like barcode.
Suggesting can change daily graph to weekly graph to avoid.
2. Be careful with Sideway entry signal because sometimes price may continue go down. You will stuck at middle if you enter without confirmation.
Confirm the price is stable at support by current low is higher or equal to past three to five day low before entry.
3.Always remember Breakout is rare, do not push for luck
Always make profit at Sideway and Retracement trend. Can Sell half only at BB when breakout buying signal is available, to avoid losing chance of chasing breakout.
4. Breakout selling signal 2 may delay
After breakout, make sure sell all when 2-3 red candle appeared or When BB is squeezing.
5. Other tools may required to confirm entry position.
These combination strategic is more to personal experiences and knowledges, it hard to adjust in coding for strategic position.
This is my first publication and I just do it for fun, having fun in reading the script and creating own ideas.
Information provided is only educational and sharing , should not be used to take action in the markets.
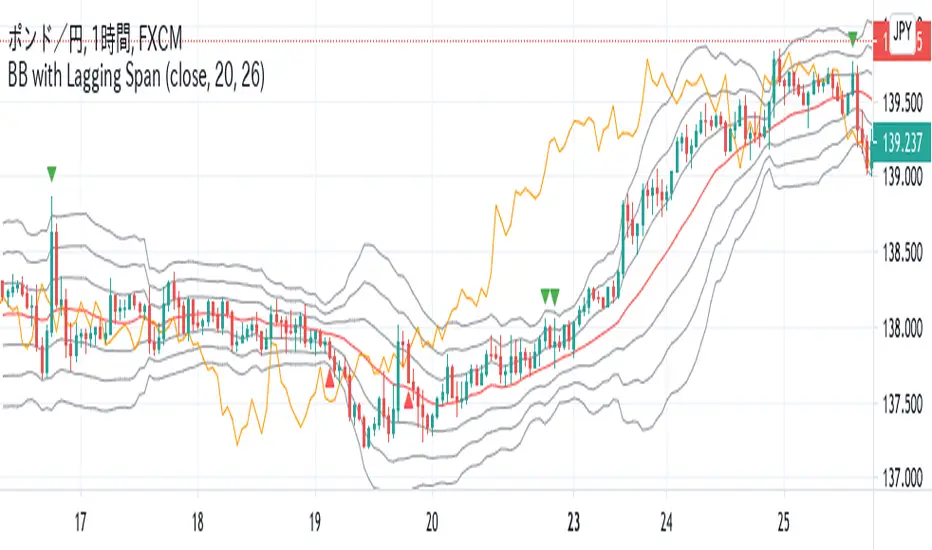
Bollinger Bands with Lagging Span(Chikou Span)Japanese below / 日本語説明は下記
Summary
This indicator shows Bollinger bands with plus/minus 3σ bands and lagging span(called chikou span in Japanese as used in Ichimoku cloud) showing alert when lagging span crossing plus/minus 2σ bands, which are buy/sell signal respectively.
Bollinger bands are one of frequently used technical analysis indicators in trading and some traders use Bollinger bands and lagging span together in order to identify trading opportunities.
When lagging span crosses upper bands in bullish trend and lower bands in bearish trend, that would be considered buying/selling opportunities respectively.
Generally, lagging span is used offsetting current price by 26 period.
This indicator shows signal and alerts when lagging span crossing ±2σ bands as potential trading opportunities.
Functions
-To show Bollinger bands with plus/minus 3 sigma bands
-To show SMA as Bollinger bands middle line with configurable period of SMA.
-To show lagging span, enabling users to set lagging period and control display of lagging span by checkbox
-To show signal on chart when lagging span crosses +2σ bands and -2σ band with ability to set alert
-To control display of the signal by checkbox
Sample chart with the indicator
——————————————————————————————
概要
ボリンジャーバンド(±3シグマ)と遅行スパンを同時に表示するインジケーターです。遅行スパンが±2シグマと交差するとチャート上にシグナルを表示するとともに、アラートを設定することができます。
ボリンジャーバンドはテクニカル分析で最も使われているインジケーターの一つです。トレーダーの中にはボリンジャーバンドと遅行スパンを共に用いることで売り買いのサインを捉える手法を使っている方もいます。
上昇トレンドにおいては、遅行スパンがプラスのバンドを上抜いた時を買いサイン、下降トレンドにおいては、遅行スパンがマイナスのバンドを下抜いた時を売りサインとして捉えるものです。
一般的には、遅行スパンは現在価格を26期間オフセットしたラインが用いられます。
このインジケーターでは、遅行スパンがプラスマイナス2シグマを抜いた時にチャートへのシグナル表示と、アラート設定が可能です。
機能
-±1-3シグマのボリンジャーバンドの表示
-ボリンジャーバンドの基準線としてのSMAの表示(期間は設定可能)
-遅行スパンの表示(遅行期間の設定及び表示非表示の切り替え可能)
-遅行スパンがプラス2シグマバンドを上抜いた場合、マイナス2シグマバンドを下抜いた場合にチャート上にシグナルを表示(同じ条件でアラート設定が可能)
-シグナルの表示・非表示の切り替え
サンプルチャート
Simple Bollinger Bands Toolkit™TradeChartist Simple Bollinger Bands Toolkit is a useful set of Bollinger Bands based utilities, which includes 0 mean %B Oscillator , price volatility based BB Width , actual Bollinger Bands and BB Breakout Signals .
===================================================================================================================
™TradeChartist Simple Bollinger Bands Toolkit Features
================================================
Modified %B Oscillator with 0 as its mean
%B Oscillator Over-Bought (typically values > 80/90/100) and Over-Sold zones (typically values < - 80/-90/-100) can be displayed by enabling Show Over-Sold/Over-Bought Zones .
Highs and Lows of the %B Oscillator are displayed to help visualize Divergences.
BB Width as Price Volatility (BB Upper Band - BB Lower Band) can be displayed to visualize BB Squeeze zones.
Actual Bollinger Bands can be plotted by enabling Display Bollinger Bands . To display on main price chart, just move the BB Toolkit to price chart and merge the scales.
Breakout Signals can be displayed by enabling Display Bollinger Bands and Show BB Breakout Signals . This also displays background fill to help visualize the zones since the breakouts of upper/lower bands happened.
The BB Basis/Mean line is colour coded based on the %B Oscillator (%B>0 - Green, %B<0 - Red).
The Toolkit uses Simple Moving Average (SMA) for the basis line.
The default length is 55 and default Standard Deviation is 1. %B Oscillator can be smoothed (default - 5) using EMA to minimize noise. (Use 20 length and 2 standard deviation for classic Bollinger Bands).
Price Bars on the Main Price chart can be coloured by enabling BB Colour Bars .
===================================================================================================================

Long only strategy VWAP with BB and Golden Cross EMA50/200
This is strategy, mainly designed for stock markets
It makes uses of the EMA 50/ 200 ( Golden cross) and VWAP and Bollinger bands.
It only takes long positions. It can be adapted to all time frames, but preferably to be used with longer timeframes 1h +
The rules for entry are the next ones :
1. EMA50 > EMA 200
2. if current close > vwap session value
3. check if price dipped BB lower band for any of last 10 candles
EXIT RULE
1. price closes above BB upper
STOP LOSS EXIT
1. As configured --- default is set to 1%

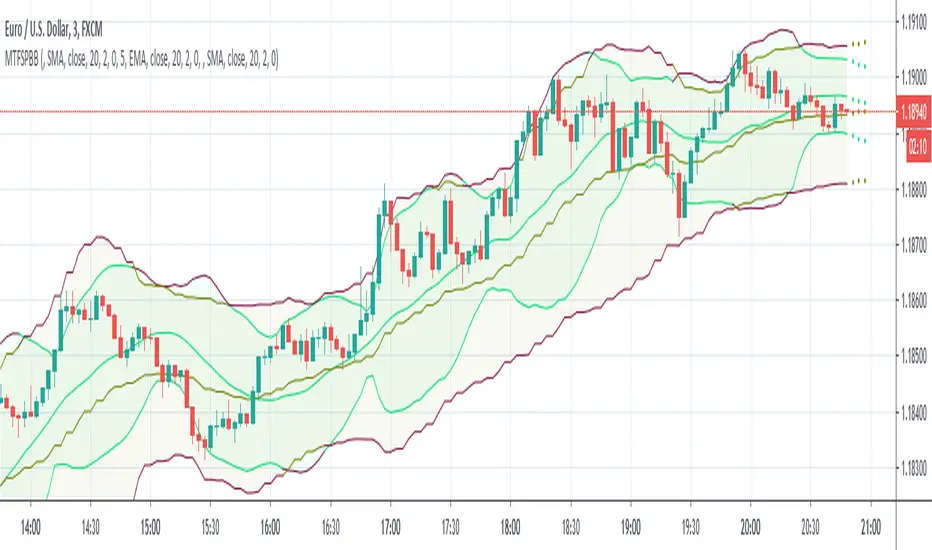
Multi Time Frame Bollinger Bands(Daily/4H/1H)/MTFボリンジャーバンドJapanese below. / 日本語説明は下記
-----Republishing after issues resolved.---------
Summary
This indicator shows 3 multi time frame Bollinger bands (MTF BB) from different time frames which is daily, 4 hour and 1 hour to lower time frames with 3 bands(+-1-3ς).
Example: If you set daily BB, it will be shown on daily, 4hour, 1hour, 30M, 15M, 5M and 1M charts. It will not appear on weekly and monthly charts as it is not necessary to see it on higher time frames.
Purpose
This indicator has been developed to show higher timeframe’s BB as they are expected to work as support and resistance .
How is it different from other BB indicators?
Problems with other conventional BB indicators are;
-If you set higher timeframe BB(MTF BB), it will also be shown on further higher time frames.
i.e. If you set 4hour chart BB on 1 hour or lower time frame charts, it will also appear on daily and weekly chart, which is not necessary.
-One indicator displays one BB only which impacts the number of indicators that you can set(depending on your account plan)
-One indicator displays one band only. If you need 1-3ς, you need to add the same BB indicator.
To tackle these problems, this indicator has incorporated functions below.
-Control timeframes where BB is displayed to eliminate unnecessary information on higher time frames.
-One indicator contains 3 BB with 3 bands(minus 1-3ς & plus 1-3ς) which contributes to save the number of indicators that you can set.
These are the value added on this indicator.
Spec
-This indicator shows daily BB, 4 hour BB and 1 hour BB.
To be clear, daily BB means that BB created based on daily chart , which can be shown on lower timeframes.
-Each BB displays 3 bands(minus 1-3ς & plus 1-3ς) and middle line
-Display of each band can be parameterized to show and not to show
e.g. Showing only plus/minus 2 and 3ς etc.
-The middle line adopts SMA ( simple moving average ) only and you can set period of SMA .
-Each BB will be shown as follows based on timeframes that you select.
Daily BB: Shown on daily, 4hour, 1 hour, 30M, 15M, 5M and 1M chart
(Weekly and Monthly chart does not show BB)
4hour BB: Shown on 4hour, 1 hour, 30M, 15M, 5M and 1M chart
(Daily, Weekly and Monthly chart does not show BB)
1hour BB: Shown on 1 hour, 30M, 15M, 5M and 1M chart
(4hour, Daily, Weekly and Monthly chart does not show BB)
-Each BB can be enabled and disabled by ticking checkbox.
e.g. On 1 hour chart, you can disable 4 hour BB and show daily BB only etc.
Please see the sample chart below.
Sample chart with the indicator
Daily chart
4hour chart showing daily BB and 4H BB
1hour chart showing daily BB, 4H BB and 1H BB
5Mchart showing daily BB, 4H BB and 1H BB
Journey to use indicator
This indicator is paid indicator and invited-only indicator.
Please contact me via private chat or follow links in my signature so that we can initiate the process to access the indicator
--------------------------------------------------------------------------------------------------
日足、4時間足、1時間足の3つのボリンジャーバンド(プラスマイナス1-3シグマのバンド)を下位足含めて表示するマルチタイムフレームボリンジャーバンドのインジケーターです。
インジケーターの目的
上位足のボリンジャーバンドを下位足に表示することで、レジサポの判断に使うことを想定しています。
他のボリンジャーバンドインジケーターとの違い
他のボリンジャーバンドインジケーターでは、よく以下の問題に直面します。
・上位足のボリンジャーバンドを表示しようとすると、さらに上位足でもそのバンドが表示されチャートがみにくくなる。
例: 4時間足のボリンジャーバンドを下位足で表示可能な様に設定すると、日足や週足でも表示され、チャートがノイズだらけに・・・
・一つのインジケーターでは一つのボリンジャーバンドのみ表示。異なる時間軸のボリンジャーバンドを表示しようとするとその数だけインジケーターを追加する必要あり。
・バンドが一つしか設定できず、1-3シグマまで表示しようとするとインジケーターを追加する必要がある。
これらの問題に対して、このインジケーターでは、
・ボリンジャーバンドを表示する時間軸を制御することで上位足側で不必要な情報を表示させない。これによりチャートをスッキリ見やすくすることができる。
・一つのインジケーターで3つの異なる時間軸のボリンジャーバンドを表示し、かつそれぞれでプラスマイナス1-3のバンドを表示することでインジケーター数を節約。
という機能を加えることでこれらの問題を解決しています。
これがこのインジケーターが提供する付加価値だと考えています。
仕様
機能概要
・このインジケーターでは日足、4時間足、1時間足の3つの時間軸のボリンジャーバンドを表示します。
・それぞれのボリンジャーバンドはプラスマイナス1-3シグマまでのバンドと基準線を表示します。
・各バンドは表示・非表示の切り替えが可能です。(例: プラスマイナス2、3シグマのみ表示など)
・各ボリンジャーバンドの基準線(ミドルライン)はSMA(単純移動平均線)です。移動平均線の期間は自由に設定できます。
・各ボリンジャーバンドは表示しているチャートの時間軸に応じて以下の様に表示されます。
日足のボリンジャーバンド : 日足, 4時間足、1時間足、30分足、15分足、5分足、1分足チャートにのみ表示(週足以上では非表示の仕様です。)
4時間足のボリンジャーバンド : 4時間足、1時間足、30分足、15分足、5分足、1分足チャートにのみ表示(日足以上では非表示の仕様です。)
1時間足のボリンジャーバンド : 1時間足、30分足、15分足、5分足、1分足チャートにのみ表示(4時間足以上では非表示の仕様です。)
・各ボリンジャーバンドは表示・非表示のフラグをON/OFFにすることで表示を制御することができます。
例えば1時間足のチャートでは日足のボリンジャーバンドのみを表示し、4時間足のボリンジャーバンドを表示させない、など。
サンプルチャート
日足
日足では日足ボリンジャーバンドしか表示されない設定ですので、4時間足や1時間足の設定が邪魔になりません。
ここが他のボリンジャーバンドインジケーターと違う点です。
4時間足
4時間足に日足と4時間足のボリンジャーバンドを表示した状態です。不要な場面では両方もしくはいずれか一方を非表示にすることができます。
1時間足
1時間足に日足と4時間足と1時間足のボリンジャーバンドを表示した状態です。
5分足
5分足に全てのボリンジャーバンドを表示したチャートです。
短期トレードで上位足ボリンジャーバンドによる反発を狙う時などに活用できるのではないでしょうか。
インジケーターの使用について
当インジケーターは招待制インジケーター(有料)となっています。
使用を希望される方はプライベートチャットや下記リンクのDMでご連絡ください。
このページのコメント欄はインジケーターそのものに対するコメントやアップデートの記載のためのものとなっております。Tradingviewのハウスルールを守るためにもコメント欄からの連絡はご遠慮ください。
HuD IntradayConsist of :
- standard Bollinger Band (BB) - MA20 and 2 dev
- EMA ( default 9,20,50 and 200)
- WMA ( 5 and 10 )
- Donchian Channel
Suitable for intraday trading - 15min, 30 min or 1 hour timeframe
Trading Strategy :
1. Enter trade only when
- band is Green
- line EMA20 above EMA50 and line EMA50 above EMA200 ( black > purple > red )
- RSI (default setting 14) is above level 50 and trend is positive (RSI line moving upward)
2. Possible Entry point ( 3 options )
i Breakout candle and candle still below lower BB
ii Retracement/Pullback - after Breakout and candle still inside green band. RSI still above 50
iii. Buy on Weakness (BOW) - Blue diamond icon
3. Stop Loss :
- Select "Show Stop Loss" - to display stop loss line
- Based on ATR
- adjustable depend on trader risk
Other option for stop loss :
- WMA Area ( Dark green ) - candle cross under WMA, can consider to exit trade
- EMA20 - candle cross under EMA20, can consider to exit trade.
4. Alert
Therea are 3 alerts availabe
i. Breakout signal
ii. Sell signal - candle break trailing Stop
iii. BOW - Buy on weakness signal
Note :
- This indicator only suitable for Bursa Malaysia
- Do PM me if you interested

Easy System 420In this strategy, 15 indicators are used, each giving its results as a numerical value, which then is added or subtracted from the total points, gathered from all 15 indicators.
Many thanks to RafaelZioni for his great work making the EasySys1 script which i modified to create this script.
Onchart is drawn some of the indicators, but not all, a info panel is drawn showing the value each indicator has calculated. The info panel can be turned on or off.
Many of the indicator settings can be changed by user, and this is recommended, to tune the strategy to users chosen pair/timeframe.
Therefore any pair or timeframe can be used, the strategy tester results showing possible results, remember to set commission to match your broker. example chart settings here have common crypto exchange commission value: 0.25%
indicator list : SAR + STT + ZigZag + ROC + DMI + CCI + Weis + SMA + AO + MOM + Hist + BB + Ichimoku + HMA

BB Indicator - Marks High and low of premarket,daily,yesterdayThis indicator marks what is known as the BB system - Marks on your chart the premarket high and low, current intraday high and low and yesterday's high and low. For the style of the line you can only change the colour, if you make the line a different style it shouldn't show up because if it did it makes the lines ugly.
Pick and select which levels you would like using the indicator and you can also turn on and off the labels if you don't want them.

bb5 1-15-240: why i upload this here
This script is protected only. no need invitation.
that is why i upload here. very good?
but it works only for 1min, 15min and 4h candle.
: what is this script
This script show 5 BB.
you can see arrow if price hit BB.
5 band, 5 arrow color.
It has many option you can set.
you can choose sma, ema, rma .....
and there are many option like that.
you can change formular of BB to my own Band(Oringan).
: you may wanna chack this out
in this version, you can not use unit alert.
for unit alert, use this

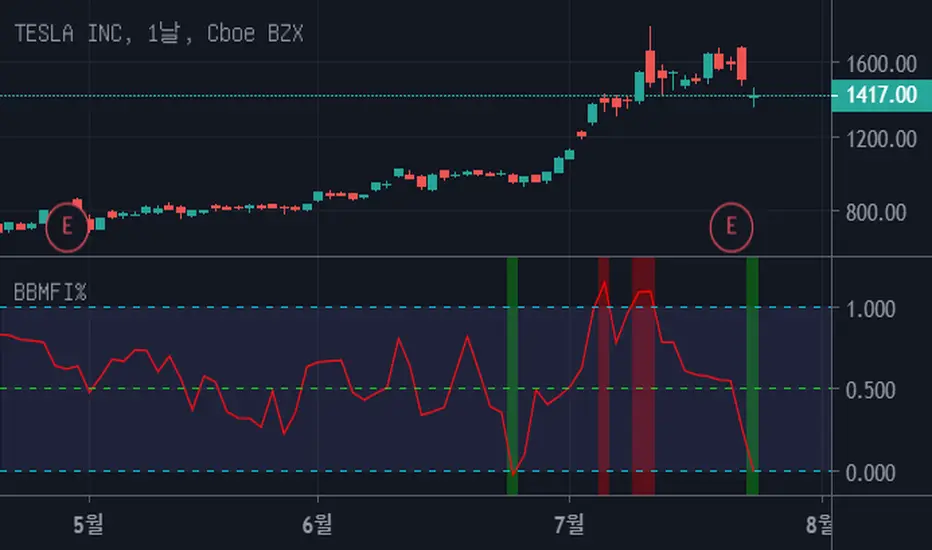
Bollinger Bands Money Flow Index %This script is similar to the previous one "Bollinger Bands Money Flow Index" but it's a little easier to interpret.
Fix the top line of the "BBMFI" to 1, and the bottom line to 0.
Indicates where "Money Flow Index" is located between the top and bottom lines.
If it's bigger than 1, it's overbuying. If it's less than 0, it's overselling.
Consider a trade if you are out of range from 0 to 1.
It's also a good trade timing to out of range and come back in.
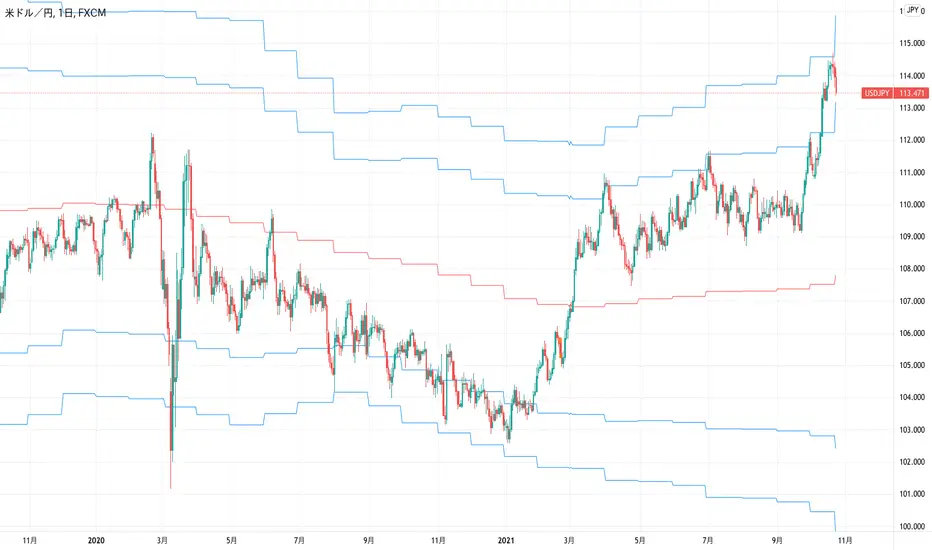
MultiTimeFrame Shifting Predictive Bollinger BandsThis is the optimized version of my MTFSBB indicator with capability of possible bands prediction in case of negative shifting (to the left).
Make me happy by using it and sending me your ideas about the prediction.
Fibonacci Bollinger Bands Alerts [QuantNomad]These are alerts for my Fibonacci Bollinger Bands Strategy. You can find more details and strategy description in it:
It's a pro indicator, you can have access to it for a small fee. Link to my PRO indicators you can find in my signature.
Disclaimer
Please remember that past performance may not be indicative of future results.
Due to various factors, including changing market conditions, the strategy may no longer perform as good as in historical backtesting.
This post and the script don’t provide any financial advice.
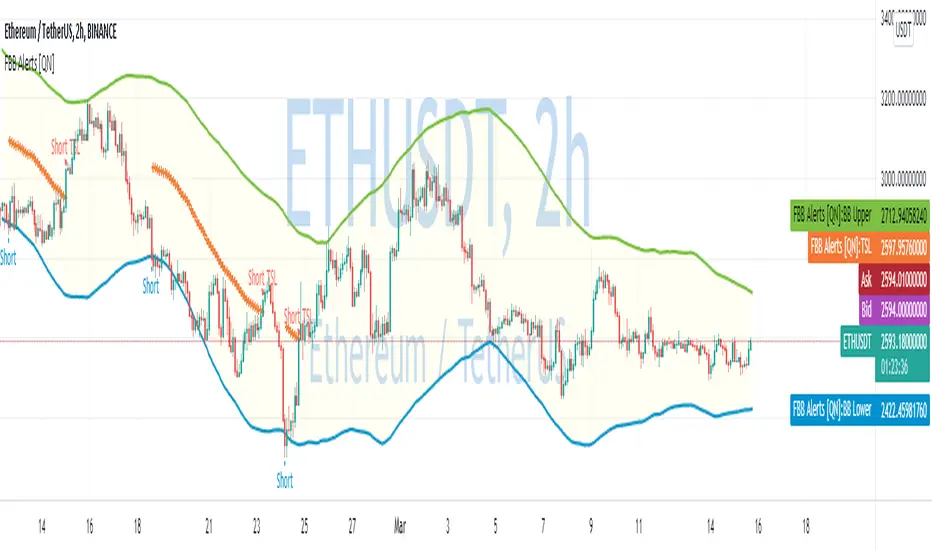
Fibonacci Bollinger Bands Strategy [QuantNomad]This strategy is modified Stanard Bollinger Bands Strategy. Instead of using standard deviation, I use a metric of how big is the range for the last X bars. Also, I’m using Fibonacci levels as multipliers for BB.
In this strategy you have a choice of 3 different Trailing Stop Loss types:
Standard % – standard percent based TSL
Fibonacci Level – close your position on another Fibonacci level or basis line of BB.
Parabolic SAR – Parabolic SAR adapted as trailing stop loss.
For Standard % and Parabolic SAR, you can use the “TSL Offset” parameter to set an initial offset for trailing stop loss.
Parameters
BB Length – Bolinger Bands Length
Fib Entry Level – Entry BB Multiplier level. Can be one of Fibonacci levels: 0.236, 0.382, 0.5, 0.618, 0.786, 1.000
Trailing SL Type – Type of Trailing Stop Loss used to close positions. Can be one of 3 types: “Standard %”, “Fibonacci Level”, “Parabolic SAR”
TSL Offset (%) – Initial offset for TSL. Applicable to “Standard %” and “Parabolic SAR”
TSL Fib Level – Fibonacci level used for “Fibonacci level” type of TSL
TSL PSAR Start / Increment / Maximum – parameters for PSAR type of TSL.
Strategy side – you can choose the side of the strategy. You can require strategy to go only Long, Short to Both sides.
From/To Day/Month/Year – you can use these parameters to set backtesting range to check the performance of your strategy on a specific range
It's a pro indicator, you can have access to it for a small fee. Link to my PRO indicators you can find in my signature.
Disclaimer
Please remember that past performance may not be indicative of future results.
Due to various factors, including changing market conditions, the strategy may no longer perform as good as in historical backtesting.
This post and the script don’t provide any financial advice.

Double BB + Multi Ema Use this indicator to identify the market trend, possible dynamic Supports or Resistances and possible setbacks or corrections.
Take the Moving Averages (50,75,100,200) as a reference to identify if the market is bullish or bearish.
Have as reference the Moving Averages (8,15,20,25) as possible dynamic Supports or Resistances.
Have the BB as a reference, to identify possible setbacks or changes in trends.

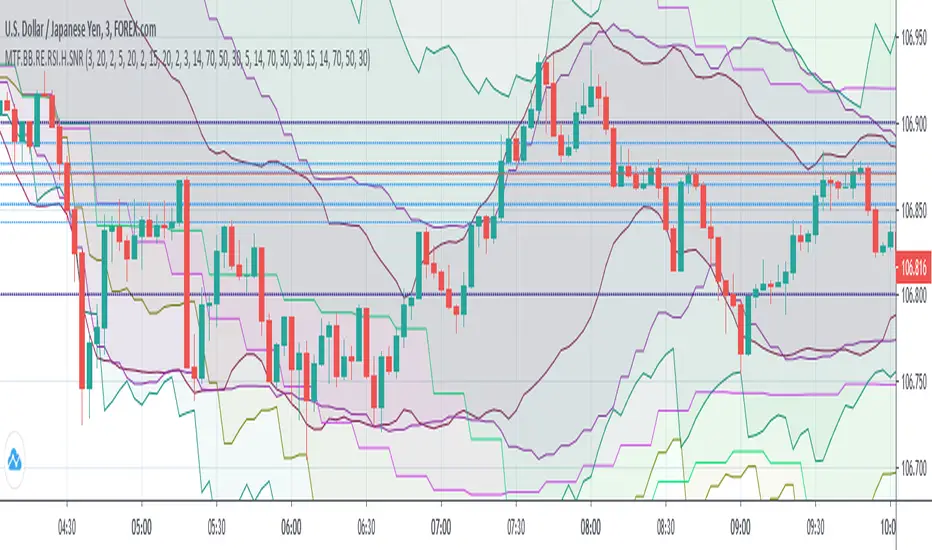
(MTF) Bollinger Bands + RE RSIs + Hidden Supports & ResistancesI merged some of my previous written indicators, because a combination of multi-timeframe Bollinger Bands, RE RSI and Resistance/Support levels could help a lot.
Don't forget to add my other useful indicator (Classical SnR) to the chart to maximize your profit!
Enigma (STRATEGY)Based on volatility algorithm that measures changes in market prices over a period of time.
Trading Rules
1. Go long when the buy signal appears.
2. Go short when the sell signal appears.
3. Close the position when the take profit signal appears.
4. Risk 2-5% of porfolio max.
5. Use stop loss of 3% from entry.
Please PM me for access.

VI BB RSI CRSI MFI - All In OneThis script simply creates a combo of some indicators I have found to be useful to visualize together.
Its fairly simple to use... buy the red and sell the green. The red and green 'zones' are VI indicator plus and minus using color to identify instead of plotting the lines and creating more mess for us.
The blue line is our BB B%... and the solid lines are the buy and sell thresholds.
The yellow line is our RSI, and the dotted lines are the thresholds.
The orange CRSI line is for intrazone (red or green VI zone) trades.. for instance, buying in the sell zone and then selling again (dead cats) and vice versa.
Lastly the purple MFI plot can be useful in identifying trend reversals.
This is not secret code, its free for everyone to use. If you find that it is too cluttered, you can simply comment out the plot function for that indicator to disable the ones that you find most cluttering.
Feedback is appreciated, along with ideas or suggestions.. cheers and happy trading!

The Complex"Red Line" vs Simple"White Line" Moving Average "BetaThis is my 2nd real attempt at an indicator for tradingview...
I have made this using the BTC/USD chart for coinbase, but this should work for any chart on the site/app...
It seems to go well with the "MACD" if you do change the input for the MACD, I know it shows up with "The Complete vs Simple Moving Average" two times... And they do give different outputs, so it's up to you to see what fits you best... One way you can use it is, use one line as a get "Ready" and the other one to "Sell" on any time frame, but I look longer and then look shorter to make my calls, I hope that makes sense to you as a reader...
So let me know what you think about this and happy trading...
Justin

WOMBO COMBO: EMA & VWAP & MACD & BB & STCHello my fellow investors,
After hours of reading, backtesting, and YouTube video watching I discovered that EMA, VWAP, BB, MACD, and STC produce the most consistent results for investment planning. This strategy allows you to pick between the aforementioned indicators or layer them together.
It works on the pricipal of:
1) Always follow the market trend - buy/sell above/below 200EMA
2) Follow corporate investing trends - buy/sell above/below VWAP
3) Apply MACD check - buy--> MACD line above signal line and corssover below histogram \\ sell --> MACD line below signal line and crossover above histogram.
4) Check volitility with price against BB limits upper/Sell or lower/buy
5) When STC crosses about 10 buy and when it drops below 90 sell
6) Exit position when stop loss is triggered or profit target is hit. BB also provides a parameter to exit positions.
This code is the product of many hours of hard work on the part of the greater tradingview community. The credit goes to everyone in the community who has put code out there for the greater good.

MultiTimeFrame Shifting Bollinger BandsJust 3 Bollinger Bands with different adjustable timeframes plus shifting (left/right) capability and non-integer deviation values.
I wrote this because I couldn't find the perfect BB indicator that matches my needs. Feel free to use it.
