Master Indicator (Sessões + DWM + Lookback)Developed to track sessions in Asia, London, and New York.
With it, you can track the highs and lows of the sessions, as well as their captures.
You will also be able to view the highs and lows of days, weeks, and months in as many periods as you want.
All functions can be viewed in specific timeframes; adjust as needed for your trading strategy.
Finally, you will also have the option to configure midnight open and true day open.
Indicatori di Bill Williams

LeO Nam - Thỏ TraderHello everyone, this indicator is designed to help you fight across all battlefields with a minimum win rate of 70% or higher. It can be used on multiple timeframes and delivers the highest efficiency on the M5 and M15 timeframes, which currently offer the best win-rate performance.
The indicator already includes full TP/SL levels — you simply need to follow the signals.
Note: When using the AE indicator, you must strictly follow the trading rules, enter only at valid breakout signals, set proper TP/SL, and apply proper risk management. Absolutely do NOT go all-in.

Evergito HH/LL 3 Señales + ATR SLHow to trade with the Evergito HH/LL 3 Signals + ATR SL indicator? Brief and direct explanation: General system logic: The indicator looks for actual breakouts of the high/low of the last 20 bars (HH/LL) and combines them with the position relative to the 200 SMA to filter the underlying trend. You have 3 types of signals that you can activate/deactivate separately: Signal
When it appears
What it means in practice
Entry type
V1
HH breakout + the close crosses above the 200 SMA (or the opposite in a short position)
Very safe entry confirmed. The price has just validated the long/flat trend → safer and with a better ratio
The most reliable (the original)
V2
HH breakout but the price was already above the 200 SMA (or already below in a short position)
Entry in an already established trend. Fewer “surprises”, more continuity
Ideal for strong trends
V3
Only the breakout of the HH or LL, without looking at the 200 SMA
Aggressive entry/scalping on explosive breakouts. More signals, more noise.
For times of high volatility.
How to enter the market (simple rule): Wait for any of the 3 labels (V1, V2, or V3) to appear, depending on which ones you have activated.
Enter at the close of that candle (or at the open of the next one if you are conservative).
Automatic Stop Loss → the blue (long) or yellow (short) line that represents the ATR x2.
Take Profit → you decide, but the indicator already gives you the visual reference for the risk (ATR x2), so 1:2 or 1:3 is usually very convenient.
Practical example: You see a large green label “HH LONG V1” → you go long at the close of that candle. Stop right at the blue line (ATR x2 below the price).
Typical target: 2x or 3x the risk (very common to reach it in a trend).
Recommended use: Most traders leave only V1 activated → fewer signals but very high quality.
Those who trade intraday or crypto usually combine V1 + V2.
V3 only for news events or very volatile openings.
In summary:
Label = immediate entry
Blue/yellow line = automatic stop
And enjoy the move.

VietNguyen Buy_Sell VIPThis is indicator of Vietnammes, it is very good for trade Gold and Crypto.
Cre by: VietNguyenDN

Мой скриптinputs:
window(1),
type(0), // 0: close, 1: high low, 2: fractals up down, 3: new fractals
persistent(False),
exittype(1),
nbars(160),
adxthres(40),
nstop(3000);
vars:
currentSwingLow(0),
currentSwingHigh(0),
trailStructureValid(false),
downFractal(0),
upFractal(0),
breakStructureHigh(0),
breakStructureLow(0),
BoS_H(0),
BoS_L(0),
Regime(0),
Last_BoS_L(0),
Last_BoS_H(0),
PeakfilterX(false);
BoS(window,persistent,type,Bos_H,BoS_L,upFractal,downFractal,breakStructureHigh,breakStructureLow);
//BOS Regime
If BoS_H <> 0 then begin
Regime = 1; // Bullish
Last_BoS_H = BoS_H ;
end;
If BoS_L <> 0 Then begin
Regime = -1; // Bearish
Last_BoS_L = BoS_L ;
end;
//Entry Logic: if we are in BoS regime then wait for break swing to entry
if ADX(5) of data2 < adxthres then begin
if time>900 and Regime = 1 and EntriesToday(date)= 0 and Last_BoS_H upFractal then buy next bar at market;
end;
if time>900 and EntriesToday(date)= 0 and Regime = -1 and Last_BoS_L>downFractal then
begin
if close < downFractal then sellshort next bar at market;
end;
end;
// Exits: nbars or stoploss or at the end of the day
if marketposition <> 0 and barssinceentry >nbars then begin
sell next bar at market;
buytocover next bar at market;
end;
setstoploss(nstop);
setexitonclose;

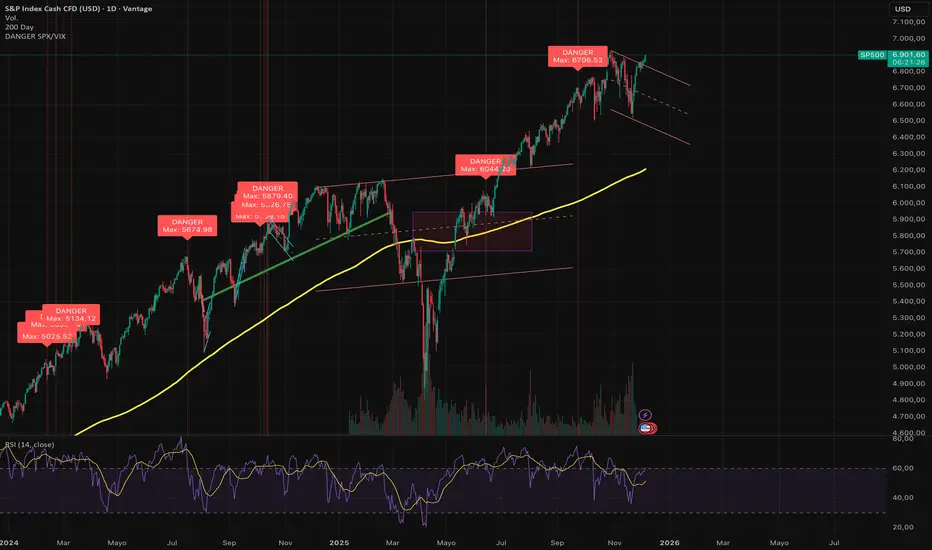
DANGER SP500This indicator is designed to identify severe correlation anomalies between the Volatility Index (VIX) and the S&P 500 (SPX). It operates on the premise that a simultaneous rise in both assets often precedes market corrections or significant local tops.
The underlying concept is "fear in the rally": investors are buying equities (driving price up), but at the same time, they are aggressively buying protection (Puts), causing the VIX to spike.
⚠️ Strict Usage Rules
To guarantee the mathematical reliability of the VIX data, this indicator includes strict security restrictions:
EXCLUSIVE ASSET: Designed solely for the S&P 500 (SPX, SPY, US500, ES1!). It should not be used on Crypto or Forex, as the VIX correlation does not apply in the same way.
LOCKED TIMEFRAME: It only functions on the Daily Chart (1D).
Note: The script includes a runtime.error block that will prevent execution if you attempt to load it on intraday charts (H1, H4, etc.) to avoid false signals caused by market noise.
Visualization
Red Background: Visually highlights the exact moment the alert is triggered.
"DANGER" Label: Prints clearly above the signaled bar.
Max Price Display: Unlike other indicators that mark the close, this tool specifically labels the HIGH of the candle, allowing you to identify the exact point of price extension.
🔔 Alerts
The script is ready for TradingView Alerts. The alert message is dynamic and will include the exact High price reached during the signal candle.
Disclaimer: This script is for technical analysis purposes only and does not constitute financial advice. Trading involves risk.
teril Harami Reversal Alerts BB Touch (Wick Filter Added) teril Harami Reversal Alerts BB Touch (Wick Filter Added)
teril Harami Reversal Alerts BB Touch (Wick Filter Added) teril Harami Reversal Alerts BB Touch (Wick Filter Added) teril Harami Reversal Alerts BB Touch (Wick Filter Added)
teril Harami Reversal Alerts BB Touch (Wick Filter Added)

MAX TRADEMAX TRADE is a smart trend-following indicator designed for Forex and XAUUSD. It uses a dynamic channel with Fibonacci levels to generate clear LONG and SHORT signals on any timeframe. The script supports fixed pip SL/TP, partial take profits, break-even logic and optional EMA/RSI/ATR filters to avoid bad entries. It also tracks win rate and total percent profit in real time so you can quickly see how the strategy is performing on your backtests.

MAX TRADE ZONA simple session level indicator for XAUUSD on the M5 timeframe. It takes the high and low of the 00:45 candle (Asia/Tashkent time), draws infinite horizontal lines from that candle, and keeps only the most recent 7 days. Useful for intraday support and resistance levels.

67 2.0Major Market Trading Hours
New York Stock Exchange (NYSE)
Open: 9:30 AM (ET)
Close: 4:00 PM (ET)
Pre-Market: 4:00 AM – 9:30 AM (ET)
After Hours: 4:00 PM – 8:00 PM (ET)
Nasdaq
Open: 9:30 AM (ET)
Close: 4:00 PM (ET)
Pre-Market: 4:00 AM – 9:30 AM (ET)
After Hours: 4:00 PM – 8:00 PM (ET)
London Stock Exchange (LSE)
Open: 8:00 AM (GMT)
Close: 4:30 PM (GMT)
Tokyo Stock Exchange (TSE)
Open: 9:00 AM (JST)
Lunch Break: 11:30 AM – 12:30 PM (JST)
Close: 3:00 PM (JST)
Hong Kong Stock Exchange (HKEX)
Open: 9:30 AM (HKT)
Lunch Break: 12:00 PM – 1:00 PM (HKT)
Close: 4:00 PM (HKT)

Crypto Intraday Scalper [Patterns + RSI + Volume + MTF + ADX]# Guide to Reading the Indicator (CIS Pro v2)
## 1. Operational Signals (The Labels)
- **GREEN Label "BUY"**:
**Meaning**: Entry for a Long position.
**Conditions**: Bullish candle pattern + Oversold RSI + High Volume + Bullish 1-hour trend + Sufficient Volatility.
- **RED Label "SELL"**:
**Meaning**: Entry for a Short position.
**Conditions**: Bearish candle pattern + Overbought RSI + High Volume + Bearish 1-hour trend + Sufficient Volatility.
- **No Label**: The market is in an uncertain phase, sideways movement, or filters (ADX/MTF) are blocking signals for protection.
## 2. Trend Lines (The Context)
- **Gray Line (EMA 200)**: This serves as the dividing line between bullish and bearish trends.
**Rule**: Seek Long positions only above the gray line; Short positions only below it.
- **Red/Green Step Line (Supertrend / Trailing Stop)**:
**Green (below the price)**: Strong bullish trend. Acts as dynamic support.
**Red (above the price)**: Strong bearish trend. Acts as dynamic resistance.
**Usage**: Use it for trade exits. If in a Long position and the line turns red, close the entire trade.
## 3. Price Levels (Targets and Supports)
- **Blue/Red/Green Dots (Pivot Points)**:
These are levels calculated from the previous day. The price tends to bounce at these points. Use them as final targets for taking profit.
- **Orange Line (VWAP)**:
This represents the "average price" for the day. If the price deviates too far, it often returns (elastic effect).
- **Dashed Lines (Appear after a signal)**:
**Red Dashed**: Suggested Stop Loss (based on ATR volatility).
**Green Dashed**: Suggested Take Profit (quick target).
## 4. The Table (Dashboard in the Top Right)
This provides reasons why you may not be receiving signals:
- **Trend (Current)**: The trend on your current chart.
- **Trend (MTF 60)**: The trend on the 1-hour chart. If these two conflict (e.g., Bullish vs. Bearish), no signals will appear.
- **ADX Volatility**: If RED (below 20), the market is flat—no trades. If GREEN, there is sufficient movement.
- **Volume Status**: Alerts if anomalous high volume is entering (High) or if conditions are calm.
## 🚀 Operational Summary
- Wait for the label.
- Quick Check: Is the price on the correct side of the gray line? Is the step line the right color?
- Enter the trade.
- Exit when the price hits the green dashed line (Quick Take Profit) **OR** when the price breaks the step line (Trailing Stop for longer trends).
What aspect of this indicator should we analyze next—perhaps integrating it with real-time ETH data or testing it via code execution for backtesting?

dual moving average crossover Erdal//@version=5
indicator("MA Cross Simple", overlay=true)
// Inputs
fastLen = input.int(10)
slowLen = input.int(100)
// Moving averages
fastMA = ta.sma(close, fastLen)
slowMA = ta.sma(close, slowLen)
// Plot
plot(fastMA, color=color.green)
plot(slowMA, color=color.red)
// Cross signals
bull = ta.crossover(fastMA, slowMA)
bear = ta.crossunder(fastMA, slowMA)
// Labels
if bull
label.new(bar_index, low, "BUY", style=label.style_label_up, color=color.green)
if bear
label.new(bar_index, high, "SELL", style=label.style_label_down, color=color.red)

MAX TRADEMAX TRADE is an advanced intraday trading indicator designed for gold and forex pairs. It uses a dynamic Fibonacci-based trend line, multi-timeframe EMA, RSI and ATR filters to avoid bad entries. Every signal comes with automatic TP/SL levels, break-even logic and a live stats panel showing win rate, profit, number of trades and streaks.

Goldsky - Gold Market SpecialistGoldsky is a sophisticated TradingView Pine Script indicator designed exclusively for XAUUSD (Gold) trading. It features adaptive parameter adjustment, session-based optimization, market regime detection, news event filtering, multi-timeframe analysis, and intelligent risk management specifically calibrated for gold's unique market characteristics.
Features
Adaptive System: Parameters adjust automatically based on market conditions
Session-Based Optimization: Different strategies for Asian/European/American/Overlap sessions
Market Regime Detection: TRENDING/RANGING/BREAKOUT/NEUTRAL market analysis
News Event Filter: Automatic detection and protection during high volatility
Multi-Timeframe Analysis: H1 trend + M15 structure + M5 execution confluence
RSI Integration: Advanced RSI filtering for entries and exits
Bollinger Bands Integration: Volatility analysis and extreme value detection
Risk Management: Gold-specific risk parameters and position sizing

Elliott Wave Multi-Level (Micro/Main)**Title Suggestion:**
Elliott Wave Multi-Level Strategy (Micro/Main)
**Short Description (for TradingView):**
This strategy detects Elliott Waves on two levels — **Micro** (short-term swings) and **Main** (higher-level structures) — and uses them for fully automated long and short trading.
Main Impulse waves (1–5) and ABC corrections are identified using pivot logic, ATR-based movement filters, volume confirmation, and an optional EMA trend filter. Micro Impulse waves serve as confirmation for Main structures, creating a multi-level validation system that significantly reduces false signals.
Entries are taken either:
* **with the trend**, after confirmed Main Impulse waves, or
* optionally as **reversal trades** at the completion of ABC corrections.
Stop-loss and take-profit levels are dynamically calculated using ATR multipliers, allowing the strategy to adapt to different volatility environments. All parameters (pivots, filters, confirmations, risk settings) are fully customizable to fit various markets and timeframes (e.g., 1m–15m).

Harami Reversal Alerts BB Touch (Strict First Candle)Harami Reversal Alerts BB Touch (Strict First Candle)
Harami Reversal Alerts BB Touch (Strict First Candle)Harami Reversal Alerts BB Touch (Strict First Candle)Harami Reversal Alerts BB Touch (Strict First Candle)Harami Reversal Alerts BB Touch (Strict First Candle)Harami Reversal Alerts BB Touch (Strict First Candle)

MarketCap & Sector MarketCap & Sector Dashboard is a lightweight info panel that shows three key fundamentals for any NSE/BSE stock directly on your chart: current market capitalization (in crores), sector, and industry. It keeps this basic context always visible so you can quickly see how big the company is and where it sits in the market without leaving the price chart.

NIFTY Weekly Option Seller DirectionalHere’s a straight description you can paste into the TradingView “Description” box and tweak if needed:
---
### NIFTY Weekly Option Seller – Regime + Score + Management (Single TF)
This indicator is built for **weekly option sellers** (primarily NIFTY) who want a **structured regime + scoring framework** to decide:
* Whether to trade **Iron Condor (IC)**, **Put Credit Spread (PCS)** or **Call Credit Spread (CCS)**
* How strong that regime is on the current timeframe (score 0–5)
* When to **DEFEND** existing positions and when to **HARVEST** profits
> **Note:** This is a **single timeframe** tool. The original system uses it on **4H and 1D separately**, then combines scores manually (e.g., using `min(4H, 1D)` for conviction and lot sizing).
---
## Core logic
The script classifies the market into 3 regimes:
* **IC (Iron Condor)** – range/mean-reversion conditions
* **PCS (Put Credit Spread)** – bullish/trend-up conditions
* **CCS (Call Credit Spread)** – bearish/trend-down conditions
For each regime, it builds a **0–5 score** using:
* **EMA stack (8/13/34)** – trend structure
* **ADX (custom DMI-based)** – trend strength vs range
* **Previous-day CPR** – in CPR vs break above/below
* **VWAP (session)** – near/far value
* **Camarilla H3/L3** – for IC context
* **RSI (14)** – used as a **brake**, not a primary signal
* **Daily trend / Daily ADX** – used as **hard gates**, not double-counted as extra points
Then:
* Scores for PCS / CCS / IC are **cross-penalised** (they pull each other down if conflicting)
* Final scores are **smoothed** (current + previous bar) to avoid jumpy signals
The **background colour** shows the current regime and conviction:
* Blue = IC
* Green = PCS
* Red = CCS
* Stronger tint = higher regime score
---
## Scoring details (per timeframe)
**PCS (uptrend, bullish credit spreads)**
* +2 if EMA(8) > EMA(13) > EMA(34)
* +1 if ADX > ADX_TREND
* +1 if close > CPR High
* +1 if close > VWAP
* RSI brake:
* If RSI < 50 → PCS capped at 2
* If RSI > 75 → PCS capped at 3
* Daily gating:
* If daily EMA stack is **not** uptrend → PCS capped at 2
**CCS (downtrend, bearish credit spreads)**
* +2 if EMA(8) < EMA(13) < EMA(34)
* +1 if ADX > ADX_TREND
* +1 if close < CPR Low
* +1 if close < VWAP
* RSI brake:
* If RSI > 50 → CCS capped at 2
* If RSI < 25 → CCS capped at 3
* Daily gating:
* If daily EMA stack is **not** downtrend → CCS capped at 2
**IC (range / mean-reversion)**
* +2 if ADX < ADX_RANGE (low trend)
* +1 if close inside CPR
* +1 if near VWAP
* +0.5 if inside Camarilla H3–L3
* +1 if daily ADX < ADX_RANGE (daily also range-like)
* +0.5 if RSI between 45 and 55 (classic balance zone)
* Daily gating:
* If daily ADX ≥ ADX_TREND → IC capped at 2 (no “strong IC” in strong trends)
**Cross-penalty & smoothing**
* Each regime’s raw score is reduced by **0.5 × max(other two scores)**
* Final IC / PCS / CCS scores are then **smoothed** with previous bar
* Scores are always clipped to ** **
---
## Regime selection
* If one regime has the highest score → that regime is selected.
* If there is a tie or close scores:
* When ADX is high, trend regimes (PCS/CCS) are preferred in the direction of the EMA stack.
* When ADX is low, IC is preferred.
The selected regime’s score is used for:
* Background colour intensity
* Minimum score gate for alerts
* Display in the info panel
---
## DEFEND / HARVEST / REGIME alerts
The script also defines **management signals** using ATR-based buffers and Camarilla breaks:
* **DEFEND**
* Price moving too close to short strikes (PCS/CCS/IC) relative to ATR, or
* Trend breaks through Camarilla with ADX strong
→ Suggests rolling away / widening / converting to reduce risk.
* **HARVEST**
* Price has moved far enough from your short strikes (in ATR multiples) and market is still range-compatible
→ Suggests booking profits / rolling closer / reducing risk.
* **REGIME CHANGED**
* Regime flips (IC ↔ PCS/CCS) with cooldown and minimum score gate
→ Suggests switching playbook (range vs trend) for new entries.
Each of these has a plotshape label plus an `alertcondition()` for TradingView alerts.
---
## UI / Panel
The **top-right panel** (optional) shows:
* Strategy + final regime score (IC / PCS / CCS, x/5)
* ADX / RSI values
* CPR status (Narrow / Normal / Wide + %)
* EMA Stack (Up / Down / Mixed) and EMA tightness
* VWAP proximity (Near / Away)
* Final **IC / PCS / CCS** scores (for this timeframe)
* H3/L3, H4/L4, CPR Low/High and VWAP levels (rounded)
These values are meant to be **read quickly at the decision time** (e.g. near the close of the 4H bar or daily bar).
---
## Intended workflow
1. Run the script on **4H** and **1D** charts separately.
2. For each timeframe, read the panel’s **IC / PCS / CCS scores** and regime.
3. Decide:
* Final regime (IC vs PCS vs CCS)
* Combined score (e.g. `AlignScore = min(Score_4H, Score_1D)`)
4. Map that combined score to **your own lot-size buckets** and trade rules.
5. During the life of the position, use **DEFEND / HARVEST / REGIME** alerts to adjust.
The script does **not** auto-calculate lot size or P&L. It focuses on giving a structured, consistent **market regime + strength + levels + management** layer for weekly option selling.
---
## Disclaimer
This is a discretionary **decision-support tool**, not a guarantee of profit or a replacement for risk management.
No performance is implied or promised. Always size positions and manage risk according to your own capital, rules, and regulations.


Snip Price Action [@17.daavid indicator]All in one
SMC Indicator Snip.
CONTACT: @17.daavid
Instagram

