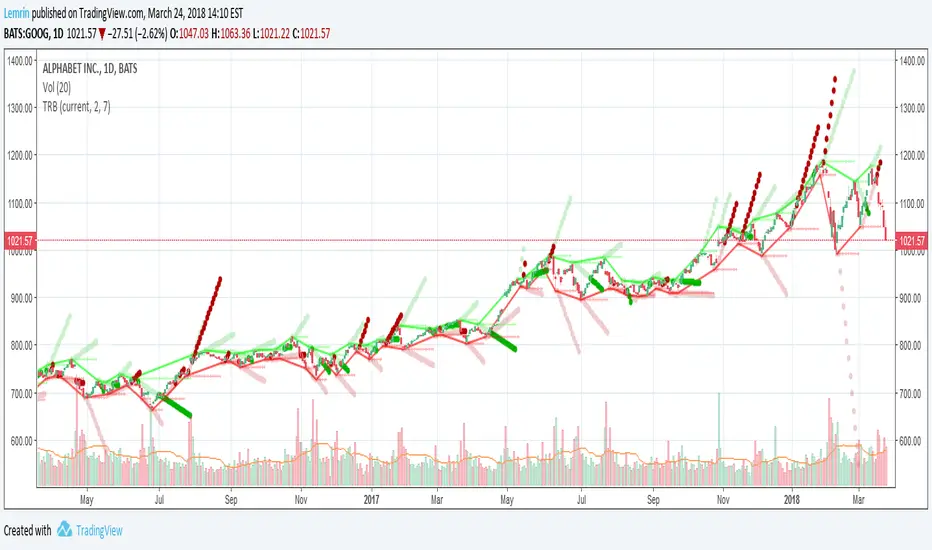
Fractal BreakoutFirst of all, huge credit to synapticEx , whose brilliant use of the security function inspired me to figure out a way to get quasi-shape boundaries automatically drawn on a chart.
This study draws upper and lower trend lines, based on configurable fractal*** reversal detection, calculates slope from the last two upper or lower reversal points, and then extends a dotted line along the same slope...until the next upper (or lower) reversal occurs. If the high (or low) breaks this extension, the dotted line becomes solid to aid visibility. Reversal detection is configurable to use any number of ticks, but probably four to eight will work best.
I made the inclusion of volume in the reversal logic optional (off by default) and left the existing SMA input found in synapticEx's code intact, albeit with a lower default. With the addition of trend lines, I found volume hindered identification of reversals, although I could try various other filters than the SMA included originally.
I have also left intact the very nice ability to change the period and use the requested period identify reversals, courtesy of synapticEx.
This could be used in a strategy, as the values plotted are actual values that are available to include in logic and do not include knowledge of the future. However , information is not available until the floor of half the number of ticks used in reversal detection (I then offset by that number to line things up visually). Having never heard of it until now, I just Googled the Bill Williams Alligator strategy, which looks interesting, so maybe I could see how this could be ported to that.
***As I typed this, I remembered that while making reversal detection configurable, I changed the detection logic simply to look for highest (or lowest) of the desired length of ticks. I don't know whether this is not strictly fractal anymore, but if desired, with a little work, I could make it require consecutive, consistent changes before and after each reversal again.
Here are a few screenshots from hourly ticks, using the "current" (hourly) period, with and without volume, and playing with the number of points used to identify reversals.
Not using volume
Using volume
Indicatori di Bill Williams


Brandon: Fractals MKIICustom Indicator development published for customer verification and acceptance.
Features
Generate buy / sell signals if x number of candles following a fractal are up/down.
Generate an early warning (background color change) if x - 1 candles following a fractal are up/down
Generate alerts for buy/sell signals and early warning.


Williams %R Indicator with EMA smoothingRun Williams %R through EMA to smooth it.
Strategy by LoneWolf345, code by sarcos

ATRIXTRIX Alligator with main line of balance.
Part of Atrix trade system.
Highly recommend to use with TTC v2 (Cumulative TRIX Moving Averages oscillator. )


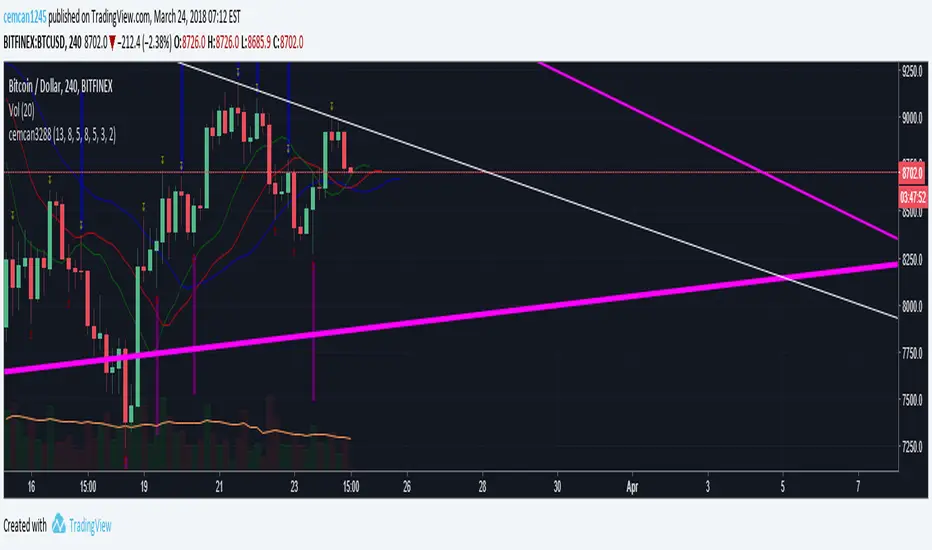
Bill Williams. Alligator, Fractals & Res/Sup combined (by vlkvr)Bill Williams indicators (each separately) are simple and quite self-sufficient, however, are most often used together. The key ones (Alligator and Fractals) are freely available and everyone can use them, but why use them on the chart separately, when "together more fun", and not conceivable, in my opinion, they are one without the other.
So, I present "split/copypasta" of two key indicators of Bill Williams, plus (as a bonus) visualization of "Support/Resistance" levels (and in fact, lines from extremes or the same fractals).
As a result, before you indicator "three-in-one".


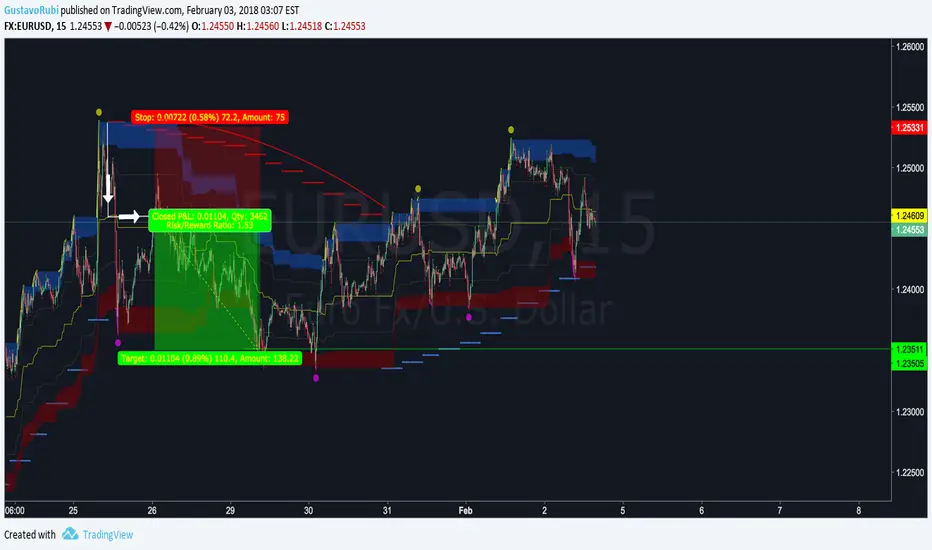
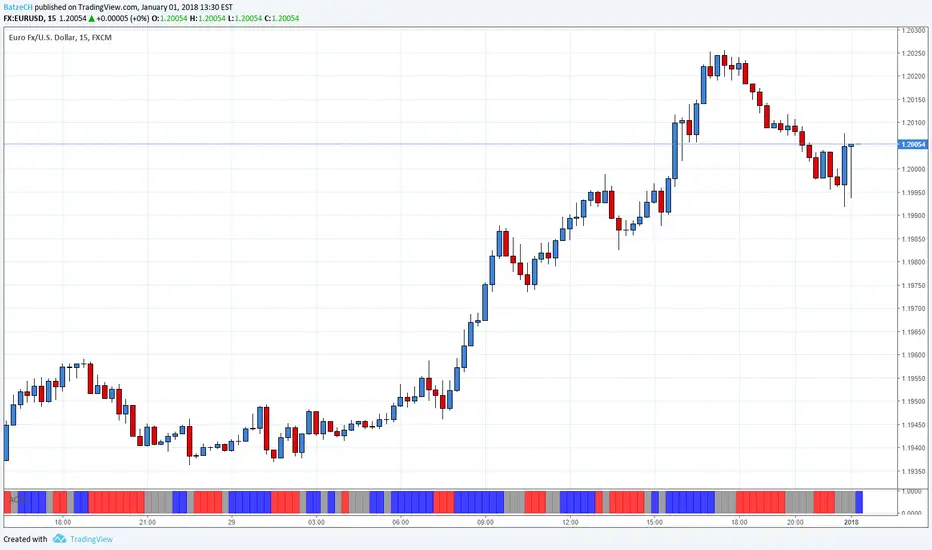
BullTrading 15m Trend master V3.0
BullTrading 15m Trend master V3.0 is a Retracement Trading System that filters main trends with minimum lag. This trading system is based on Transient Zones Theory, Market Makers Theory and Fractals.
BullTrading 15m Trend master V3.0 is alert friendly and works on any financial instrument.
White lines and arrows are manually drawn to show how to calculate the Optimum Entry Levels.
Initial SL is calculated by adding 3 pips to the nearest BullTrading Parabolic SAR line.
TP 1 formula is calculated by multiplying by 1.5 the initial SL pips.
TP 2 is Open and trailed 3 pips above the last BullTrading Parabolic SAR line.
BE is set after reaching the initial SL pips or by trailing the last BullTrading Parabolic SAR line plus 3 pips.
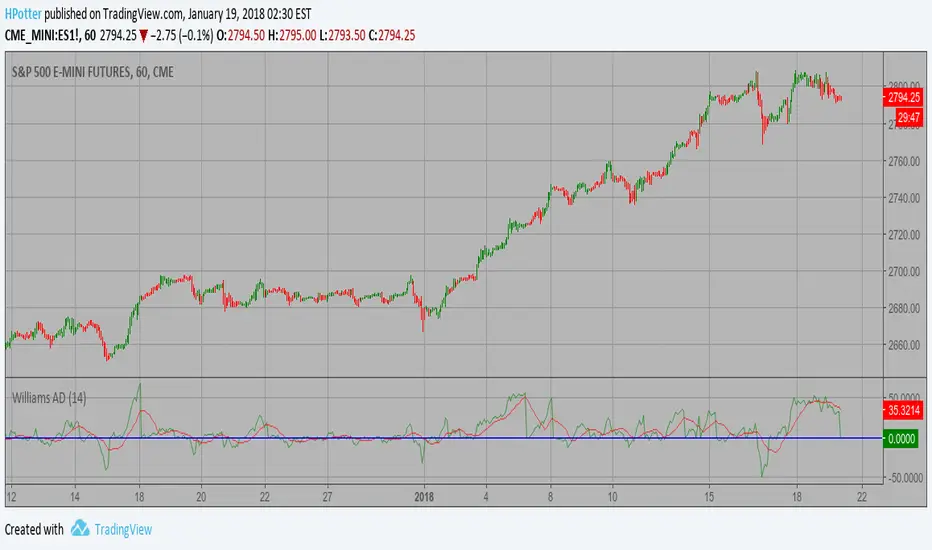
Smoothened Williams A/D Strategy Accumulation is a term used to describe a market controlled by buyers;
whereas distribution is defined by a market controlled by sellers.
Williams recommends trading this indicator based on divergences:
Distribution of the security is indicated when the security is making
a new high and the A/D indicator is failing to make a new high. Sell.
Accumulation of the security is indicated when the security is making
a new low and the A/D indicator is failing to make a new low. Buy.
WARNING:
- This script to change bars colors.
Brandon FractalsCustom Indicator developed for a Backtest-Rookies customer. Published for verification and acceptance
Dual Fractal indicator. Display fractals from an upper timeframe and provide alerts when price breaks above/below the upper timeframe fractal.

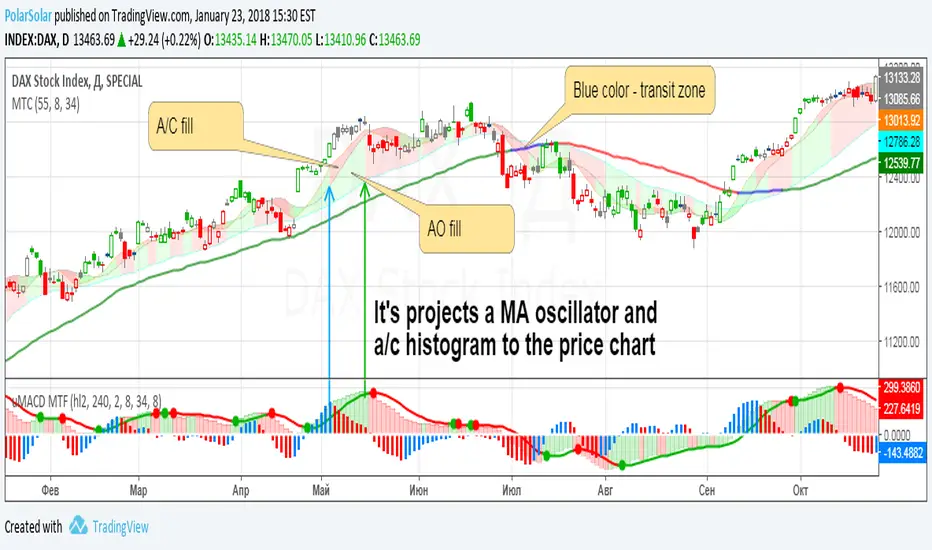
AO and AC Zones (Bill Williams)The colored Zones is the combination of the Awesome Oscillator (AO) and Accelerator Oscillator (AC) indicator by Bill Williams.
If both AO and AC bars are uptrending, the zone is blue
If both AO and AC bars are downtrending, the zone is red
If AO and AC have different colors, the zone is gray
Blue and red zones
This zones allows you to trade more aggressively, you could also add to current positions
Gray zone
You should avoid those flat (or choppy) market and don't open new positions or add to your current ones
You could use this indicator also in combination with MACD.
Please always remember, there is no holy grail indicator!


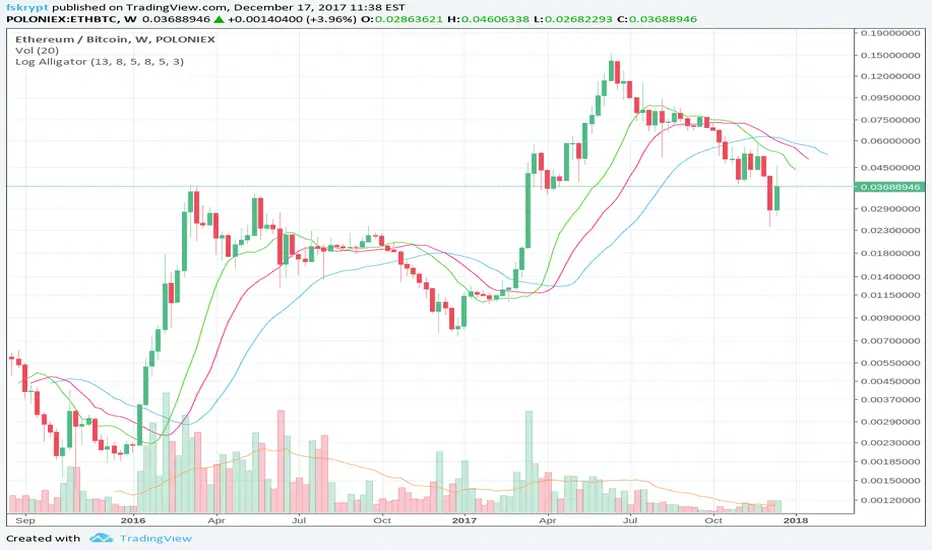
Log-space Williams AlligatorMake Williams Alligator usable for looking at weekly and high-volatility crypto charts.
The built-in indicator may have some problems with these charts, as in example below: