Bitmex HunterBitmex Liquidation Hunter advise you with all the liquidation level from 100x 50x and 25x
so you can be a head of Bitmex market and trade each liquidation Bounce and take your profits
you will see how Bitmex bot and Bitmex Price its all the time moving from one liquidation level to the next
liquidation level hunting all the greedy and retail traders that FOMO in !!
Bitmex

[BACKTEST] CMYK-RMI-SMA◊ Introduction
This script makes use of three RMI's and SMA's, that indicate Overbought/Oversold on different Periods that correspond with Frequency’s that move the market.
◊ Origin
This is an update on █▓▒░ CMYK ♦ RMI ♦ TRIPLE ░▒▓█
◊ Usage
This script is intended for Automated Trading on the 1-5 minute chart.
◊ Features Summary
Two Part Indicator
Strategy Type Selection
Three RMI's SMA's
Trend adjustment
Pump/Dump Entry Delay
Pyramiding
Ignore first entries
Take Profit
Interval between Entries
Multiring Fix
Alert signal Seperation
◊ Community
Wanna try this script out ? need help resolving a problem ?
CMYK :: discord.gg
AUTOVIEW :: discordapp.com
TRADINGVIEW UNOFFICIAL :: discord.gg
◊ Setting up Autoview Alerts
Use the study version of this script, To set up The Alerts Autoview Picks up on.
Goto the CMYK Discord for support and Settings.
◊ Backtesting
Use the strategy version of this script for backtesting.
◊ Contact
Wanna try this script out ? need help resolving a problem ?
CMYK :: discord.gg
Happy trades!!!

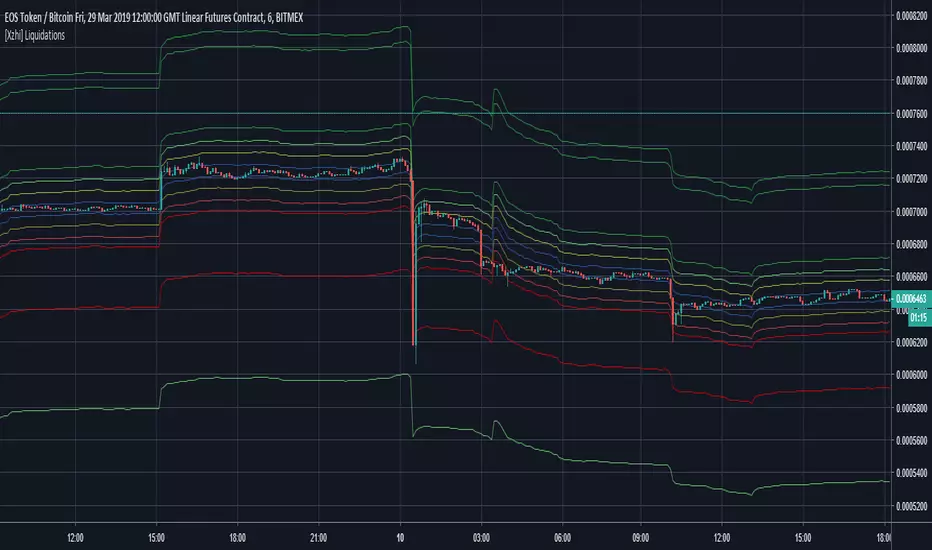
Bitmex Liquidations (More levels)Author of the script is Jaqobs
Moving averages based on VWMA and Bitmex's leverage liquidation multipliers.
Added more levels so it is easier to visually see where scaled limit orders should be placed in order to catch extreme wicks.
Fisher Transform Multi-Timeframe (Backtest)This is the Backtest Strategy for mortdiggiddy's "Fisher Transform Multi-Timeframe"
For more details check his study:

Multi Timeframe Rolling Bitmex Liquidation LevelsTrack Bitmex liquidations levels in real-time with a rolling VWMA or VWAP basis.
Allows the input of a different time frame if you wish.

[ALERTS] CMYK-RMI-TRIPLE IIThis is the same previous script but without the Deribit index (for BITMEX users for example) that can give problems due to no connection with any of the 6 exchanges. Now use 'close' as source.
BTCUSD, XBTUSD, ...
Best time frame: 5 minutes
Alerts: 'once per bar'

[BACKTEST] CMYK-RMI-TRIPLE IIThis is the same previous script but without the calculation of the Deribit index (for BITMEX users for example) that can give problems due to no connection with any of the 6 exchanges. Now use 'close' as source.
Settings for BTCUSD or XBTUSD
Best time frame: 5 minutes

Bitstamp BTC Horizontal 200 Week SMAsmall change to my horizontal 200 week SMA script.
Plots the latest 200 week SMA value from Bitstamp BTCUSD on the chart. I use it for the Bitmex chart, as Bitmex doesn't have enough history for a 200 week moving average.

TJ Money FlowTJ Money Flow, one of the most frequently used indicators by me.
This indicator is a modification of the CMF and it has great use and multiple interpretation possibilities.
I like treating it like the addition of StochRSI to RSI, just that TJ-MoneyFlow works like a "behind the scenes tool" of the volume indicator.
The first most important thing about it are the spikes. I like seeing a movement either up or down, confirming it with a spike in the TJ-MF.
The next sparkle about it is the modification of movements down and movements up.
When it moves down, it is in blue color, when it moves up it is in green color.
This lets me compare the candle direction to the Money Flow direction.
Bigger clouds of the same color indicate strength in the direction.
One more step that I like using the TJ-MoneyFlow for is for divergences. Either divergences on a cloud itself, regardless from its color.
Or divergences over two separate clouds. The idea is, if there is a significant trend, then it should be confirmed by the MoneyFlow.
Like and Follow me and you will find this page interesting because I am a TA expert and professional day trader in crypto since 2012 that does daily updates and new posts about the hottest and most discussed coins.
Cheers, TJ

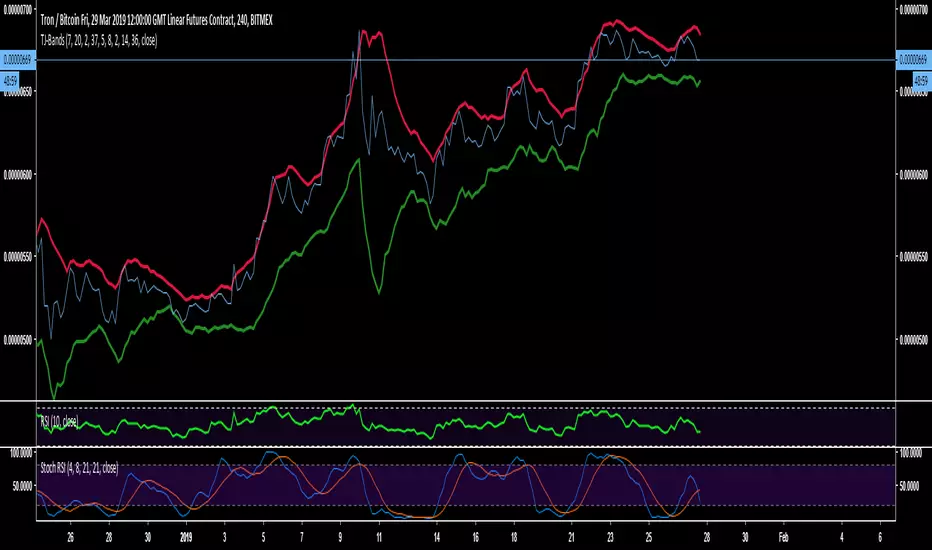
TJ-BandsDo you want to know
This indicator is a modified form of Bollinger Bands.
It works in a similar way like BB does. If you take a look at the "line" chart, you will clearly see, that a close outside these bands is very unlikely and works very well as a rejection line for the chart.
Since, the chart is likely to get rejected at the bands those have been indicated red at the top and green at the bottom.
The use is very simple, add it to your chart and there is nothing more to modify or change.
Like and Follow me and you will find this page interesting because I am a TA expert and professional day trader in crypto since 2012 that does daily updates and new posts about the hottest and most discussed coins.
Cheers, TJ
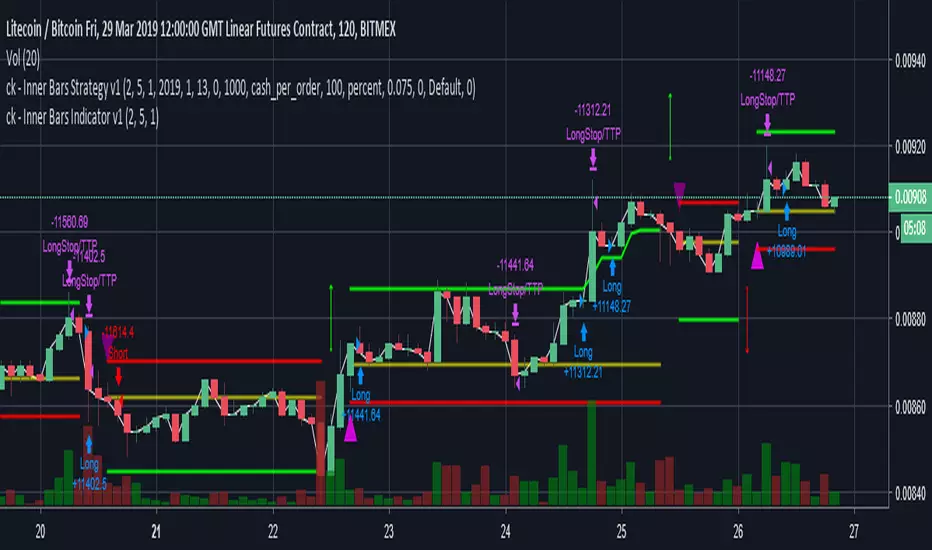
ck - Inner Bars Indicator with Alerts and Trailing Stop v1*** Please check out the matching Strategy to accompany this Indicator to allow you to fully backtest! ***
Inner Bar trading strategy is where the "inside" bar (or candle to the right) within a pair is smaller and within the high to low range of the prior bar, as this pattern tends to be somewhat predictable; especially in "chop" or sideways trading, it is useful to have in your tool box.
Features include:
Complimentary strategy you can add as well as the indicator to backtest and tune your settings before live trading
Trailing Stoploss to wring every cent from a trade
Clear Alert labels have been coded in for use with trading bots, 3commas is recommended.
Enable/Disable Shorts in addition to Longs
Visual chart shapes - Pink Triangle = Long, Purple Triangle = Short, Thin Green Arrow = Profit, Thin Red Arrow = Loss
Realtime Deal Status - Plotlines include Yellow = Entry Price, Green = Trailing Stop Profit, Red - Hard Stoploss
A further feature is that you can disable Shorts (therefore only Longing) for use with exchanges
that only allow you to Long, such as Binance & Coinbase.
Additionally, this Indicator will close a trade before opening the next, so a single exchange
account (BitMEX for example) is all that is required versus having separate accounts to long or
short on the same chart.
This strategy is intended to use $100 of capital, traded at 2.5% per order with 10x lev on Bitmex.
If you like my work, please use my referral links (you will receive discounts!)
3commas trading bots (now with Bitmex support and a lot more!) - 3commas.io
BitMEX - www.bitmex.com
If you have any comments or suggestions, please message me via TradingView.
Based on the core "Inner Bars" concept found at:
backtest-rookies.com
with original inspiration/idea from babypips.com

ck - Inner Bars Strategy v1*** Please check out the matching Indicator to accompany this Strategy to allow you to fully backtest! ***
Inner Bar trading strategy is where the "inside" bar (or candle to the right) within a pair is smaller and within the high to low range of the prior bar, as this pattern tends to be somewhat predictable; especially in "chop" or sideways trading, it is useful to have in your tool box.
Features include:
Complimentary Indicator you can add as well as this strategy to backtest and tune your settings before live trading
Trailing Stoploss to wring every cent from a trade
Indicator only: Clear Alert labels have been coded in for use with trading bots, 3commas is recommended.
Enable/Disable Shorts in addition to Longs
A further feature is that you can disable Shorts (therefore only Longing) for use with exchanges
that only allow you to Long, such as Binance & Coinbase.
Additionally, this Indicator will close a trade before opening the next, so a single exchange
account (BitMEX for example) is all that is required versus having separate accounts to long or
short on the same chart.
This strategy is intended to use $100 of capital, traded at 2.5% per order with 10x lev on Bitmex.
If you like my work, please use my referral links (you will receive discounts!)
3commas trading bots (now with Bitmex support and a lot more!) - 3commas.io
BitMEX - www.bitmex.com
If you have any comments or suggestions, please message me via TradingView.
Based on the core "Inner Bars" concept found at:
backtest-rookies.com
with original inspiration/idea from babypips.com
Short Selling BITMEX Alts (15min scalp strategy)So this is a strategy i made for trading BITMEX alts on 15minute timeframe.
Works simply. You get sell signal when it is considered overbought and way too far from its mean -> the moving average. So you short it with that moving average as the target. Sometimes it goes lower, since the sell signal represents resistance area and average represents support and they act accordingly. Might break through, might bounce back to entry. So its safer to exit at support then pray on breakdown, its 15min strategy afterall.
There is no defined stop loss on this strategy. When i trade it i take risk/reward setup and my stop is calculated based on reward from entry to target. Usually its 1R or above that,usually i use price action for that purpose. if you trade it manually you have advantage, since signal gets confirmed on candle close, yet it could appear as soon as candle opens. So if you dont want any additional risks - wait for candle close and short it. If you want to gamble it - enter and average it up as it goes until you meet your risk limit.
Here is how it is inteded to be traded.
This strategy does not account for limit fees on bitmex, so it wouldnt be much practical to entry AND exit with market orders. As you can see in example, simple 1.5% move would lose 1/3 of its reward if you used market entry+exit.
This one works on :
TRX
EOS
LTC
BCH
ADA
All 15 minute timeframes. Plus it showes really good results in spot exachnges too, if you want to use as a tool to exit spot exposure (binance chart, same symbols).
Contact for free trial here or at twitter.com (i post full perfomance on all pairs there)
Also check this strategies performance on BCHH contract on bitmex. Absolute banger.


Oscillator Strategy for Scalping (BITMEX Swaps btc + eth)This is short selling strategy for BITMEX's XBTUSD and ETHUSD swaps scalping.
Made specifically for 3M XBTUSD and 3M-5M ETHUSD timeframe trading.
Not gonna open all the details, but it works mostly on bear divergences and moving averages.
On premium it shows 10000 bars back on 3minute timeframe and over that period(3 weeks aprox) XBTUSD had 28 trades and ETHUSD had 25(+17 on 5M timeframe) trades with that strategy.
How to trade it and setups that i use for manual trading:
1: You can use it to confirm your bias. Sell signal appears + price tries to retake previous resistance = most likely it will fail.
2. Sell signal after wick up suggests that you are likely to get filled at the top.
Your main target should be this moving average. Basically sell signal appears at resistance/near one and moving average represents current line of support. So when you enter short you should be eyeing this MA as your exit/target. Yes, there is a good possibility that support wount hold and this is a bear market we talking about BUT it is 3M bot oriented trading strategy, dont forget about and dont hold for too long to find yourself with price lending on MA and jumping from it.
This strategy does not have a defined stop, rather it suggests you to calculate it based on entry (provided) and target (provided).
Here is what i usually do to calculate my risks. My reward is a move to line of support, my stop is usually 1R, winrate is much higher than 50% so i feel good about it. Entry either at sell signal or at wick. Wicks not always get runned, but they provide incredible r/r setups.
Free trial for 36 hours for this one.


Bitmex Liquidation Bands - JDA simple visual representation of leverage implications in Bitmex.
Can be used as a guide to place stops or targets to as the chart tends to jump from one liquidation point to another, most of the time.
Different leverages can be selected.
If I made a mistake in the percentages, please let me know so I can correct it! ;-)
JD.
#NotTradingAdvice #DYOR

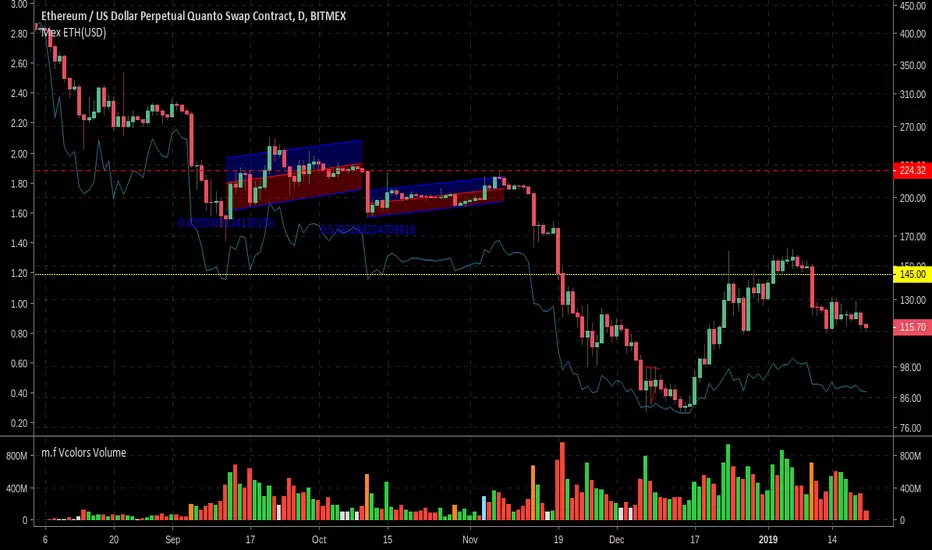
BitMEX ETHUSD contract value (USD)The ETHUSD Quanto Swap contract on BitMEX allows you to trade ETHUSD with Bitcoin put forward as collateral. However this means that 1 contract is not equal to 1 USD or 1 ETH, but instead varies according to the price of ETHUSD.
You can see the contract specs here www.bitmex.com and find more information here blog.bitmex.com
My advice is always to make sure you fully understand a derivative product before you trade it, however many of us may not have the acumen to actually understand how a quanto swap works. Nevertheless, we have to be aware that the value in USD of each contract depends on the price of Ethereum and also the price of Bitcoin at each point in time.
This tool will show you the value of a single ETHUSD contract in USD, but it solely for indicative purposes only. Your trade, your risk. I do not ask for any donations from your gains and I am not liable for any of your losses.
Source code is provided.
Note in the example image that the price of ETHUSD is plotted on a logarithmic scale but the indicative contract value is linear.
[ALERTS] CMYK-RMI-TRIPLEScript based on 3 RMI and the opening of long / short 'pyramiding' positions.
XBT:USD on BITMEX or BTC:USD on DERIBIT
Includes the calculation of the DERIBIT Index but can be used for any Crypto, the always overloaded BITMEX or even Forex, ...
Best timeframe: 5 minutes. A 5-minutes chart extended to the minimum is equal to a 1H chart.
¡NO REPAINT! : Alerts 'Once per bar'
It has take profit and it's so good that it doesn`t need Stop Loss
Original idea by MVPMC.

CB Signals - Holla-724 BITMEX ETH/USD Long/Short (PAID ALGO)This algo uses a number of strategies developed from 7 yrs of trading this concept in the FX markets. I have modified it for Leverage trading on BITMEX exchange.
You may view detail summary of live performance of this Algo dating from Jan 1st 2018 - Jan 17th 2019 (In one of Crypto's worst bear markets) below by clicking the "Performance Summary" Tab:
To signup for this algo please visit the link below:
www.cryptoblood.io

BitMEX Volatility Guppy [NeoButane]Guppy Multiple Moving Averages based on volatility moving averages.
Coloring rules from ChrisMoody's Guppy.
Guppy: www.investopedia.com
Volatility index moving average: etfhq.com
BitMEX volatility indexes: www.bitmex.com

Bollinger_Bands_Strategy(Add Function) - BB Free (By Wolf)전략 및 지표 얼러트등 파인스크립트 제작 문의 - 트레이딩뷰 메시지
Contact to create strategy and indicators add alert etc - TradingView Message
이름(Name)
Bollinger Bands Strategy (Add Function) (By Wolf)
-해당 전략은 Long & Short 의 신호를 발생시키는 전략입니다.
-The strategy is to generate a signal from Long & Short
기능 추가(Add Function)
-Trade Direction Long
-Trade Direction Short
-Stoploss ($)
-Profit target($)
-Backtest date
해당 전략은 수익률이 높은값으로 임의로 변경해놓았습니다
본인의 투자전략에 맞는 수치로 변경하여 사용하셔도 좋습니다.
*I entered the value with good profits settings for the strategy.
You can use this customarily
소스코드(Source code)
-비공개 (not open to the public)
*모든 전략은 리페인트 코드를 등록하지않았습니다.
-All strategies do not register the repaint code
*모든 전략 및 지표의 백테스트 결과는 BITMEX Fee 0.075% 를 입력한 결과값입니다.
-The back test result for all strategies and indicators is the result of inputting BITEX Fee 0.075%
*모든 거래는 높은 위험을 수반하며, 과거 백테스트 결과가 반드시 현재 및 미래의 결과를 나타내는것은 아닙니다.
가상 또는 시뮬레이션 백테스트 결과는 한계를 가지고 있으며 실제거래와 시장의 변동 및 유동에 따라 똑같지않을
가능성이있으며, 모든 손실에 대한 책임은 본인에게 있습니다.
-All trade involve high risk, and past backtest results do not necessarily represent current and future results.
Virtual or simulated backtest results have limitations and are not consistent with actual transactions and market changes and flows
It is possible and you are responsible for any loss.
