Greedy DCA█ OVERVIEW
Detect price crashes in volatile conditions. This is an indicator for a greedy dollar cost average (DCA) strategy. That is, for people who want to repeatedly buy an asset over time when its price is crashing.
█ CONCEPTS
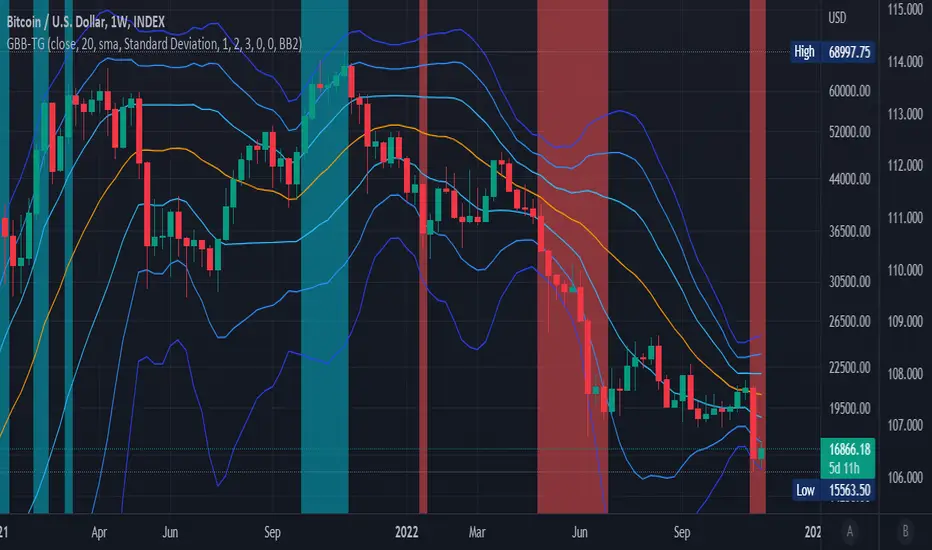
Price crashes are indicated if the price falls below one or more of the 4 lower Bollinger Bands which are calculated with increasing multipliers for the standard deviation.
In these conditions, the price is far below the average. Therefore they are considered good buying opportunities.
No buy signals are emitted if the Bollinger Bands are tight, i.e. if the bandwidth (upper -lower band) is below the value of the moving average multiplied with a threshold factor. This ensures that signals are only emitted if the conditions are highly volatile.
The Bollinger Bands are calculated based on the daily candles, irrespective the chart time frame. This allows to check the strategy on lower time frames
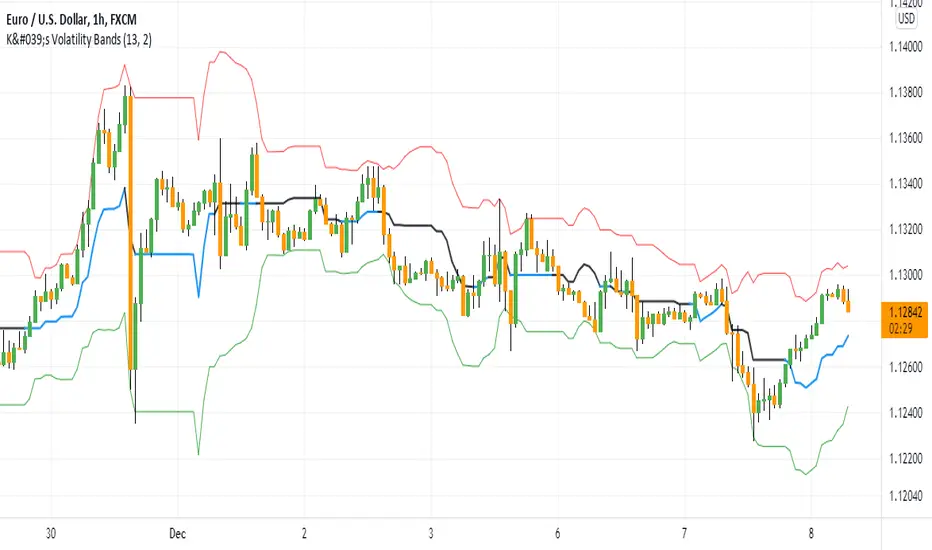
Bollingerbandstrategy

Banded Chikou Breakout — Quantifying Ichimoku MomentumTitle: Banded Chikou Breakout — Quantifying Ichimoku Momentum
Overview:
Banded Chikou Breakout (BCB) is a unique, algorithmic script designed to augment the capabilities of traders seeking substantial breakout opportunities. Constructed on the robust principles of the Ichimoku trading strategy, BCB is designed to quantify and filter the Chikou Span's significant breakouts above or below the price action. This script does not aim to replace the Ichimoku system; instead, it enhances it, providing an optimized tool for momentum trading.
Rationale:
Ichimoku traders often scrutinize the Chikou Span's position relative to price action to identify market trends. However, determining whether the Chikou Span is above or below due to a genuine trend or mere market noise can be challenging in choppy markets. BCB resolves this predicament by offering a unique way to interpret the Chikou Span's movement. It does so by quantifying the Chikou Span's momentum and utilizing Bollinger Bands to determine its significance. By effectively differentiating substantial movements from the insignificant, BCB can help traders better navigate the market and increase their potential for profitable trades.
How it Works:
BCB combines three key elements: a Momentum Script (simulating Chikou Span), a Bollinger Band Script, and a Timeframe Switcher, all working together to provide a refined trading perspective.
Momentum Script: Calculates the price difference between the current price and the price 'n' periods ago, transforming the Chikou Span into a quantifiable momentum value that signifies the strength and speed of a market move.
Bollinger Band Script: Computes a Simple Moving Average (SMA) around the momentum, plotting two 'bands' at a specified standard deviation from this SMA. This functionality allows traders to discern when the Chikou Span's momentum is abnormally high or low, signifying a potential significant breakout.
Timeframe Switcher: This feature lets traders apply the BCB script to a different timeframe from the one they are currently viewing. This capability can help traders identify higher timeframe breakouts and trade them with precision on the lower timeframe.
How to Use:
BCB is designed to complement the Ichimoku strategy for effective breakout identification.
Add the BCB script to your trading chart. It plots the momentum (yellow line) and Bollinger Bands (green lines) with the area between the bands shaded blue.
Utilize the Ichimoku strategy to identify larger and smaller timeframe trends.
Optional: Leverage the timeframe switcher to synchronize your trades with higher timeframe trends while operating on lower timeframes.
If the BCB momentum line crosses the upper Bollinger Band while the Ichimoku indicates a bullish trend, it signifies a potential significant upward breakout. Similarly, a cross below the lower band during a bearish trend could denote a significant downward breakout.
Remember, without the context provided by the Ichimoku system's trend analysis, BCB can yield false breakouts. It is, therefore, crucial to use these tools in tandem. I like to check for an Ichimoku trend on the 4H and 1H charts, and then use BCB on charts <60 minutes to capture trends with precision.

Multi Bollinger Bands with Over ZoneThis indicator is called "Multi Bollinger Bands with Over Zone". The indicator uses linear regression to calculate the regression line and standard deviation to calculate the upper and lower deviation lines. It also plots filled areas between the deviation lines to highlight overbought and oversold zones.
The indicator has several customizable inputs, including the length of the regression period, depth, and deviations used to calculate the deviation lines.
The regression line is plotted in green color with circle markers. The upper and lower deviation lines are plotted in blue and red colors, respectively. The area between the deviation lines is filled with light blue color for the overbought zone and light pink color for the oversold zone.
This indicator helps traders in identifying trends and potential price reversals. When the price is above the upper deviation line, it indicates a potential overbought zone, while when the price is below the lower deviation line, it indicates a potential oversold zone.
Please note that this indicator is only a tool for analysis and does not provide direct trading signals. It is important to combine this indicator with additional analysis and appropriate trading strategies.

5EMA BollingerBand Nifty Stock Scanner
What ?
We all heard about (well: over-heard) 5-EMA strategy. Which falls into the broader category of mean reversal type of trading setup.
What is mean reversal?
Price (or any time series, in fact) tries to follow a mean . Whenever price diverges from the mean it tries to meet it back.
It is empirically observed by some traders (I honestly don't know who first time observed it) that in Indian context specially, 5 Exponential Moving Average (5-EMA) works pretty good as that mean.
So whenever price moves away from that 5-EMA, it ultimately comes back and attain total nirvana :) Means: if price moved way higher than the 5EMA without touching it, then price will correct to meet it's 5-EMA and if price moved way lower, it will be uplifted to meet it's 5-EMA. Funny - but it works !
Now there are already enough social media coverage on this 5-EMA strategy/setup. Even TradingView has some excellent work done on these setups. Kudos to all those great souls.
So when we came to know about this, we were thinking what we should do for the community. Because it is well cover topic (specially in Indian context). Also, there are public indicators.
Then we thought why not come up with a scanner which will scan all the Nifty-50 constituent stocks and find out on the fly, real-time which all stocks are matching this 5-EMA setup and causing a Buy/Sell trade recommendation.
Hence here we are with the first version of our first scanner on the 5EMA setup (well it has some more masala than merely a 5-EMA setup).
Why?
Parts of why is already covered up.
Now instead of blindly following 5-EMA setup, we added the Bollinger band as well. Again: it's also not new. There are enough coverage in social media about the 5-EMA+BB strategy/setup. We mercilessly borrowed from all of these.
Suppose you have an indicator.
Now you apply the indicator in your chart. And then you need to (rock) and roll through your watchlist of Nifty-50 stocks (note: TradingView has no default watchlist of Nifty-50 stock by default - you have to create one custom watchlist to list all manually) to find out which all are matching the setup, need to take a note about the trade recomendations (entry, SL, target) and other stuffs like VWAP, Volume, volatility (Bollinger Band Width).
Not any more.
This scanner will track all the Nifty-50 stocks (technically: 40 stocks other than Banking stocks) and provide which one to Buy or Sell (if any), what's the entry, SL, target, where is the VWAP of the day, what's the picture in volume (high, low, rising, falling) and the implied volatility (using Bolling band width). Also it has a naive alerting mechanism as well.
In fact the code is there to monitor the (Future) OI also and all the OI drama (OI vs price and all the 4 stuffs like long build up, long unwinding, short covering, short buildup). But unfortunately, due to some limitations of the TradingView (that one can not monitor more than 40 `ta.security` call) we have to comment out the code. If you wish you can monitor only 20 stocks and enable the OI monitoring also (20 for stocks + 20 for their OI monitoring .. total 40 `ta.security` call).
How?
To know the divergence from 5-EMA we just check if the high of the candle (on closing) is below the 5-EMA. Then we check if the closing is inside the Bollinger Band (BB). That's a Buy signal. SL: low of the candle, T: middle and higher BB.
Just opposite for selling. 5-EMA low should be above 5-EMA and closing should be inside BB (lesser than BB higher level). That's a Sell signal. SL: high of the candle, T: middle and lower BB.
Along with we compare the current bar's volume with the last-20 bar VWMA (volume weighted moving average) to determine if the volume is high or low.
Present bar's volume is compared with the previous bar's volume to know if it's rising or falling.
VWAP is also determined using `ta.vwap` built-in support of TradingView.
The Bolling Band width is also notified, along with whether it is rising or falling (comparing with previous candle).
Simple, but effective.
Customization
As usual the EMA setup (5 default), the BB setup (20 SMA with 1.5 standard deviation), we provided option wherther to include or exclude BB role in the 5-EMA setup (as we found out there are two schools of thought .. some people use BB some don't. Lets make all happy :))
We also provide options to choose other symbols using Settings if they wish so. We have the default 40 non banking Nifty stocks (why non-banking? - Bank Nifty is in ATH :) .. enough :)). But if user wishes can monitor others too (provided the symbol is there in TradingView).
Although we strongly recommend the timeframe as 30 minutes , you can choose what's fit you most.
The output of the scanner is a table. By default the table is placed in the right-bottom (as we are most comfortable with that). However you can change per your wish. We have the option to choose that.
What is unique in it ?
This is more of an indicator. This is a scanner (of Nifty-50 stocks). So you can apply (our recommendation is in 30m timeframe) it to any chart (does not matter which chart it is) and it will show every 30 mins (which is also configurable) which all stocks (along with trade levels) to Buy and Sell according to the setup.
It will ease your trading activity.
You can concentrate only on the execution, the filtering you can leave it to this one.
Limitations
There is a build in limitation of the TradingView platform is that one can call only upto 40 securities API. Not beyond that. So naturally we are constraint by that. Otherwise we could monitor 190 Nifty F&O stocks itself.
30m is the recommended timeframe. In very lower (say 5m) this script tends to go out of heap (out of memory). Please note that also.
How to trade using this?
Put any chart in 30m (recommended) timeframe.
Apply this screener from Indicators (shortcut to launch indicators is just type / in your keyboard).
This will provide the Buy (shown in green color) or Sell (shown in red color) recommendations in a table, at every 30m candle closing.
Note the volume and BB width as well.
Wait for at least 2 5-minutes candles to close above/below the recommended level .
Take the trade with the SL and target mentioned.
Mentions
@QuantNomad. The whole implementation concept we mercilessly borrowed from him, even some of his code snippet we took it (after asking him through one of his videos comment section and seeking explicit permission which he readily granted within an hour). Thank You sir @QuantNomad. Indebted to you.
Monika (Rawat) ji: for reviewing, correcting, providing real time examples during live market hours, often compromising her own trading activities, about the effectiveness and usefulness of this setup. Thank You madam ji. Indebted to you.
There are innumerable contents in social media about this. Don't even know whom all we checked. Thanks to all of them.
Happy Trading (in stocks - isn't enough of Indices already?)
Disclaimer
This piece of software does not come up with any warrantee or any rights of not changing it over the future course of time.
We are not responsible for any trading/investment decision you are taking out of the outcome of this indicator.

SuperBollingerTrend (Expo)█ Overview
The SuperBollingerTrend indicator is a combination of two popular technical analysis tools, Bollinger Bands, and SuperTrend. By fusing these two indicators, SuperBollingerTrend aims to provide traders with a more comprehensive view of the market, accounting for both volatility and trend direction. By combining trend identification with volatility analysis, the SuperBollingerTrend indicator provides traders with valuable insights into potential trend changes. It recognizes that high volatility levels often accompany stronger price momentum, which can result in the formation of new trends or the continuation of existing ones.
█ How Volatility Impacts Trends
Volatility can impact trends by expanding or contracting them, triggering trend reversals, leading to breakouts, and influencing risk management decisions. Traders need to analyze and monitor volatility levels in conjunction with trend analysis to gain a comprehensive understanding of market dynamics.
█ How to use
Trend Reversals: High volatility can result in more dramatic price fluctuations, which may lead to sharp trend reversals. For example, a sudden increase in volatility can cause a bullish trend to transition into a bearish one, or vice versa, as traders react to significant price swings.
Volatility Breakouts: Volatility can trigger breakouts in trends. Breakouts occur when the price breaks through a significant support or resistance level, indicating a potential shift in the trend. Higher volatility levels can increase the likelihood of breakouts, as they indicate stronger market momentum and increased buying or selling pressure. This indicator triggers when the volatility increases, and if the price is near a key level when the indicator alerts, it might trigger a great trend.
█ Features
Peak Signal Move
The indicator calculates the peak price move for each ZigZag and displays it under each signal. This highlights how much the market moved between the signals.
Average ZigZag Move
All price moves between two signals are stored, and the average or the median is calculated and displayed in a table. This gives traders a great idea of how much the market moves on average between two signals.
Take Profit
The Take Profit line is placed at the average or the median price move and gives traders a great idea of what they can expect in average profit from the latest signals.
-----------------
Disclaimer
The information contained in my Scripts/Indicators/Ideas/Algos/Systems does not constitute financial advice or a solicitation to buy or sell any securities of any type. I will not accept liability for any loss or damage, including without limitation any loss of profit, which may arise directly or indirectly from the use of or reliance on such information.
All investments involve risk, and the past performance of a security, industry, sector, market, financial product, trading strategy, backtest, or individual's trading does not guarantee future results or returns. Investors are fully responsible for any investment decisions they make. Such decisions should be based solely on an evaluation of their financial circumstances, investment objectives, risk tolerance, and liquidity needs.
My Scripts/Indicators/Ideas/Algos/Systems are only for educational purposes!

Bollinger Band Alert with RSI Filter IndicatorThis code is for a technical analysis indicator called Bollinger Band Alert with RSI Filter. It uses two tools: Bollinger Bands and Relative Strength Index (RSI) to identify potential trading signals in the market.
Bollinger Bands are lines plotted two standard deviations away from a simple moving average of the price of a stock or asset. They help traders determine whether prices are high or low on a relative basis.
The RSI is a momentum indicator that measures the strength of recent price changes to evaluate whether an asset is overbought or oversold.
The code has some input parameters that a user can change, such as length and multiplier, which are used to calculate the Bollinger Bands, and upper and lower RSI levels to define the overbought and oversold zones.
The code then uses if statements to generate alerts if certain conditions are met. The alert condition is triggered if the close price of an asset crosses above or below the upper or lower Bollinger Bands, and if the RSI is either above or below the overbought or oversold threshold levels.
Finally, the code generates plots to visualize the Bollinger Bands and displays triangles above or below the bars indicating when to enter a long or short position based on the strategy's criteria.

Fibonacci Volatility BandsFibonacci Volatility Bands are just an alternative that allows for more margin than regular Bollinger Bands. They are created based on an average of moving averages that use the Fibonacci sequence as lookback periods.
The use of the Fibonacci Volatility Bands is exactly the same as the Bollinger Bands.

Dual Bollinger Band Mean ReversionSimple but solid mean reversion indicator with sl and tp levels. Most of the code is based on the built in bollinger bands script. Designed for scalping 1-5 minute timeframes.
The indicator consists of two sets of bollinger bands.
Price has to close below the lower (fast) bollinger band, above the moving average of the (slower) bollinger band.
If price now closes above the lower (fast) bb, the indicator draws a label at the open of the next candle (which would be a potential entry point). Take profit becomes the upper bollinger band, stop loss the same distance below the open of the candle.
I've built in a simple backtesting function that calculates the potential win/loss-ratio. Loss and profit levels are 1:1. Exit strategy could be improved on.
Adjusting the lengths depending on the asset proves to be a good idea.
The slower bollinger bands can help to identify ranging markets and/or trends following regular bollinger bands theory.
Feel free to comment with any changes that you'd like to be made.

Generalized Bollinger Bands (Tartigradia)Bollinger Band is simply a representation of the rolling average of price and its standard deviation around the average (called the "basis").
This indicator generalizes the Bollinger Band by implementing many different equations to calculate the Bollinger Bands beyond the standard deviation and sma.
Whereas other Bollinger Bands indicators often just change the basis but not the stdev calculation, the correct way to change the basis is to also change it inside the stdev calculation.
Advanced features such as temporal discounting (ie, newer bars can have more weights), median absolute deviation and multiple sigma bands (eg, 3-sigma) are available.
Up to 3 different Bollinger Bands can be displayed, and the background can be highlighted when price is overbought/oversold (beyond the Bollinger Band of choice).
Tip: BB3, which is the bollinger band with standard deviation of 3, which represents 99% of observed values in the lookback period, is a good choice to highlight overbought/oversold conditions.
Usage:
Use it as usual Bollinger Bands, as a measure of volatility, and to setup stop losses.
Use the bandwidth as a measure of volatility: higher is more volatile, lower is less.
When overbought, it can be a good time to sell/short. Use a higher Bollinger Band Multiplier such as 3 or more to reduce false positives.
When oversold, it can be a good time to buy/long. Use a higher Bollinger Band Multiplier such as 3 or more to reduce false positives.
Consider setting a much tighter lookback period of 4 as recommended in backtested works (en.wikipedia.org), use zlma instead of sma, and finally set a higher timeframe for the Bollinger Bands than the one you are currently studying. Then, the Bollinger Bands can help in detecting overbought and oversold regions (price going "out of bands").
Note that I tried to automate the setting of a higher timeframe, but for some reason the output is different when I manually do it using request.security() than when it's in indicator(timeframe=""). If someone has any suggestion as to why it happens, please let me know! (You can try it for yourself by uncommenting the auto_timeframe parameter line).
If you want to plot the indicator in a separate pane, and to also plot %B and bandwidth, I made another indicator "Generalized Bollinger Bands %B and Bandwidth by Tartigradia" that does that.
[Floride] 4 Layers of Bollinger Shadow
This is the indicator I named 4LBS. That means four layers of bollinger shadow.
This is an indicator that I made to see how far past prices could affect the future prices.
And I found some very interesting and beautiful things about it, and I wanted to share them with you, so I publish this indicator.
*-*-*-*-*-*-*-*-*-*-*-*-*-*-*-*-*-*-*-*-*-*-*-*-*-*-*-*-*-*-*-*-*-*-*-*-*-*-*-*-*-*-*-*-*-*-*-*-*-*-*-*-*-*-*-*-*-*-*-*-*-*-*-*-*-
Hello, nice to meet you all. my name as a trader is Floride.
First of all, I am not good at English, so there may be many grammatically incorrect sentences below.
I ask for your understanding in advance. Thanks for your understanding.
*-*-*-*-*-*-*-*-*-*-*-*-*-*-*-*-*-*-*-*-*-*-*-*-*-*-*-*-*-*-*-*-*-*-*-*-*-*-*-*-*-*-*-*-*-*-*-*-*-*-*-*-*-*-*-*-*-*-*-*-*-*-*-*-*-
What is it?
bollinger Bands usually has one moving average line. And there's two bands that uses same period value of standard deviation as the former MA. And this indicator, by the way, has a 4 shadow bands
that uses twice,three,four,five time the value of the MA's period.
Appearance -
This indicator has four layers, and there are also other layers between them.
You can turn on or off all the shadow layers.
Uses of Indicator and Examples
examples of actual use
1. market strongness diagnosis
-It seems all layers of shadow has some degree resist/support forces.
This indicator has the 4th layer - "L4". (indicated by red lines).
I saw emergence of volatility quite frequently when this last layer breaks through.
When price breaks through this area or line, shade appear on the L4 layer in red. and red cross appear on the that point. This is I called Marlin signal.
If you saw red color shadow in this indicator, then the market may have quite high volatility.
(of course, there's not 100%. Please be careful about this.)
But I've also checked in quite several markets. when this volatility emerges, then also that market seems to started to building quite directional power afterwards.
I mean, after the marlin signal, market tends to have bigger volatility, and tends to go one direction.
again, it's not 100%. but probability is quite high.
But maybe depending on the type of market you need some adjustment.
Recommended values are M2-1.618, M3-2.618
Or M2-1, M3-2. default value is M2-1.618, M3-2.618
and also, if prices breakthrough the channels, or layers, It tends to break through the at once, in first bar. In other words, if price don't break through the first or second candle, it's very likely that the price won't break through channel for the time being.
2. market weakness diagnosis
Usually, without external momentum, the price converges to the average value and does not deviate from the band. And if price fails to break through the most inner first layer-"L1 - the green channel", In that case, the market is usually assumed to be weak, or has low volatility.
- you can set alarms on tuna, marlin signal. and you don't have to watch chart all the time.
3. Signals
I put two signals in this indicator.
One has the name "Tuna," and the second has the name "Marlin."
As you can already tell from the name's feeling, tuna is a weaker signal and marlin is a stronger signal.
Actual example of a signal
1. Tuna signal
- When the tuna signal appears, you can guess that the current market is generally not weak. or has quite good directional force. or medium volatility.
Below is important.
- If a tuna signal appears, there is a possibility that a marlin will appear later.
- In my opinion, it might be wise not to have a position without a tuna signal.
- Almost all of the marlin signal appeared shortly after the tuna signal appeared.
2. Marlin signal
- When marlin signal appears, with a high probability, volatility can increase large.
- In the backtesting of the stock, in some cases, the market moved quite frequently in the direction of the marlin signal.
- The emergence of marlin can be seen as a pretty strong indication of the emergences of direction.
SUPER MACD📈 MACD Indicator Update - Version 2
🔹 New Features and Improvements:
1️⃣ New MACD Calculation Options:
Users can now choose from various Moving Averages to calculate the MACD. The default options are SMA (Simple Moving Average) and EMA (Exponential Moving Average), but there are 14 other versions available to experiment with:
SMA (Simple Moving Average)
EMA (Exponential Moving Average)
WMA (Weighted Moving Average)
RMA (Smoothed Moving Average)
HMA (Hull Moving Average)
JMA (Jurik Moving Average)
DEMA (Double Exponential Moving Average)
TEMA (Triple Exponential Moving Average)
LSMA (Least Squares Moving Average)
VWMA (Volume-Weighted Moving Average)
SMMA (Smoothed Moving Average)
KAMA (Kaufman’s Adaptive Moving Average)
ALMA (Arnaud Legoux Moving Average)
FRAMA (Fractal Adaptive Moving Average)
VIDYA (Variable Index Dynamic Average)
2️⃣ Improved Input Visibility and Organization:
We’ve reorganized the inputs so that the most commonly used ones are now placed at the beginning for quicker and more convenient configuration.
3️⃣ Bug Fixes and Code Improvements:
Minor bugs have been fixed, and the code has been optimized for better stability and performance. The code is now cleaner and fully functional in version 6.
4️⃣ Cometreon Public Library Integration:
To lighten the code and improve its modularity, we’ve integrated the Cometreon public library. This makes the code more efficient and reduces the need to duplicate common functions.
☄️ With this update, the MACD indicator becomes even more versatile and user-friendly, offering a wide range of calculation methods and an improved interface!

BB Signal v2.1 [ABA Invest]About
This signal appears based on 2nd candle break out of Bollinger Bands (called Momentum) with additional EMA 50 and EMA 200 as trend filters. so the concept is to take advantage of candle breakout by following trends.
How to use
Buy: When signal 'Buy' appears (following trend of upper timeframe)
Recommended stop loss: previous swing low
Sell: When signal 'Sell' appears (following trend of upper timeframe)
Recommended stop loss: previous swing high
Rules
1. use a good risk-reward ratio (minimum 1.5)
2. Please do backtest before using this signal
3. Don't always take every signal (must know when to stop)
double Bollinger BandsThis Bollinger Band indicator is a technical analysis tool defined by a set of trendlines plotted Four standard deviations (two positively and two negatively) away from a simple moving average (SMA) of a security's price, but which can be adjusted to user preference.

OB EmaCross + BBThis is my setup and the way I like to trade.
It is based in an EMA cross ( 9 x 21) and the Bollinger Bands without the central Moving Average.
I prefer to use the EMA cross in the middle of the bands.
It is also possible to activate "Colored Bars" to paint the candles according to the EMA cross: green if the candles are above both EMAs, white when at least one of them are in between EMAs and red if they are both below EMAs.
My operational works like this:
- Buy when price is above EMAs
- Sell when price is belos EMAs
Of course, I use BB to give me the direction of the trend and I only enter in a trade when the price is in the same trend of the BB.
I avoid trades when the bands are getting narrowed.
I hope you enjoy my indicator and let me know if you have any suggestion! ;)

Bollinger Bands Breakout Oscillator [LuxAlgo]The Bollinger Bands Breakout Oscillator is an oscillator returning two series quantifying the significance of breakouts between the price and the extremities of the Bollinger Bands indicator.
Settings
Length: Period of the Bollinger Bands indicator
Mult: Controls the width of the Bollinger Bands
Src: Input source of the indicator
Usage
Each series is calculated by summing the distance between price and a respective Bollinger Bands extremity in the case price is outside this extremity and divided by the sum of the absolute distance between price and a respective extremity. This sum is done over the most recent Length bars.
Bullish breakouts are represented by the green areas of the indicator, while bearish breakouts are represented by the red areas of the indicator.
The oscillator can determine the presence of an uptrend when the bullish area is superior to the bearish area, while a downtrend is indicated by a bearish area being superior to the bullish one. The significance of the breakout is determined by the amplitude of each area, with higher amplitudes indicating more significant breakouts or strong trends.
Using higher Mult values would naturally return wider bands, which would induce less frequent breakouts, this would be highlighted by the oscillator.
In the chart above we can see the oscillator using a multiplicative factor of 2.

K's Reversal Indicator IK's reversal indicator I is a special combination between Bollinger bands and the MACD oscillator. It is a contrarian indicator that depends on the following conditions:
• A buy signal is generated whenever the current market price is below the 100-period lower Bollinger band while simultaneously, the MACD value must be above its signal line. At the same time, the previous MACD value must be below its previous signal line.
• A sell (short) signal is generated whenever the current market price is above the 100-period upper Bollinger band while simultaneously, the MACD value must be below its signal line. At the same time, the previous MACD value must be above its previous signal line.
The way to use K's reversal indicator is to combine it with your already long/short bias in a sideways/range market in order to maximize the probability of success.
Limitations of the indicator include the following:
• There are no clear exit rules that work well on average across the markets. Even though K’s reversal indicator gives contrarian signals, it does not show when to exit the positions.
• As with other indicators, it underperforms on some markets and is not to be used everywhere.
• False signals tend to occur during trending markets but there is no proven way to detect a false signal.

Percentile Major Move Indicator This indicator is a powerful tool for understanding how big of a move a product, crypto, or currency has recently had.
Anything inside of the green bars is a standard move with a 68% chance of happening based on your chart timeframe.
Any move that touches the red lines to the upside or downside has a 2%+ chance of happening in either direction.
This is a powerful indicator but just one point of data and should be used as such.
K's Volatility BandsVolatility bands come in all shapes and forms contrary to what is believed. Bollinger bands remain the principal indicator in the volatility bands family. K's Volatility bands is an attempt at optimizing the original bands. Below is the method of calculation:
* We must first start by calculating a rolling measure based on the average between the highest high and the lowest low in the last specified lookback window. This will give us a type of moving average that tracks the market price. The specificity here is that when the market does not make higher highs nor lower lows, the line will be flat. A flat line can also be thought of as a magnet of the price as the ranging property could hint to a further sideways movement.
* The K’s volatility bands assume the worst with volatility and thus will take the maximum volatility for a given lookback period. Unlike the Bollinger bands which will take the latest volatility calculation every single step of time, K’s volatility bands will suppose that we must be protected by the maximum of volatility for that period which will give us from time to time stable support and resistance levels.
Therefore, the difference between the Bollinger bands and K's volatility bands are as follows:
* Bollinger Bands' formula calculates a simple moving average on the closing prices while K's volatility bands' formula calculates the average of the highest highs and the lowest lows.
* Bollinger Bands' formula calculates a simple standard deviation on the closing prices while K's volatility bands' formula calculates the highest standard deviation for the lookback period.
Applying the bands is similar to applying any other volatility bands. We can list the typical strategies below:
* The range play strategy : This is the usual reversal strategy where we buy whenever the price hits the lower band and sell short whenever it hits the upper band.
* The band re-entry strategy : This strategy awaits the confirmation that the price has recognized the band and has shaped a reaction around it and has reintegrated the whole envelope. It may be slightly lagging in nature but it may filter out bad trades.
* Following the trend strategy : This is a controversial strategy that is the opposite of the first one. It assumes that whenever the upper band is surpassed, a buy signal is generated and whenever the lower band is broken, a sell signal is generated.
* Combination with other indicators : The bands can be combined with other technical indicators such as the RSI in order to have more confirmation. This is however no guarantee that the signals will improve in quality.
* Specific strategy on K’s volatility bands : This one is similar to the first range play strategy but it adds the extra filter where the trade has a higher conviction if the median line is flat. The reason for this is that a flat line means that no higher highs nor lower lows have been made and therefore, we may be in a sideways market which is a fertile ground for mean-reversion strategies.
ViVen-Multi Time Frame Bollinger Band StrategyThis indicator created to identify the strong Support and Resistance levels based on the Bollinger Bands. When two different time frame Bollinger Bands are travelling together then its a strong Support or Resistance Levels.
I have added 5 Min, 15 Min, 30 Min, 1 Hr and 1 Day time frame Bollinger Bands in one Chart. You can select and combine whichever the TF you want.
Default values considered - Period - 20 and Std.Dev is 2
You can on/off the indicator based on the requirement.
Trade plan:
BUY - When price comes near to the Bottom Bollinger Band level (look for candle confirmation is plus). If multiple Bollinger bands travels together then is Strong Support. (Exit if Price Breaks down the BB)
SELL - When price reaches the Upper Bollinger Band level (look for candle confirmation is plus). If multiple Bollinger bands travels together then is Strong Support. (Exit if Price Breaks Up the BB)
Middle Line - is the 20 SMA line
When the Gap between Upper and Lower Band is narrow then we can expect a trending movement soon.

Compare Crypto Bollinger Bands//This is not financial advice, I am not a financial advisor.
//What are volatility tokens?
//Volatility tokens are ERC-20 tokens that aim to track the implied volatility of crypto markets.
//Volatility tokens get their exposure to an asset’s implied volatility using FTX MOVE contracts.
//There are currently two volatility tokens: BVOL and IBVOL.
//BVOL targets tracking the daily returns of being 1x long the implied volatility of BTC
//IBVOL targets tracking the daily returns of being 1x short the implied volatility of BTC.
/////////////////////////////////////////////////////////////////
CAN USE ON ANY CRYPTO CHART AS BINANCE:BTCUSD is still the most dominant crypto, positive volatility for BTC is positive for all.
/////////////////////////////////////////////////////////////////
//The Code.
//The blue line (ChartLine) is the current chart plotted on in Bollinger
//The red line (BVOLLine) plots the implied volatility of BTC
//The green line (IBVOLLine) plot the inverse implied volatility of BTC
//The orange line (TOTALLine) plots how well the crypto market is performing on the Bolling scale. The higher the number the better.
//There are 2 horizontal lines, 0.40 at the bottom & 0.60 at the top
/////////To Buy
//1. The blue line (ChartLine) must be higher than the green line (IBVOLLine)
//2. The green line (IBVOLLine) must be higher than the red line (BVOLLine)
//3. The red line (BVOLLine) must be less than 0.40 // This also acts as a trendsetter
//4. The orange line (TOTALLine) MUST be greater than the red line. This means that the crypto market is positive.
//5.IF THE BLUE LINE (ChartLine) IS GREATER THAN THE ORANGE LINE (TOTALLine) IT MEANS YOUR CRYPTO IS OUTPERFOMING THE MARKET {good for short term explosive bars}
//6. If the orange line (TOTALLine) is higher than your current chart, say BTCUSD. And BTC is going up to. It just means BTC is going up slowly. it's fine as long as they are moving in the same position.
//5. I use this on the 4hr, 1D, 1W timeframes
///////To Exit
//1.If the blue line (ChartLine) crosses under the green line (IBVOLLine) exit{ works best on 4hr,1D, 1W to avoid fakes}
//2.If the red line crosses over the green line when long. {close positions, or watch positions} It means negative volatility is wining

Beacon - Anthony Crudele's IndicatorBeacon uses the current volatility of the market based on your trading time frame to determine support and resistance levels, whether a trend is intact or ready to revert back in the range. One of the most difficult things I went through as a trader was determining whether we are in a trend day or if we are in grind up or grind down mode. I created Beacon to give me a simple look at the market to determine what type of environment we are in. I use Bollinger Bands (3 standard deviation) to determine the volatility cycle. Once the BB make peaks I took my Fibonacci Retracement tool and did a retracement from the peak high of the BB to the peak low. I use 70%, 50% and 30% for my support and resistance levels. I use those levels because I tested pretty much every percent level and those percentages averaged the highest performance on all tick charts and time charts. You can use Beacon on whatever time frame or tick chart you are trading on and it will determine that specific volatility cycle.

Short in Bollinger Band Down trend (Weekly and Daily) // © PlanTradePlanMM
// 6/14/2020
// ---------------------------------------------------
// Name: Short in Bollinger Band Down trend (Weekly and Daily)
// ---------------------------------------------------
// Key Points in this study:
// 1. Short in BB Lower band, probability of price going down is more than 50%
// 2. Short at the top 1/4 of Lower band (EMA - Lower line), Stop is EMA, tartget is Lower line; it matches risk:/reward=1:3 naturally
//
// Draw Lines:
// BB Lower : is the Target (Black line)
// BB EMA : is the initial Stop (Black line)
// ShortLine : EMA - 1/4 of (Stop-target), which matches risk:/reward=1:3
// Prepare Zone : between EMA and ShortLine
// shortPrice : Blue dot line only showing when has Short position, Which shows entry price.
// StopPrice : Black dot line only showing when has Short position, Which shows updated stop price.
//
// Add SMA50 to filter the trend. Price <= SMA, allow to short
//
// What (Condition): in BB down trend band
// When (Price action): Price cross below ShortLine;
// How (Trading Plan): Short at ShortLine;
// Initial Stop is EMA;
// Initial Target is BB Lower Line;
// FollowUp: if price moves down first, and EMA is below Short Price. Move stop to EMA, At least "make even" in this trade;
// if Price touched Short Line again and goes down, new EMA will be the updated stop
//
// Exit: 1. Initial stop -- "Stop" when down first, Close above stop
// 2. Target reached -- "TR" when down quickly, Target reached
// 3. make even -- "ME" when small down and up, Exit at Entry Price
// 4. Small Winner -- "SM" when EMA below Entry price, Exit when Close above EMA
//
// --------------
// Because there are too many flags in up trend study already, I created this down trend script separately.
// Uptrend study is good for SPY, QQQ, and strong stocks.
// Downtrend Study is good for weak ETF, stock, and (-2x, -3x) ETFs, such as FAZ, UVXY, USO, XOP, AAL, CCL
// -----------------------------------------------------------------------------------------------------------------
// Back test Weekly and daily chart for SPY, QQQ, XOP, AAL, BA, MMM, FAZ, UVXY
// The best sample is FAZ Weekly chart.
// When SPY and QQQ are good in long term up trend, these (-2x, -3x) ETFs are always going down in long term.
// Some of them are not allowed to short. I used option Put/Put spread for the short entry.
//

Buy in Bollinger Band uptrend (Weekly and Daily) // © PlanTradePlanMM 6/14/2020
// ---------------------------------------------------
// Name: Buy in Bollinger Band uptrend (Weekly and Daily)
// ---------------------------------------------------
// Key Points in this study:
// 1. Long in BB Upper band, probability of price going up is more than 50%
// 2. Buy at the bottom 1/4 of upper band (Upper line - EMA), Stop is EMA, tartget is Upper line; it matches risk:reward=1:3;
//
// Draw Lines:
// BB Upper : is the Target (Black line)
// BB EMA : is the initial Stop (Black line)
// BuyLine : EMA20 + 1/4 of (Target-Stop), which matches risk:/reward=1:3 naturally
// Prepare Zone : between EMA and BuyLine
// buyPrice : Blue dot line only showing when has long position, Which shows entry price.
// StopPrice : Black dot line only showing when has long position, Which shows updated stop price.
//
// Add SMA(50) to filter the trend. Price >= SMA, allow to long
//
// What (Condition): in BB uptrend band
// When (Price action): Price cross over BuyLine;
// How (Trading Plan): Buy at BuyLine;
// Initial Stop is EMA;
// Initial Target is BB Upper Line;
//
// FollowUp: if price moves up first, and the EMA is higher than Entry point, Use EMA as new stop. At least "make even" in this trade;
//
// Exit: 1. Initial stop -- "Stop" when down first, close below stop price.
// 2. Target reached -- "TR" when up quickly, Target reached
// 3. make even -- "ME" when small up and down, Exit at entry Price
// 4. Small Winner -- "SM" when EMA above Entry price, Exit when close below EMA, and higher than entry Price
//
// --------------
// Because there are too many flags in up trend study already, I will create a down trend script separately.
// Uptrend study is good for SPY, QQQ, and strong stocks.
// Downtrend Study is good for weak ETF, stock, and (-2x, -3x) ETFs, such as FAZ, UVXY, USO, XOP, AAL, CCL
// -----------------------------------------------------------------------------------------------------------------
// Back test Weekly and daily chart for SPY, QQQ
// If it will be a big Gap down or a big down move, stop at close price could be a big loss; But this way could avoid may noise, to stay in a trending position longer.
// When buy in trending move, the position could be hold for a big range.
// The best samples are SPY and QQQ daily chart.
//
// Better to use another way to verify the long term up trend first.
// For single stock, it is better shows more relative strength than SPY.
