BBS – Bond Breadth Signal"When bonds scream, breadth collapses, and fear spikes — BBS listens."
🧠 BBS – Bond Breadth Signal
A reversal timing tool built on macro conviction, not price noise.
The Bond Breadth Signal (BBS) was developed to identify major market inflection points by combining four key market stress indicators:
1) 10-Year Yield ROC – Measures sharp moves in the bond market
2) Z-Score of the 10Y – Captures statistical extremes
3) NSHF (Net Highs–Lows) – Signals internal market strength or weakness
4) TLT ROC + VIX – Confirmations of flight to safety and volatility-driven fear
When all conditions align, BBS marks either a For-Sure Buy or For-Sure Sell — these are rare, high-confidence signals designed to cut through noise and focus on true market dislocations.
🔧 Features:
-Background color and signal arrows on confirmation days
-Signals remain visually active for 3 days for added clarity
-Fully adjustable thresholds and alert toggles
-Plot panel for yield, TLT, NSHF, VIX, and Z-score visuals
This tool isn’t designed to fire every day. It’s meant to wait for those moments when the market truly bends — not just wiggles.
Best used on major indices (SPY, QQQ, IWM) to assess macro turning points.
Breadth

Market Breadth Toolkit [LuxAlgo]The Market Breadth Toolkit allows traders to use up to 6 different market breadth measures on two different exchanges, for a total of 12 different views of the market.
This toolkit includes divergence detection and allows setting custom fixed levels for traders who want to experiment with them.
🔶 USAGE
The main idea behind Breadth is to measure the number of advancing and declining issues and/or volume by exchange to have an idea of the underlying strength of the whole exchange.
On the other hand, thrusts represent big impulses in the breadth, as it is described by technicians to be the start of a new bullish trend.
By default, the Toolkit is set to "Breadth Thrust Zweig", with divergences enabled.
We will now explain all the different breadth measures available in the toolkit.
🔹 Deemer Breakaway Momentum
The "Breakaway Momentum" is a concept related to market breadth introduced by legendary technical analyst Walter Deemer.
As stated on his website:
We coined the term "breakaway momentum" in the 1970's to describe this REALLY powerful upward momentum
and:
We now know that the stock market generates breakaway momentum when the 10-day total advances on the NYSE are greater than 1.97 times the 10-day total NYSE declines OR the 20-day total advances on the NYSE are greater than 1.72 times the 20-day total NYSE declines.
As we can see in the chart above, which shows both methods, momentum is identified when the ratio of advancing issues to declining issues is greater than 1.97 for the 10-day average or 1.72 for the 20-day average.
🔹 Zweig Breadth Tools
Legendary trader and author Marting Zweig, best known as the author of "Winning on Wall Street" and the creator of the Put/Call Ratio.
In this toolkit, we feature two of his other tools:
Breadth Thrust: Number of Advancing / (Number of Advancing + Number of Declining Stocks)
Market Thrust: (Number of Advancing × Advancing Volume) — (Number of Declining Stocks × Declining Volume)
As we can see on the above chart, the Breadth Thrust printed a new signal on April 24, 2025, which is a bullish signal on the daily chart that can last several months, considering the previous signals.
On the right side, we have the Market Thrust as the delta between advancing minus declining volume weighted.
🔹 Whaley Measures
Wayne Whaley received the 2010 Charles Dow Award from the CMT Association, as stated on their website: "In 1994, the CMT Association established the Charles H. Dow Award to recognize outstanding research in technical analysis."
We include two of the tools from this paper:
Advance Decline Thrust: Number of Advancing / (Number of Advancing + Number of Declining Stocks)
Up/Down Volume Thrust Advancing Volume / (Advancing Volume + Declining Volume)
The chart above shows Thrust signals at extreme readings as described in the paper.
🔹 Divergences
The divergence detector is enabled by default, traders can disable it and fine-tune the detection length in the settings panel.
🔹 Fixed Levels
Traders can adjust the Thrust detection thresholds in the settings panel.
In the image above, we can see the Deemer Breakaway Momentum 10 with the original threshold (below) and with the 3.0 threshold (above).
🔶 SETTINGS
Breadth: Choose between 6 different breadth thrust measurement methods.
Data: Choose between NYSE or NASDAQ exchanges.
Divergences: Enable/Disable divergences and select the length detection.
🔹 Levels
Use Fixed Levels: Enable/Disable Fixed Levels.
Top Level: Select the top-level threshold.
Bottom Level: Select bottom level threshold.
Levels Style: Choose between dashed, dotted, or solid style.
🔹 Style
Breadth: Select breadth colors
Divergence: Select divergence colors

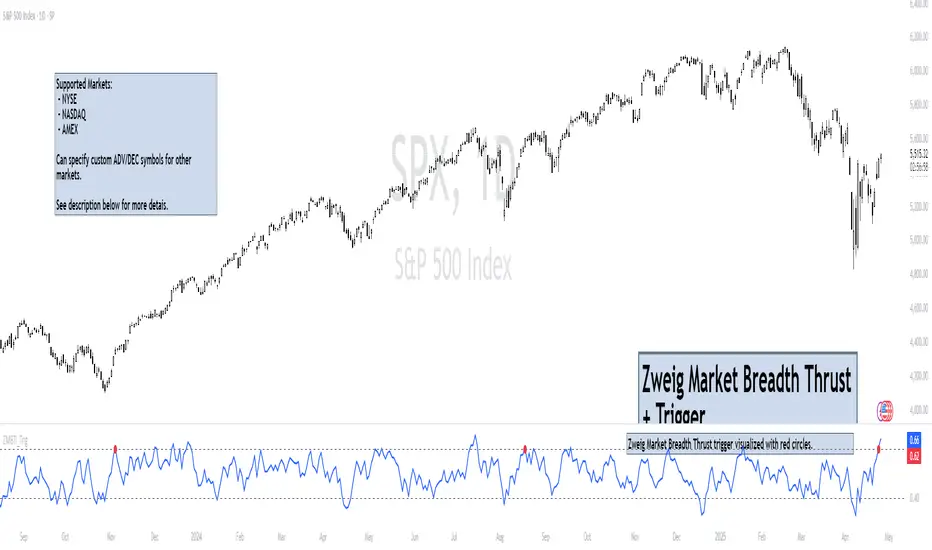
Zweig Market Breadth Thrust Indicator+Trigger [LazyBear x rwak]The Breadth Thrust (BT) indicator is a market momentum indicator developed by Dr. Martin Zweig. According to Dr. Zweig, a Breadth Thrust occurs when, during a 10-day period, the Breadth Thrust indicator rises from below 40 percent to above 61.5 percent.
A "Thrust" indicates that the stock market has rapidly changed from an oversold condition to one of strength, but has not yet become overbought. This is very rare and has happened only a few times. Dr. Zweig also points out that most bull markets begin with a Breadth Thrust.
This version of the Breadth Thrust indicator includes a trigger visualized with red circles, making it easier to spot when the indicator crosses the critical 61.5% level, signaling potential bullish momentum.
All parameters are configurable. You can draw BT for NYSE, NASDAQ, AMEX, or based on combined data (i.e., AMEX+NYSE+NASD). There is also a "CUSTOM" mode supported, so you can enter your own ADV/DEC symbols.
Credit: The original Breadth Thrust logic was created by LazyBear, whose public indicators can be found here , and app-store indicators here .
More info:
Definition of Breadth Thrust
A Breadth Thrust Signal
A Rare "Zweig" Buy Signal
Zweig Breadth Thrust: Redux
Internals Elite NYSE [Beta]Overview:
This indicator is designed to provide traders with a quick overview of key market internals and metrics in a single, easy-to-read table displayed directly on the chart. It incorporates a variety of metrics that help gauge market sentiment, momentum, and overall market conditions.
The table dynamically updates in real-time and uses color-coding to highlight significant changes or thresholds, allowing traders to quickly interpret the data and make informed trading decisions.
Features:
Market Internals:
TICK: Measures the difference between the number of stocks ticking up versus those ticking down on the NYSE. Green or red background indicates if it crosses a user-defined threshold.
Advance/Decline (ADD): Shows the net number of advancing versus declining stocks on the NYSE. Color-coded to show positive, negative, or neutral conditions.
Volatility Metrics:
VIX Change (%): Displays the percentage change in the Volatility Index (VIX), a key gauge of market fear or complacency. Color-coded for direction.
VIX Price: Displays the current VIX price with thresholds to indicate low, medium, or high volatility.
Other Market Metrics:
DXY Change (%): Percentage change in the US Dollar Index (DXY), indicating dollar strength or weakness.
VWAP Deviation (%): Percentage of stocks above VWAP (Volume Weighted Average Price), helping traders assess intraday buying and selling pressure.
Asset-Specific Metrics:
BTCUSD Change (%): Percentage change in Bitcoin (BTC) price, useful for monitoring cryptocurrency sentiment.
SPY Change (%): Percentage change in the S&P 500 ETF (SPY), a proxy for the overall stock market.
Current Ticker Change (%): Percentage change in the currently selected ticker on the chart.
US10Y Change (%): Percentage change in the yield of the 10-Year US Treasury Note (TVC:US10Y), an important macroeconomic indicator.
Customizable Appearance:
Adjustable text size to suit your chart layout.
User-defined thresholds for key metrics (e.g., TICK, ADD, VWAP, VIX).
Dynamic Table Placement:
You can position the table anywhere on the chart: top-right, top-left, bottom-right, bottom-left, middle-right, or middle-left.
How to Use:
Add the Indicator to Your Chart:
Apply the indicator to your chart from the Pine Script editor in TradingView.
Customize the Inputs:
Adjust the thresholds for TICK, ADD, VWAP, and VIX according to your trading style.
Enable or disable the metrics you want to see in the table by toggling the display options for each metric (e.g., Show TICK, Show BTC, Show SPY).
Set the table placement to your preferred position on the chart.
Interpret the Table:
Look for color-coded cells to quickly identify significant changes or breaches of thresholds.
Positive values are typically shown in green, negative values in red, and neutral/insignificant changes in gray.
Use metrics like TICK and ADD to gauge market breadth and momentum.
Refer to VWAP deviation to assess intraday buying or selling pressure.
Monitor the VIX and US10Y changes to stay aware of macroeconomic and volatility shifts.
Incorporate Into Your Strategy:
Use the indicator alongside technical analysis to confirm setups or identify areas of caution.
Keep an eye on correlated metrics (e.g., VIX and SPY) for broader market context.
Use BTCUSD or DXY as additional indicators of risk-on/risk-off sentiment.
Ideal Users:
Day Traders: Quickly gauge intraday market conditions and momentum.
Swing Traders: Identify broader sentiment shifts using metrics like ADD, DXY, and US10Y.
Macro Investors: Stay updated on key macroeconomic indicators like the 10-Year Treasury yield (US10Y) and the US Dollar Index (DXY).
This indicator serves as a comprehensive tool for understanding market conditions at a glance, enabling traders to act decisively based on the latest data.

4C Data Table SuiteOverview
The 4C Data Table Suite is a versatile TradingView indicator, designed for traders who focus on the critical role of prior bar levels in their strategy. By highlighting the high and low points of previous bars, this tool aids in pinpointing crucial support and resistance zones, which often act as psychological triggers for market participants. The unique feature of this indicator is its dual-color coding: it colors bars green for bullish closes and red for bearish closes in the Prior Bar Table, and for the current timeframe, it highlights whether the current price is above (green) or below (red) these levels.
Concepts
1 — This sophisticated indicator is not just about visual cues; it provides a rich tableau of data including:
• Current timeframe countdown to bar close
• GMT-adjusted clock for precise trade timing
• Real-time updates on market internals and volatility measures such as the NYSE TICK and ATR
2 — The configuration is highly customizable, allowing users to:
• Adjust the table's positioning and text size
• Choose color settings for text, background, and borders to suit their visual preference
• Toggle the display of various data components based on their trading needs
3 — The Prior Bar Table is particularly valuable for:
• Traders using prior bar levels as triggers for trade entries and exits
• Quick visual assessment of market sentiment
• Real-time decision-making supported by dynamic color coding based on current price movements relative to prior highs and lows
Features
• Prior Bar Levels Table: Visualizes high and low levels of prior bars with intuitive color coding, aiding traders in assessing market trends.
• Dynamic Color Coding: Updates colors based on the closure of the previous bar and current price positions relative to the past bar's highs and lows.
• Comprehensive Market Data: Includes a suite of essential data such as market internals, the prior bar’s range, and the latest price information.
• Customizable Visuals: Offers extensive options for customizing the appearance and data presented, ensuring the tool fits seamlessly into any trader's strategy.
How to Use
1. To add the indicator, search for "4C Data Table Suite" under indicators on TradingView and apply it to your chart.
2. Navigate to the indicator settings to customize the display properties, including table position, color schemes, and which data points to display.
3. Utilize the toggles within the "Prior Bar Levels Table" settings to adjust the visibility and behavior of the table, depending on your trading approach.
Limitations
• This indicator is optimized for use on time-based charts and may not perform as intended on tick charts or non-standard timeframes.
• The color coding is based on the closure of bars, which may not always reflect intrabar movements, potentially affecting real-time decision-making in highly volatile markets.
Notes
• Ensure your TradingView interface is set to the correct timezone settings to align the GMT clock accurately.
• The dynamic color updates are designed to provide at-a-glance insights but should be used in conjunction with other analysis tools for best results.
*If you find that the indicator is blocking some of the candles at the bottom of the screen, go to (Chart) Settings, Canvas, and then adjust the Bottom/Top margin by increasing the % Amount.
Thanks
Special thanks to the TradingView community and developers whose feedback and insights have helped refine the functionalities of the 4C Data Table Suite. Your collaborative spirit is what makes continuous improvement possible.

Market Breadth - AsymmetrikMarket Breadth - Asymmetrik User Manual
Overview
The Market Breadth - Asymmetrik is a script designed to provide insights into the overall market condition by plotting three key indicators based on stocks within the S&P 500 index. It helps traders assess market momentum and strength through visual cues and is especially useful for understanding the proportion of stocks trading above their respective moving averages.
Features
1. Market Breadth Indicators:
- Breadth 20D (green line): Represents the percentage of stocks in the S&P 500 that are above their 20-day moving average.
- Breadth 50D (yellow line): Represents the percentage of stocks in the S&P 500 that are above their 50-day moving average.
- Breadth 100D (red line): Represents the percentage of stocks in the S&P 500 that are above their 100-day moving average.
2. Horizontal Lines for Context:
- Green line at 10%
- Lighter green line at 20%
- Grey line at 50%
- Light red line at 80%
- Dark red line at 90%
3. Background Color Alerts:
- Green background when all three indicators are under 20%, indicating a potential oversold market condition.
- Red background when all three indicators are over 80%, indicating a potential overbought market condition.
Interpreting the Indicator
- Market Breadth Lines: Observe the plotted lines to assess the percentage of stocks above their moving averages.
- Horizontal Lines: Use the horizontal lines to quickly identify important threshold levels.
- Background Colors: Pay attention to background colors for quick insights:
- Green: All indicators suggest a potentially oversold market condition (below 20).
- Red: All indicators suggest a potentially overbought market condition (above 80).
Troubleshooting
- If the indicator does not appear as expected, please contact me.
- This indicator works only on daily and weekly timeframes.
Conclusion
This Market Breadth Indicator offers a visual representation of market momentum and strength through three key indicators, helping you identify potential buying and selling zones.

Stocks Above 5-Day Average (FOMO)Overview
Inspired by Matt Carusos's FOMO indicator, this breadth indicator is designed to provide a visual representation of the percentage of stocks within major indices that are trading above their 5-day moving average.
Functionality
The indicator plots the percentage of stocks trading above their 5-day moving average for the following indices:
S&P 500
Nasdaq
Russell 2000
Dow Jones
All Markets (MMFD)
The indicator includes two horizontal lines:
Upper Threshold: Default at 85%
Lower Threshold: Default at 15%
These lines are used to identify potential overbought (above upper threshold) or oversold (below lower threshold) conditions.
Plot Shapes:
Small circles are plotted at the points where the percentage of stocks crosses the upper or lower thresholds, with colors matching the respective index.
Table:
The current percentage of stocks above the 5-day average for each index.
A warning sign (⚠️) is shown in the table if the percentage crosses the upper or lower threshold, regardless of whether the index plot is enabled or not.

Growth TrendThis powerful indicator plots the number of growth stocks in an uptrend, providing a comprehensive view of the market's overall direction. By applying a simple moving average, users can quickly gauge the trend and make informed trading decisions.
How does it work?
The script pulls tickers from the S & P 500 Growth ETF. It then plots the number of stocks from the ETF that are trending above a medium-term Moving Average, signaling an uptrend.
A moving average is applied to help understand the trend.
The background is shaded when 3 or more consecutive days are above (green) or below (red) the moving average.
Key Features:
Visual Trend Identification: The indicator shades the background green when three or more consecutive days are above the moving average, indicating a strong uptrend. Conversely, it shades red when three consecutive days are below the moving average, signaling a downtrend.
Breakout Insights: By tracking the trend, traders can identify when breakouts in growth stocks are more likely to occur or fail. This helps traders time their entries and exits more effectively.
Trend Strength Assessment: The indicator provides a quick visual assessment of the trend's strength, enabling traders to adjust their strategies accordingly.
Why is this indicator helpful?
Improved Trading Decisions: By understanding the overall trend and strength of growth stocks, traders can make more informed decisions about when to buy or sell.
Enhanced Risk Management: The indicator helps traders identify potential trend reversals, enabling them to adjust their positions and manage risk more effectively.
Market Insights: The Growth Stock Trend Indicator provides a valuable perspective on the market's overall direction, helping traders stay ahead of the curve.
By incorporating this indicator into their trading strategy, traders can gain a competitive edge and make more informed decisions in the growth stock market.

Breadth Indicators NYSE Percent Above Moving AverageBreadth Indicators NYSE - transmits the processed data from the Barchart provider
NYSE - Breadth Indicators
S&P 500 - Breadth Indicators
DOW - Breadth Indicators
RUSSEL 1000 - Breadth Indicators
RUSSEL 2000 - Breadth Indicators
RUSSEL 3000 - Breadth Indicators
Moving Average - 5, 20, 50, 100, 150, 200
The "Percentage above 50-day SMA" indicator measures the percentage of stocks in the index trading above their 50-day moving average. It is a useful tool for assessing the general state of the market and identifying overbought and oversold conditions.
One way to use the "Percentage above 50-day SMA" indicator in a trading strategy is to combine it with a long-term moving average to determine whether the trend is bullish or bearish. Another way to use it is to combine it with a short-term moving average to identify pullbacks and rebounds within the overall trend.
The purpose of using the "Percentage above 50-day SMA" indicator is to participate in a larger trend with a better risk-reward ratio. By using this indicator to identify pullbacks and bounces, you can reduce the risk of entering trades at the wrong time.
Bull Signal Recap:
150-day EMA of $SPXA50R crosses above 52.5 and remains above 47.50 to set the bullish tone.
5-day EMA of $SPXA50R moves below 40 to signal a pullback
5-day EMA of $SPXA50R moves above 50 to signal an upturn
Bear Signal Recap:
150-day EMA of $SPXA50R crosses below 47.50 and remains below 52.50 to set the bearish tone.
5-day EMA of $SPXA50R moves above 60 to signal a bounce
5-day EMA of $SPXA50R moves below 50 to signal a downturn
Tweaking
There are numerous ways to tweak a trading system, but chartists should avoid over-optimizing the indicator settings. In other words, don't attempt to find the perfect moving average period or crossover level. Perfection is unattainable when developing a system or trading the markets. It is important to keep the system logical and focus tweaks on other aspects, such as the actual price chart of the underlying security.
What do levels above and below 50% signify in the long-term moving average?
A move above 52.5% is deemed bullish, and below 47.5% is deemed bearish. These levels help to reduce whipsaws by using buffers for bullish and bearish thresholds.
How does the short-term moving average work to identify pullbacks or bounces?
When using a 5-day EMA, a move below 40 signals a pullback, and a move above 60 signals a bounce.
How is the reversal of pullback or bounce identified?
A move back above 50 after a pullback or below 50 after a bounce signals that the respective trend may be resuming.
How can you ensure that the uptrend has resumed?
It’s important to wait for the surge above 50 to ensure the uptrend has resumed, signaling improved breadth.
Can the system be tweaked to optimize indicator settings?
While there are various ways to tweak the system, seeking perfection through over-optimizing settings is advised against. It's crucial to keep the system logical and focus tweaks on the price chart of the underlying security.
RUSSIAN \ Русская версия.
Индикатор "Процент выше 50-дневной скользящей средней" измеряет процент акций, торгующихся в индексе выше их 50-дневной скользящей средней. Это полезный инструмент для оценки общего состояния рынка и выявления условий перекупленности и перепроданности.
Один из способов использования индикатора "Процент выше 50-дневной скользящей средней" в торговой стратегии - это объединить его с долгосрочной скользящей средней, чтобы определить, является ли тренд бычьим или медвежьим. Другой способ использовать его - объединить с краткосрочной скользящей средней, чтобы выявить откаты и отскоки в рамках общего тренда.
Цель использования индикатора "Процент выше 50-дневной скользящей средней" - участвовать в более широком тренде с лучшим соотношением риска и прибыли. Используя этот индикатор для выявления откатов и отскоков, вы можете снизить риск входа в сделки в неподходящее время.
Краткое описание бычьего сигнала:
150-дневная ЕМА на уровне $SPXA50R пересекает отметку 52,5 и остается выше 47,50, что задает бычий настрой.
5-дневная ЕМА на уровне $SPXA50R опускается ниже 40, сигнализируя об откате
5-дневная ЕМА на уровне $SPXA50R поднимается выше 50, сигнализируя о росте
Обзор медвежьих сигналов:
150-дневная ЕМА на уровне $SPXA50R пересекает уровень ниже 47,50 и остается ниже 52,50, что указывает на медвежий настрой.
5-дневная ЕМА на уровне $SPXA50R поднимается выше 60, сигнализируя о отскоке
5-дневная ЕМА на уровне $SPXA50 опускается ниже 50, что сигнализирует о спаде
Корректировка
Существует множество способов настроить торговую систему, но графологам следует избегать чрезмерной оптимизации настроек индикатора. Другими словами, не пытайтесь найти идеальный период скользящей средней или уровень пересечения. Совершенство недостижимо при разработке системы или торговле на рынках. Важно поддерживать логику системы и уделять особое внимание другим аспектам, таким как график фактической цены базовой ценной бумаги.
Что означают уровни выше и ниже 50% в долгосрочной скользящей средней?
Движение выше 52,5% считается бычьим, а ниже 47,5% - медвежьим. Эти уровни помогают снизить риски, используя буферы для бычьих и медвежьих порогов.
Как краткосрочная скользящая средняя помогает идентифицировать откаты или отскоки?
При использовании 5-дневной ЕМА движение ниже 40 указывает на откат, а движение выше 60 указывает на отскок.
Как определяется разворот отката или отскока?
Движение выше 50 после отката или ниже 50 после отскока сигнализирует о возможном возобновлении соответствующего тренда.
Как вы можете гарантировать, что восходящий тренд возобновился?
Важно дождаться скачка выше 50, чтобы убедиться в возобновлении восходящего тренда, сигнализирующего о расширении диапазона.
Можно ли настроить систему для оптимизации настроек индикатора?
Хотя существуют различные способы настройки системы, не рекомендуется стремиться к совершенству с помощью чрезмерной оптимизации настроек. Крайне важно сохранить логичность системы и сфокусировать изменения на ценовом графике базовой ценной бумаги.

IBD PowerTrendThis IBD PowerTrend indicator is designed to help traders identify strong market uptrends based on the IBD Market School's Power Trend methodology. It is intended to be added to daily charts on major indexes.
Concept and Methodology
The IBD PowerTrend helps traders identify strong market uptrends. Markets generally exist in three states: uptrends, downtrends, and rangebound motion. This methodology focuses on:
Downtrends: Stay out of the market.
Rangebound markets: Often frustrating, best avoided.
Uptrends: Identify the strongest uptrends early.
This indicator uses IBD's research on historical uptrends to help traders get in and stay in during robust market phases.
How It Works
A PowerTrend starts when the following four conditions are met simultaneously on a major index:
10-Day Low Above 21-Day EMA : The market's low must be above the 21-day exponential moving average (EMA) for at least 10 consecutive days.
21-Day EMA Above 50-Day SMA : The 21-day EMA must be above the 50-day simple moving average (SMA) for at least five consecutive days.
50-Day SMA Uptrend : The 50-day SMA must be in an uptrend (one day is sufficient).
Market Closes Up : The market must close higher than the previous day's close.
A PowerTrend typically ends when the 21-day EMA crosses back below the 50-day SMA. However, there are rare cases where a PowerTrend can end early due to a circuit breaker or a follow-through day failure. In this script, a circuit breaker is defined as a break of the 50-day line and being more than 10% below recent highs (interpreted as three months).
How to Use
When the PowerTrend is active, the indicator will plot green circles, signaling a strong market uptrend. During these periods, traders might observe opportunities in growth stocks breaking out of sound bases and consider the use of margin. Conversely, during downtrends, the indicator suggests a more defensive approach.
It is recommended to use on daily timeframe.
Chart Description
Main Chart:
- EMA 21 (blue): The 21-day exponential moving average.
- SMA 50 (red): The 50-day simple moving average.
First Panel:
- IBD PowerTrend Indicator: Plots the PowerTrend status with green circles indicating an active PowerTrend.
Second Panel:
- Volume Bars

NYSE TickThe NYSE Tick indicator is a market breadth indicator used to determine short-term bullish or bearish market sentiment. The NYSE Tick index compares the number of stocks on the New York Stock Exchange that are ticking up to the number of stocks ticking down at a specific moment in time. When the NYSE Tick is hovering around the zero line, roughly the same number of stocks are ticking up as are ticking down. When the overall market is rising it will usually present on the NYSE Tick as a rise in value that will generally stay mostly above the zero line for a period of time. The opposite is true when the general market is falling and can be seen as the NYSE Tick staying mostly below the zero line. This information can be very helpful for a short-term day trader who trades a market that also follows many of these same stocks, like the E-Mini S&P 500 Futures (ES), for example. While the index can theoretically rise or fall to over ±2,000 if all stocks on the NYSE are ticking up or down at the same time, it’s generally considered an extreme movement if the NYSE Tick is ±1,000. For this reason, the indicator has default reference lines at ±1,000 and halfway marks at ±500. In order to partially smooth out the movement and make movement trends more easily read, the indicator plots the values using Heikin Ashi candles instead of the standard bars or candlesticks. The price-line value displayed is an accurate live value, however, rather than the OHLC average value of a standard Heikin Ashi candle. Since the standard hours for the NYSE are Monday – Friday, 09:30 – 16:00 EST, the indicator only plots bars during this time.

Broad market index / quantifytools- Overview
Broad market index is a market breadth based oscillator, depicting broad market trend by analysing ratio between symbols moving up and symbols moving down in a given market. When market breadth is positive, more symbols are going up and when negative, more symbols are going down. As markets tend to correlate, broad market trend dictates likely path for all individual symbols that make up the market.
This tool provides market breadth for US equities (based on NYSE advancers - decliners) and ability to build two custom breadth baskets with up to 39 symbols included in each. Market breadth can be customized with variety of smoothing options, weighting and threshold modes to find most optimal rules for trend following. Performance of the model is reflected on metrics showing percentage of up/down moves during bullish/bearish states.
Example
↑ 63% = 63% of price moves during positive breadth state are to the upside
↓ 59% = 59% of price moves during negative breadth state are to the downside
Breadth state is colorized on line and chart according to its state (negative/positive/equilibrium) and direction (trending up/down). Upper and lower bands depict historical turning points in breadth for identifying extremes in broad market trend. Triangles mark breadth thrusts, in other words abnormally large moves in breadth at either upper or lower extreme. Breadth thrusts can serve as early signs of broad market trend reverting.
- Concept and features
By default, market breadth is calculated based on NYSE advancers - decliners, usable for all major indices that depict broad markets in US equities (SP500, QQQ, IWM). Users can also build 2 custom breadth baskets consisting of up to 39 symbols for defining broad market on other asset classes, such as cryptocurrencies. Custom baskets are suitable for any chart that fairly represents a market as a whole.
Example
Basket consisting of cryptocurrencies = Use on CRYPTOCAP:TOTAL (all cryptocurrencies aggregated)
Basket consisting of healthcare stocks = Use on AMEX:XLV (healthcare sector ETF)
Breadth line can be further refined using various smoothing options (SMA, EMA, HMA, RMA, WMA), threshold method and weights. By default, threshold (dividing line between bullish and bearish states) is set to fixed at 0, depicting an equilibrium where equal amount of symbols are going up and down.
Threshold mode can also be set to Dynamic, switching threshold to a moving average of the breadth line. Fundamental functionality still remains, breadth line above threshold marks bullish state and below threshold marks bearish state. Difference here is that the threshold no longer depicts a point of equilibrium, but simply a smoothed version of the breadth line itself, which can catch turns in broad market trend earlier.
Breadth basket can be adjusted to volatility of the viewed chart, causing an overstating of breadth on high volatility and understating on low volatility. Weighting takes into account magnitude of up/down moves, which can provide better relevance for trend following purposes.
- Practical guide
Example #1 : Broad market trend
The utility of market breadth is based on the idea that markets correlate and individual symbols making up the market will eventually join the broad market trend. With this in mind, going against broad market is like swimming upstream, it's going to be the hard way. A well performing basket with clear skew for upside and downside on respective breadth states can be used to form directional bias for trades and risk on/off regimes for investing.
Example #2 : Broad market reversals
Thrusts signify two things: a historical extreme in breadth and an aggressive move to the opposite direction. Thrusts are valuable clues for exhaustion in broad market trend, potentially leading to a reversal.
Example #3 : Breadth/price divergences
Market breadth and price diverging signify events where most symbols that make up the market are going one way but a few high weight symbols (big tech for SP500) are going the other way. In other words, only a few symbols are moving the market while general interest and intention is to the other direction. Divergences in breadth and price are not ideal for sustainable trend and can be expected to eventually revert to the direction of broad market.

Market Average TrendThis indicator aims to be complimentary to SPDR Tracker , but I've adjusted the name as I've been able to utilize the "INDEX" data provider to support essentially every US market.
This is a breadth market internal indicator that allows quick review of strength given the 5, 20, 50, 100, 150 and 200 simple moving averages. Each can be toggled to build whatever combinations are desired, I recommend reviewing classic combinations such as 5 & 20 as well as 50 & 200.
It's entirely possible that I've missed some markets that "INDEX" provides data for, if you find any feel free to drop a comment and I'll add support for them in an update.
Markets currently supported:
S&P 100
S&P 500
S&P ENERGIES
S&P INFO TECH
S&P MATERIALS
S&P UTILITIES
S&P FINANCIALS
S&P REAL ESTATE
S&P CON STAPLES
S&P HEALTH CARE
S&P INDUSTRIALS
S&P TELECOM SRVS
S&P CONSUMER DISC
S&P GROWTH
NAS 100
NAS COMP
DOW INDUSTRIAL
DOW COMP
DOW UTILITIES
DOW TRANSPORTATION
RUSSELL 1000
RUSSELL 2000
RUSSELL 3000
You can utilize this to watch stocks for dip buys or potential trend continuation entries, short entries, swing exits or numerous other portfolio management strategies.
If using it with stocks, it's advisable to ensure the stock often follows the index, otherwise obviously it's great to use with major indexes and determine holdings sentiment.
Important!
The "INDEX" data provider only supplies updates to all of the various data feeds at the end of day, I've noticed quite some delays even after market close and not taken time to review their actual update schedule (if even published). Therefore, it's strongly recommended to mostly ignore the last value in the series until it's the day after.
Only works on daily timeframes and above, please don't comment that it's not working if on other timeframes lower than daily :)
Feedback and suggestions are always welcome, enjoy!

TICK Strength Background ShadeThis indicator shades the background of each candle based on the strength off the current TICK.US chart. User can define the strength levels, which are by default set to 1-299 (lightest), 300-599, and 600+ (darkest). Best used on lower timeframe charts to help identify whether or not to remain in a trend, or if a trend is possibly reversing when you start to see the opposite color begin to appear following a trend.

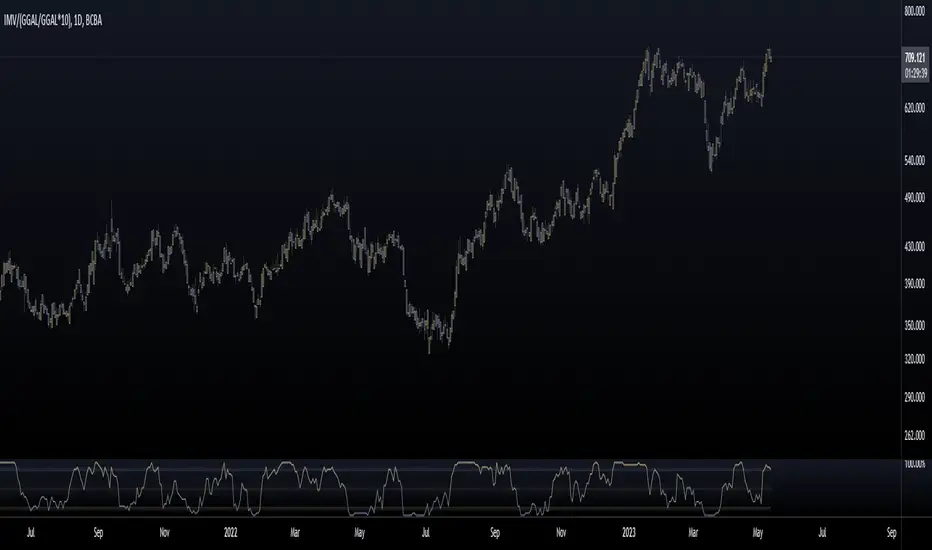
Mervaleta BreadthFellow Merval investors/traders , I'm sharing this script with you that allows you to calculate a breadth indicator using the components of the Merval Index (IMV) from Argentina.
This breadth indicator shows the percentage of stocks that are above a moving average. In this case, you can choose between an EMA or SMA, and you can select the period of the moving average.
The components that make up the index and were used for this script are as follows:
AGRO
ALUA
BBAR
BMA
BYMA
CEPU
COME
CRES
CVH
EDN
GGAL
HARG
LOMA
MIRG
PAMP
SUPV
TECO2
TGNO4
TGSU2
TRAN
TXAR
VALO
YPFD
For all of them, their dollar value in CCL was used, calculated with GGAL.
Enjoy :)
Market Condition DetectorThis script allows to change the background color of the main chart to green or red depending on the following factors:
Based on the QQQ graph whatever ticker you are watching
- Price > EMA20 Da
- Net New Highs > 0
- 10EMA Da > 20 EMA Da
When you are trading Break-Out, EP or other similar trades you will need the market at your back to improve both the winrate and the risk reward ratio.
This is a very useful tool if you struggle with the FOMO biais. It will help you detect the trend at a glance.
Remember that the top best trader are waiting for their trade to work and only after getting some traction, and only then will they take the next trade.
I also proceeded to find a formula that make the indicator be the smoother possible with the less possible amount of noise.
/!\ This indicator is intended for use on daily charts . /!\

Crypto McClellan Oscillator (SLN Fix)This is an adaption of the Mcclellan Oscillator for crypto. Instead of tracking the S&P500 it tracks a selection of cryptos to make sure the indicator follows this sector instead.
Full credit goes to the creator of this indicator: Fadior. It has since been fixed by SLN.
The following description explains the standard McClellan Oscillator. Full credit to Investopedia , my fav source of financial explanations.
The same principles applies to its use in the crypto sector, but please be cautious of the last point, the limitations. Since crypto is more volatile, that could amplify choppy behavior.
This is not financial advice, please be extremely cautious. This indicator is only suitable as a confirmation signal and needs support of other signals to be profitable.
This indicator usually produces the best signals on slightly above daily time frame. I personally like 2 or 3 day, but you have to find the settings suitable for your trading style.
What Is the McClellan Oscillator?
The McClellan Oscillator is a market breadth indicator that is based on the difference between the number of advancing and declining issues on a stock exchange, such as the New York Stock Exchange (NYSE) or NASDAQ.
The indicator is used to show strong shifts in sentiment in the indexes, called breadth thrusts. It also helps in analyzing the strength of an index trend via divergence or confirmation.
The McClellan Oscillator formula can be applied to any stock exchange or group of stocks.
A reading above zero helps confirm a rise in the index, while readings below zero confirm a decline in the index.
When the index is rising but the oscillator is falling, that warns that the index could start declining too. When the index is falling and the oscillator is rising, that indicates the index could start rising soon. This is called divergence.
A significant change, such as moving 100 points or more, from a negative reading to a positive reading is called a breadth thrust. It may indicate a strong reversal from downtrend to uptrend is underway on the stock exchange.
How to Calculate the McClellan Oscillator
To get the calculation started, track Advances - Declines on a stock exchange for 19 and 39 days. Calculate a simple average for these, not exponential moving average (EMA).
Use these simple values as the Prior Day EMA values in the 19- and 39-day EMA formulas.
Calculate the 19- and 39-day EMAs.
Calculate the McClellan Oscillator value.
Now that the value has been calculated, on the next calculation use this value for the Prior Day EMA. Start calculating EMAs for the formula instead of simple averages.
If using the adjusted formula, the steps are the same, except use ANA instead of using Advances - Declines.
What Does the McClellan Oscillator Tell You?
The McClellan Oscillator is an indicator based on market breadth which technical analysts can use in conjunction with other technical tools to determine the overall state of the stock market and assess the strength of its current trend.
Since the indicator is based on all the stocks in an exchange, it is compared to the price movements of indexes that reflect that exchange, or compared to major indexes such as the S&P 500.
Positive and negative values indicate whether more stocks, on average, are advancing or declining. The indicator is positive when the 19-day EMA is above the 39-day EMA, and negative when the 19-day EMA is below the 39-day EMA.
A positive and rising indicator suggests that stocks on the exchange are being accumulated. A negative and falling indicator signals that stocks are being sold. Typically such action confirms the current trend in the index.
Crossovers from positive to negative, or vice versa, may signal the trend has changed in the index or exchange being tracked. When the indicator makes a large move, typically of 100 points or more, from negative to positive territory, that is called a breadth thrust.
It means a large number of stocks moved up after a bearish move. Since the stock market tends to rise over time, this a positive signal and may indicate that a bottom in the index is in and prices are heading higher overall.
When index prices and the indicator are moving in different directions, then the current index trend may lack strength. Bullish divergence occurs when the oscillator is rising while the index is falling. This indicates the index could head higher soon since more stocks are starting to advance.
Bearish divergence is when the index is rising and the indicator is falling. This means fewer stocks are keeping the advance going and prices may start to head lower.
Limitations of Using the McClellan Oscillator
The indicator tends to produce lots of signals. Breadth thrusts, divergence, and crossovers all occur with some frequency, but not all these signals will result in the price/index moving in the expected direction.
The indicator is prone to producing false signals and therefore should be used in conjunction with price action analysis and other technical indicators.
The indicator can also be quite choppy, moving between positive and negative territory rapidly. Such action indicates a choppy market, but this isn't evident until the indicator has made this whipsaw move a few times.
Good luck and a big thanks to Fadior!

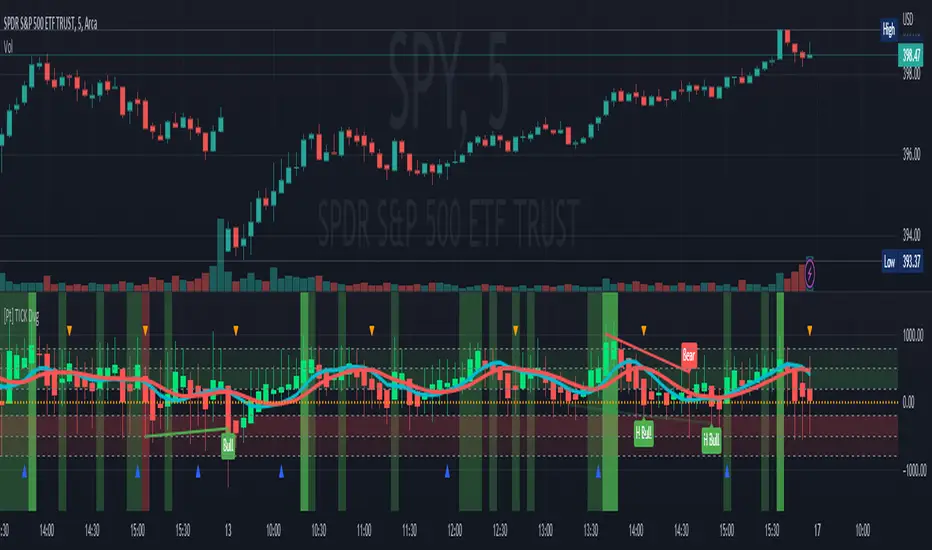
TICK Divergence + Heikin Ashi [Pt]This indicator identifies divergence between NYSE TICK and price, displays TICK in line, bar, or Heikin Ashi format, calculates various types of moving average lines and shows moving average crossovers.
What is TICK
NYSE TICK, also known as the TICK index, is a technical analysis indicator that shows the number of stocks on the New York Stock Exchange (NYSE) that are trading on an uptick or a downtick in a particular period of time. The TICK index is calculated by subtracting the number of stocks trading on a downtick from the number of stocks trading on an uptick. A reading of +1000 on the TICK index, for example, would indicate that there are 1000 more stocks trading on an uptick than on a downtick. The TICK index is often used as a measure of market sentiment, as it can provide insight into whether there is more buying or selling pressure in the market at a given time. A high TICK index reading may suggest that there is strong buying pressure, while a low TICK index reading may indicate that there is more selling pressure in the market.
The TICK index is usually very volatile, so this indicator is best suited for lower timeframes, such as 1 to 5 min charts.
Features
1) Shows bullish, bearish, hidden bullish and hidden bearish divergences
2) Three display modes for TICK data: Line, Bar, Heikin-Ashi
3) Plot various moving average lines and crossovers. Overall background
4) Configurable significant zones. Background colors will change based on closing TICK value.
Crypto Market Breadth [QuantVue]15 top crypto tickers of your choosing. Just input your 15 favorite crypto markets in the settings.
Showing breadth of market as a percentage change to gauge buyers/sellers strength.
You can check this on the last day of the week and compare each daily bar to see if buyers are increasing/decreasing or sellers increasing/decreasing bars.
A reading above +2 is bullish , below -2 is bearish momentum, between +2 and -2 neutral.
Works best on daily charts .
Hope you enjoy!
*this will also work with stock tickers!

4C NYSE Market Breadth RatioThe NYSE Market Breadth Ratio is considered by some to be the “king” of market internals. It lets you know instantly how strong current buying or selling pressure is in the broad market, to eliminate guessing or opinion.
This indicator plots the Market Breadth Ratio values for the NYSE and the NASD exchanges in real time.
It also plots the NYSE Market Breadth Ratio in a histogram plot for visual reference.
The indicator dynamically changes colors between green and red depending on whether breadth is currently positive or negative.
This indicator divides the 'Up-Volume' ("UVOL") by 'Down-Volume' ("DVOL"), for each exchange.
It can be added to any chart, but is incredibly useful when added to other sources of market internals like the NYSE Advancers/Decliners Difference (ticker ADD) or with the NYSE UVOL / DVOL Difference (ticker VOLD ).
Credit goes to author=@auron9000 as the bulk of this code was from their Breadth Ratio Bubbles indicator.
---> The changes made to their indicator include: bug fixes where the values werent properly updating; fixed indicator to be a separate plot (not chart overlay), and added the histogram plot.

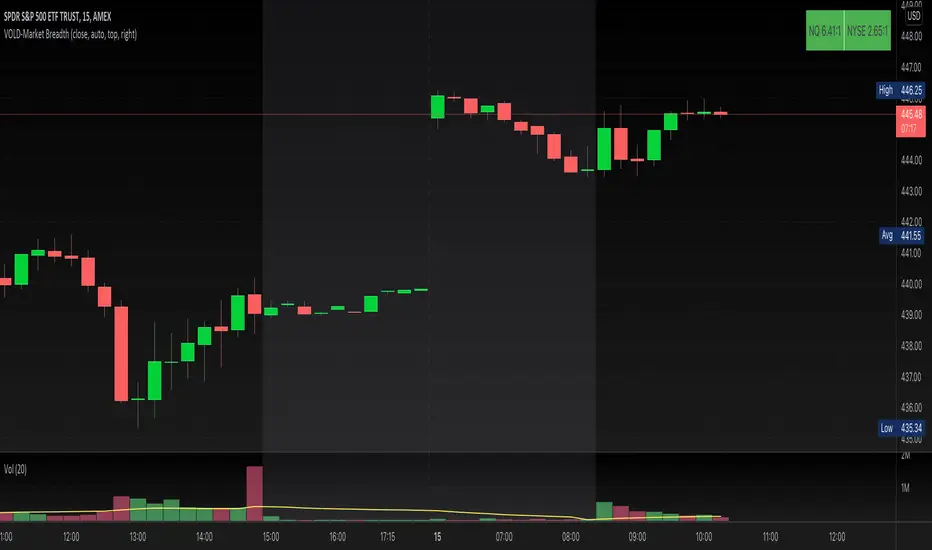
VOLD-MarketBreadth-RatioThis script provides NASDAQ and NYSE Up Volume (volume in rising stocks) and Down Volume (volume in falling stocks) ratio. Up Volume is higher than Down Volume, then you would see green label with ratio e.g 3.5:1. This means Up Volume is 3.5 times higher than Down Volume - Positive Market Breadth. If Down Volume is higher than Up Volume, then you would see red label with ratio e.g -4.5:1. This means Down Volume is 4.5 times higher than Up Volume.
For example, ratio is 1:1, then it is considered Market Breadth is Neutral.
PS: Currently TradingView provides only NASDAQ Composite Market volume data. I have requested them to provide Primary NASDAQ volume data. If they respond with new ticket for primary NQ data, I will update the script and publish the updated version. So if you have got similar table on ToS, you would see minor difference in NQ ratio.
Dollar Weighted Cumulative SPY Sectors VolumeThis plots the combined volume of the subsectors of the SPY using (open+close)/2, both per bar (narrow candles) and cumulative (wide faded candles).
This aims to use dollar volume and weights each sector individually in dollar amounts. NOT with the weighting used in the SPY index. This indicator is NOT equally weighted., it is weighted according to each subsector's own dollar volume.
Green lines means there is more money flowing into the subsectors combined than out. This is a breadth indicator.
Green and red crosses indicate divergence.
Green crosses are shown when the SPY is outperforming this indicator.
Red crosses are shown when this indicator is outperforming the SPY.
Perhaps the best use of this indicator is to stop you from being aggressive when the whole market isn't moving with you.
Enjoy! Feel free to ask any questions.

ROC vs BTCThis is a modification of my Rate of Change Percentile script, used to compare the current ticker (e.g. Altcoins) to BTC.
Essentially we are looking at (Current Ticker ROC percentile) vs (Bitcoin ROC percentile).
In other words, we are using the ROC value of both the current ticker and BTC, and ranking each based on their previous ROC.
We compare the rankings to gauge the relative overperformance or underperformance of the current ticker vs BTC.
The blue line is BTC, the columns are the current ticker.
Green columns above the blue line indicate positive ROC and current ticker has higher ROC ranking than BTC.
Red columns below the blue line indicate negative ROC and current ticker has a higher ROC ranking than BTC.
*** PLEASE LEAVE A LIKE AND FOLLOW IF YOU ENJOY THE SCRIPT ***
Any questions, comments or feedback I'd love to hear from you below!
