Donchian Quest Research// =================================
Trend following strategy.
// =================================
Strategy uses two channels. One channel - for opening trades. Second channel - for closing.
Channel is similar to Donchian channel, but uses Close prices (not High/Low). That helps don't react to wicks of volatile candles (“stop hunting”). In most cases openings occur earlier than in Donchian channel. Closings occur only for real breakout.
// =================================
Strategy waits for beginning of trend - when price breakout of channel. Default length of both channels = 50 candles.
Conditions of trading:
- Open Long: If last Close = max Close for 50 closes.
- Close Long: If last Close = min Close for 50 closes.
- Open Short: If last Close = min Close for 50 closes.
- Close Short: If last Close = max Close for 50 closes.
// =================================
Color of lines:
- black - channel for opening trade.
- red - channel for closing trade.
- yellow - entry price.
- fuchsia - stoploss and breakeven.
- vertical green - go Long.
- vertical red - go Short.
- vertical gray - close in end, don't trade anymore.
// =================================
Order size calculated with ATR and volatility.
You can't trade 1 contract in BTC and 1 contract in XRP - for example. They have different price and volatility, so 1 contract BTC not equal 1 contract XRP.
Script uses universal calculation for every market. It is based on:
- Risk - USD sum you ready to loss in one trade. It calculated as percent of Equity.
- ATR indicator - measurement of volatility.
With default setting your stoploss = 0.5 percent of equity:
- If initial capital is 1000 USD and used parameter "Permit stop" - loss will be 5 USD (0.5 % of equity).
- If your Equity rises to 2000 USD and used parameter "Permit stop"- loss will be 10 USD (0.5 % of Equity).
// =================================
This Risk works only if you enable “Permit stop” parameter in Settings.
If this parameter disabled - strategy works as reversal strategy:
⁃ If close Long - channel border works as stoploss and momentarily go Short.
⁃ If close Short - channel border works as stoploss and momentarily go Long.
Channel borders changed dynamically. So sometime your loss will be greater than ‘Risk %’. Sometime - less than ‘Risk %’.
If this parameter enabled - maximum loss always equal to 'Risk %'. This parameter also include breakeven: if profit % = Risk %, then move stoploss to entry price.
// =================================
Like all trend following strategies - it works only in trend conditions. If no trend - slowly bleeding. There is no special additional indicator to filter trend/notrend. You need to trade every signal of strategy.
Strategy gives many losses:
⁃ 30 % of trades will close with profit.
⁃ 70 % of trades will close with loss.
⁃ But profit from 30% will be much greater than loss from 70 %.
Your task - patiently wait for it and don't use risky setting for position sizing.
// =================================
Recommended timeframe - Daily.
// =================================
Trend can vary in lengths. Selecting length of channels determine which trend you will be hunting:
⁃ 20/10 - from several days to several weeks.
⁃ 20/20 or 50/20 - from several weeks to several months.
⁃ 50/50 or 100/50 or 100/100 - from several months to several years.
// =================================
Inputs (Settings):
- Length: length of channel for trade opening/closing. You can choose 20/10, 20/20, 50/20, 50/50, 100/50, 100/100. Default value: 50/50.
- Permit Long / Permit short: Longs are most profitable for this strategy. You can disable Shorts and enable Longs only. Default value: permit all directions.
- Risk % of Equity: for position sizing used Equity percent. Don't use values greater than 5 % - it's risky. Default value: 0.5%.
⁃ ATR multiplier: this multiplier moves stoploss up or down. Big multiplier = small size of order, small profit, stoploss far from entry, low chance of stoploss. Small multiplier = big size of order, big profit, stop near entry, high chance of stoploss. Default value: 2.
- ATR length: number of candles to calculate ATR indicator. It used for order size and stoploss. Default value: 20.
- Close in end - to close active trade in the end (and don't trade anymore) or leave it open. You can see difference in Strategy Tester. Default value: don’t close.
- Permit stop: use stop or go reversal. Default value: without stop, reversal strategy.
// =================================
Properties (Settings):
- Initial capital - 1000 USD.
- Script don't uses 'Order size' - you need to change 'Risk %' in Inputs instead.
- Script don't uses 'Pyramiding'.
- 'Commission' 0.055 % and 'Slippage' 0 - this parameters are for crypto exchanges with perpetual contracts (for example Bybit). If use on other markets - set it accordingly to your exchange parameters.
// =================================
Big dataset used for chart - 'BITCOIN ALL TIME HISTORY INDEX'. It gives enough trades to understand logic of script. It have several good trends.
// =================================
Breakout

Targets For Many Indicators [LuxAlgo]The Targets For Many Indicators is a useful utility tool able to display targets for many built-in indicators as well as external indicators. Targets can be set for specific user-set conditions between two series of values, with the script being able to display targets for two different user-set conditions.
Alerts are included for the occurrence of a new target as well as for reached targets.
🔶 USAGE
Targets can help users determine the price limit where the price might start deviating from an indication given by one or multiple indicators. In the context of trading, targets can help secure profits/reduce losses of a trade, as such this tool can be useful to evaluate/determine user take profits/stop losses.
Due to these essentially being horizontal levels, they can also serve as potential support/resistances, with breakouts potentially confirming new trends.
In the above example, we set targets 3 ATR's away from the closing price when the price crosses over the script built-in SuperTrend indicator using ATR period 10 and factor 3. Using "Long Position Target" allows setting a target above the price, disabling this setting will place targets below the price.
Users might be interested in obtaining new targets once one is reached, this can be done by enabling "New Target When Reached" in the target logic setting section, resulting in more frequent targets.
Lastly, users can restrict new target creation until current ones are reached. This can result in fewer and longer-term targets, with a higher reach rate.
🔹 Dashboard
A dashboard is displayed on the top right of the chart, displaying the amount, reach rate of targets 1/2, and total amount.
This dashboard can be useful to evaluate the selected target distances relative to the selected conditions, with a higher reach rate suggesting the distance of the targets from the price allows them to be reached.
🔶 DETAILS
🔹 Indicators
Besides 'External' sources, each source can be set at 1 of the following Build-In Indicators :
ACCDIST : Accumulation/distribution index
ATR : Average True Range
BB (Middle, Upper or Lower): Bollinger Bands
CCI : Commodity Channel Index
CMO : Chande Momentum Oscillator
COG : Center Of Gravity
DC (High, Mid or Low): Donchian Channels
DEMA : Double Exponential Moving Average
EMA : Exponentially weighted Moving Average
HMA : Hull Moving Average
III : Intraday Intensity Index
KC (Middle, Upper or Lower): Keltner Channels
LINREG : Linear regression curve
MACD (macd, signal or histogram): Moving Average Convergence/Divergence
MEDIAN : median of the series
MFI : Money Flow Index
MODE : the mode of the series
MOM : Momentum
NVI : Negative Volume Index
OBV : On Balance Volume
PVI : Positive Volume Index
PVT : Price-Volume Trend
RMA : Relative Moving Average
ROC : Rate Of Change
RSI : Relative Strength Index
SMA : Simple Moving Average
STOCH : Stochastic
Supertrend
TEMA : Triple EMA or Triple Exponential Moving Average
VWAP : Volume Weighted Average Price
VWMA : Volume-Weighted Moving Average
WAD : Williams Accumulation/Distribution
WMA : Weighted Moving Average
WVAD : Williams Variable Accumulation/Distribution
%R : Williams %R
Each indicator is provided with a link to the Reference Manual or to the Build-In Indicators page.
The latter contains more information about each indicator.
Note that when "Show Source Values" is enabled, only values that can be logically found around the price will be shown. For example, Supertrend , SMA , EMA , BB , ... will be made visible. Values like RSI , OBV , %R , ... will not be visible since they will deviate too much from the price.
🔹 Interaction with settings
This publication contains input fields, where you can enter the necessary inputs per indicator.
Some indicators need only 1 value, others 2 or 3.
When several input values are needed, you need to separate them with a comma.
You can use 0 to 4 spaces between without a problem. Even an extra comma doesn't give issues.
The red colored help text will guide you further along (Only when Target is enabled)
Some examples that work without issues:
Some examples that work with issues:
As mentioned, the errors won't be visible when the concerning target is disabled
🔶 SETTINGS
Show Target Labels: Display target labels on the chart.
Candle Coloring: Apply candle coloring based on the most recent active target.
Target 1 and Target 2 use the same settings below:
Enable Target: Display the targets on the chart.
Long Position Target: Display targets above the price a user selected condition is true. If disabled will display the targets below the price.
New Target Condition: Conditional operator used to compare "Source A" and "Source B", options include CrossOver, CrossUnder, Cross, and Equal.
🔹 Sources
Source A: Source A input series, can be an indicator or external source.
External: External source if 'External" is selected in "Source A".
Settings: Settings of the selected indicator in "Source A", entered settings of indicators requiring multiple ones must be comma separated, for example, "10, 3".
Source B: Source B input series, can be an indicator or external source.
External: External source if 'External" is selected in "Source B".
Settings: Settings of the selected indicator in "Source B", entered settings of indicators requiring multiple ones must be comma separated, for example, "10, 3".
Source B Value: User-defined numerical value if "value" is selected in "Source B".
Show Source Values: Display "Source A" and "Source B" on the chart.
🔹 Logic
Wait Until Reached: When enabled will not create a new target until an existing one is reached.
New Target When Reached: Will create a new target when an existing one is reached.
Evaluate Wicks: Will use high/low prices to determine if a target is reached. Unselecting this setting will use the closing price.
Target Distance From Price: Controls the distance of a target from the price. Can be determined in currencies/points, percentages, ATR multiples, ticks, or using multiple of external values.
External Distance Value: External distance value when "External Value" is selected in "Target Distance From Price".

Targets For Overlay Indicators [LuxAlgo]The Targets For Overlay Indicators is a useful utility tool able to display targets during crossings made between the price and external indicators on the user chart. Users can display a series of two targets, one for crossover events and another one for crossunder event.
Alerts are included for the occurrence of a new target as well as for reached targets.
🔶 USAGE
In order for targets to be displayed users need to select an appropriate input source from the "Source" drop-down input setting. In the example above we apply the indicator to a volatility stop.
This can also easily be done by adding the "Targets For Overlay Indicators" script on the VStop indicator directly.
Targets can help users determine the price limit where the price might start deviating from an indication given by one or multiple indicators. In the context of trading, targets can help secure profits/reduce losses of a trade, as such this tool can be useful to evaluate/determine user take profits/stop losses.
Due to these essentially being horizontal levels, they can also serve as potential support/resistances, with breakouts potentially confirming new trends.
Users might be interested in obtaining new targets once one is reached, this can be done by enabling "New Target When Reached" in the target logic setting section, resulting in more frequent targets.
Lastly, users can restrict new target creation until current ones are reached. This can result in fewer and longer-term targets, with a higher reach rate.
🔹 Examples
The indicator can be applied to many overlay indicators that naturally produce crosses with the price, such as moving average, trailing stops, bands...etc.
Users can use trailing stops such as the SuperTrend or VStop to more easily create clean targets. Do note that certain SuperTrend scripts separate the upper and lower extremities of the SuperTrend into two different plot, which cannot be used with this tool, you may use the provided SuperTrend script below to have a compatible version with our tool:
//@version=5
indicator("SuperTrend", overlay = true)
factor = input.float(3, 'Factor', minval = 0)
atrLen = input.int(10, 'ATR Length', minval = 1)
= ta.supertrend(factor, atrLen)
plot(spt, 'SuperTrend', dir != dir ? na : dir < 0 ? #089981 : #f23645, 2)
plot(spt, 'Circles', dir > dir ? #f23645 : dir < dir ? #089981 : na, 3, plot.style_circles)
Using moving averages can produce more targets than other overlay indicators.
Users can apply the tool twice when using bands or any overlay indicator returning two outputs, using crossover targets for obtaining targets using the upper band as source and crossunder targets for targets using the lower band. We can also use the Trendlines with breaks indicator as example:
🔹 Dashboard
A dashboard is displayed on the top right of the chart, displaying the amount, reach rate of targets 1/2, and total amount.
This dashboard can be useful to evaluate the selected target distances relative to the selected conditions, with a higher reach rate suggesting the distance of the targets from the price allows them to be reached.
🔶 SETTINGS
Source: Indicator source used to create targets. Targets are created when the closing price crosses the specified source.
Show Target Labels: Display target labels on the chart.
Candle Coloring: Apply candle coloring based on the most recent active target.
🔹 Target
Crossover and Crossunder targets use the same settings below:
Show Target: Determines if the target is displayed or not.
Above Price Target: If selected, will create targets above the closing price.
Wait Until Reached: When enabled will not create a new target until an existing one is reached.
New Target When Reached: Will create a new target when an existing one is reached.
Evaluate Wicks: Will use high/low prices to determine if a target is reached. Unselecting this setting will use the closing price.
Target Distance From Price: Controls the distance of a target from the price. Can be determined in currencies/points, percentages, ATR multiples, or ticks.

London BreakOut ClassicHey there, this is my first time publishing a strategy. The strategy is based on the London Breakout Idea, an incredibly popular concept with abundant information available online.
Let me summarize the London Breakout Strategy in a nutshell: It involves identifying key price levels based on the Tokyo Session before the London Session starts. Typically, these key levels are the high and low of the previous Tokyo session. If a breakout occurs during the London session, you simply follow the trend.
The purpose of this code
After conducting my research, I came across numerous posts, videos, and articles discussing the London Breakout Strategy. I aimed to automatically test it myself to verify whether the claims made by these so-called trading gurus are accurate or not. Consequently, I wrote this script to gain an understanding of how this strategy would perform if I were to follow its basic settings blindly.
Explanation of drawings on the chart:
Red or Green Box: A box is drawn on our chart displaying the exact range of the Tokyo trading session. This box is colored red if the trend during the session was downward and green if it was upward. The box is always drawn between the high and the low between 0:00 AM and 7:00 AM UTC. You can change the settings via the Inputs "Session time Tokyo" & "Session time zone".
Green Background: The green background represents the London trading session. My code allows us to make entries only during this time. If we haven't entered a trade, any pending orders are canceled. I've also programmed a timeout at 11 pm to ensure every trade is closed before the new Tokyo session begins.
Red Line: The red line is automatically placed in the middle of our previous Tokyo range. This line acts as our stop loss. If we cross this line after entering a trade but before reaching our take profit, we'll be stopped out.
When do we enter a trade?
We wait for a candle body to close outside of the previous Tokyo range to enter a trade with the opening of the next candle. We only enter one trade per day.
Where do we put our Take Profit?
The code calculates the exact distance between our entry point and the stop loss. We are trading a risk-reward ratio of 1:1 by default, meaning our take profit is always the same number of pips away from our entry as the stop loss. The Stop Loss is always defined by the red line on the chart. You can change the risk-reward ratio via the inputs setting "CRV", to see how the result changes.
What is the purpose of this script?
I wanted to backtest the London breakout strategy to see how it actually works. Therefore, I wrote this code so that everybody can test it for themselves. You can change the settings and see how the result changes. Typically, you should test this strategy on forex markets and on either 1Min, 5 Min, or 15 Min timeframe.
What are the results?
Over the last 3-6 months (over 100 trades), trading the strategy with my default settings hasn't proven to be very successful. Consequently, I do not recommend trading this strategy blindly. The purpose of this code is to provide you with a foundation for the London Breakout Strategy, allowing you to modify and enhance it according to your preferences. If you're contemplating whether to give it a try, you can assess the results from the past months by using this code as a starting point.

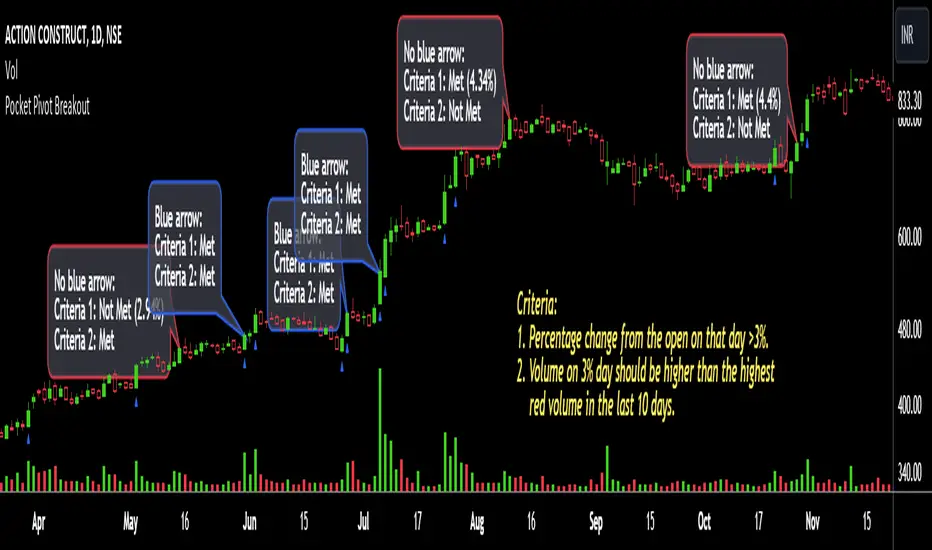
Pocket Pivot BreakoutPocket Pivot Breakout Indicator
The pocket pivot breakout indicator will show a blue arrow under the candle if both the following conditions are met:
1. The percentage change of the candle on that day from open is greater than 3%.
2. The volume on the day of 3% candle is higher than the highest red volume in the past 10 days.
The second condition is based on the 'Pocket Pivot' concept developed by Gil Morales and Chris Kacher.
If only one of the conditions is met, while the other is not, there will be no arrow.
How to use the Pocket Pivot Breakout indicator?
1. If the stock is breaking out of a proper base like (cup & handle, Darvas box etc.), you can use the blue arrow as an indicator to make your initial buy.
2. If you already own a stock, the blue arrow indicator can be used for pyramiding, following a continuation breakout from a proper base.
3. Avoid making a new entry or continuation entry if the stock is too extended from 10ma.
Gap-up > 0.5% Indicator
Gap-up Indicator displays a blue colored candle when a stock gaps up by more than 0.5% compared to previous day's close.
It is turned off by default. To activate it, check the box next to Gap-up > 0.5% in the indicator options.
How to use the Gap-up Indicator?
1. When a stock gaps up, it usually indicates strength, especially if on the day of the gap-up, the stock closes strongly.
2. This indicator should not be used in isolation but with a proper base breakout from a tight consolidation.
3. If a stock is already extended from 10ma, avoid taking any new or continuation entries.
Precautions
1. Avoid buying longs when the general market conditions are not favorable.
2. Avoid buying stocks below 200ma.
3. Avoid making a new entry or pyramid entry if a stock is too extended from 10ma.
Important Points
1. Always choose fundamentally strong stocks showing strong growth in earnings/margins/sales.
2. Buy these fundamentally strong stocks when they are breaking out of proper bases.
3. To learn more about pocket pivots and buyable gap-ups, read the book, Trade Like an O'Neil Disciple (by Gil Morales & Chris Kacher).
Cheers
Simranjit
Breakout Detector (Previous MTF High Low Levels) [LuxAlgo]The Breakout Detector (Previous MTF High Low Levels) indicator highlights breakouts of previous high/low levels from a higher timeframe.
The indicator is able to: display take-profit/stop-loss levels based on a user selected Win/Loss ratio, detect false breakouts, and display a dashboard with various useful statistics.
Do note that previous high/low levels are subject to backpainting, that is they are drawn retrospectively in their corresponding location. Other elements in the script are not subject to backpainting.
🔶 USAGE
Breakouts occur when the price closes above a previous Higher Timeframe (HTF) High or below a previous HTF Low.
On the advent of a breakout, the closing price acts as an entry level at which a Take Profit (TP) and Stop Loss (SL) are placed. When a TP or SL level is reached, the SL/TP box border is highlighted.
When there is a breakout in the opposite direction of an active breakout, previous breakout levels stop being updated. Not reaching an SL/TP level will result in a partial loss/win,
which will result in the box being highlighted with a dotted border (default). This can also be set as a dashed or solid border.
Detection of False Breakouts (default on) can be helpful to avoid false positives, these can also be indicative of potential trend reversals.
This indicator contains visualization when a new HTF interval begins (thick vertical grey line) and a dashboard for reviewing the breakout results (both defaults enabled; and can be disabled).
As seen in the example above, the active, open breakout is colored green/red.
You can enable the setting ' Cancel TP/SL at the end of HTF ', which will stop updating previous TP/SL levels on the occurrence of a new HTF interval.
🔶 DETAILS
🔹 Principles
Every time a new timeframe period starts, the previous high and low are detected of the higher timeframe. On that bar only there won't be a breakout detection.
A breakout is confirmed when the close price breaks the previous HTF high/low
A breakout in the same direction as the active breakout is ignored.
A breakout in the opposite direction stops previous breakout levels from being updated.
Take Profit/Stop Loss, partially or not, will be highlighted in an easily interpretable manner.
🔹 Set Higher Timeframe
There are 2 options for choosing a higher timeframe:
• Choose a specific higher timeframe (in this example, Weekly higher TF on a 4h chart)
• Choose a multiple of the current timeframe (in this example, 75 minutes TF on a 15 min chart - 15 x 5)
Do mind, that when using this option, non-standard TFs can give less desired timeframe changes.
🔹 Setting Win/Loss Levels
The Stop Loss (SL) / Take Profit (TP) setting has 2 options:
W%:L% : A fixed percentage is chosen, for TP and SL.
W:L : In this case L (Loss-part) is set through Loss Settings , W (Win-part) is calculated by multiplying L , for example W : L = 2 : 1, W will be twice as large as the L .
🔹 Loss Settings
The last drawing at the right is still active (colored green/red)
The Loss part can be:
A multiple of the Average True Range (ATR) of the last 200 bars.
A multiple of the Range Cumulative Mean (RCM).
The Latest Swing (with Length setting)
Range Cumulative Mean is the sum of the Candle Range (high - low) divided by its bar index.
🔹 False Breakouts
A False Breakout is confirmed when the price of the bar immediately after the breakout bar returns above/below the breakout level.
🔹 Dashboard
🔶 ALERTS
This publication provides several alerts
Bullish/Bearish Breakout: A new Breakout.
Bullish/Bearish False Breakout: False Breakout detected, 1 bar after the Breakout.
Bullish/Bearish TP: When the TP/profit level has been reached.
Bullish/Bearish Fail: When the SL/stop-loss level has been reached.
Note that when a new Breakout causes the previous Breakout to stop being updated, only an alert is provided of the new Breakout.
🔶 SETTINGS
🔹 Set Higher Timeframe
Option : HTF/Mult
HTF : When HTF is chosen as Option , set the Higher Timeframe (higher than current TF)
Mult : When Mult is chosen as Option , set the multiple of current TF (for example 3, curr. TF 15min -> 45min)
🔹 Set Win/Loss Level
SL/TP : W:L or W%:L%: Set the Win/Loss Ratio (Take Profit/Stop Loss)
• W : L : Set the Ratio of Win (TP) against Loss (SL) . The L level is set at Loss Settings
• W% : L% : Set a fixed percentage of breakout price as SL/TP
🔹 Loss Settings
When W : L is chosen as SL/TP Option, this sets the Loss part (L)
Base :
• RCM : Range Cumulative Mean
• ATR : Average True Range of last 200 bars
• Last Swing : Last Swing Low when bullish breakout, last Swing High when bearish breakout
Multiple : x times RCM/ATR
Swing Length : Sets the 'left' period ('right' period is always 1)
Colours : colour of TP/SL box and border
Borders : Style border when breakout levels stop being updated, but TP/SL is not reached. (Default dotted dot , other option is dashed dsh or solid sol )
🔹 Extra
Show Timeframe Change : Show a grey vertical line when a new Higher Timeframe interval begins
Detect False Outbreak
Cancel TP/SL at end of HTF
🔹 Show Dashboard
Location: Location of the dashboard (Top Right or Bottom Right/Left)
Size: Text size (Tiny, Small, Normal)
See USAGE/DETAILS for more information

TouchedLibrary "Touched"
Breakout(zone, lookback)
Tells if the zone has been broken on the current bar.
Parameters:
zone (Zone) : The definitiin of the zone.
lookback (int) : How many bars to look back.
Returns: a Touch object that tells if the zone has been broken up or down.
FalseBreakout(zone, lookback)
Tells if the zone has a false breakout on the current bar.
Parameters:
zone (Zone) : The definitiin of the zone.
lookback (int) : How many bars to look back.
Returns: a Touch object that tells if the zone has had a false breakout up or down.
Retest(zone, lookback)
Tells if the zone has been retested on the current bar.
Parameters:
zone (Zone) : The definitiin of the zone.
lookback (int) : How many bars to look back.
Returns: a Touch object that tells if the zone has been retested up or down.
Zone
Fields:
High (series__float)
Low (series__float)
BaseTime (series__integer)
Touch
Fields:
Up (series__bool)
Down (series__bool)

Market Structure (Breakers) [LuxAlgo]The Market Structure (Breakers) indicator aims to detect "Breaker Market Structures", an original concept inspired by breaker blocks, and extend on the original concept of market structures by extending existing MS levels, providing supports/resistances as a result.
Various graphical elements are included that highlight the interactions between price and Breaker structures.
🔶 USAGE
Breaker structures occur when a market structure is confirmed (price breaking a previous swing level). The broken swing point is extended by a dotted line which can be used as potential support or resistance.
After a market structure, the price can eventually reverse and break one or multiple breaker structures at the same time, allowing for the detection of new trends in the price.
A market structure closer to the top/bottom of a trend can return Breaker structures breakouts more indicative of potential reversals.
Breakers MS breakouts can also be useful as exits for entries done using market market structures.
The script additionally highlights support/resistance events by highlighting candle borders, with a border using a green color indicating support events while a red color is indicative of a resistance event.
🔹 Breaker Structure Lifespan
The "lifespan" of Breaker structures, that is the amount of time the script will extend/evaluate them is determined by various user settings.
The Maximum Breaks setting determines the maximum amount of breaks a breaker structure can withstand before it is broken.
For example, a maximum amount of breaks of 3 for a bearish breaker structure would require the price to cross under that precise breaker structure level three times. Using higher values of this setting will also highlight more Breakers MS.
The Breaker Maximum Duration setting on the other hand determines how many bars a breaker structure can be evaluated without being broken. If a breaker structure is not broken after this amount of bars then it will stop being evaluated and will be removed.
🔶 SETTINGS
Swings Period: Period used for the swing detection, with higher values returning longer term markter structures.
Maximum Breaks: Amount of break required for a breaker block to be considered broken.
Breaker Maximum Duration: Maximum duration of a breaker block (in bars).

Ranges With Targets [ChartPrime]The Ranges With Targets indicator is a tool designed to assist traders in identifying potential trading opportunities on a chart derived from breakout trading. It dynamically outlines ranges with boxes in real-time, providing a visual representation of price movements. When a breakout occurs from a range, the indicator will begin coloring the candles. A green candle signals a long breakout, suggesting a potential upward movement, while a red candle indicates a short breakout, suggesting a potential downward movement. Grey candles indicate periods with no active trade. Ranges are derived from daily changes in price action.
This indicator builds upon the common breakout theory in trading whereby when price breaks out of a range; it may indicate continuation in a trend.
Additionally, users have the ability to customize their risk-reward settings through a multiplier referred to as the Target input. This allows traders to set their Take Profit (TP) and Stop Loss (SL) levels according to their specific risk tolerance and trading strategy.
Furthermore, the indicator offers an optional stop loss setting that can automatically exit losing trades, providing an additional layer of risk management for users who choose to utilize this feature.
A dashboard is provided in the top right showing the statistics and performance of the indicator; winning trades; losing trades, gross profit and loss and PNL. This can be useful when analyzing the success of breakout trading on a particular asset or timeframe.

Trend Line XrossTrend Line Xross (TLX) Uses User Input Points to draw trendlines and displays the exact intersection point of those trendlines.
This is the public indicator of the practical application for this intersection method included in my entry for Pinefest #1.
To determine the exact intersection point I am using the y-intercept method as seen below.
The code is notated for more information on the technical workings.
One difference to note between this version and the pinefest version is that I had to change the line drawings to use bar_index values so that I can use line.get_price() to grab the current value of the line to make alerts from.
Additionally, there are alerts built-in to this version for every type of cross on all of the visible lines.
Enjoy!

Session Breakout/Sweep with alertsThis indicator is based on popular London breakout strategy. but as I noticed that it don't work good with breakouts so I made it to be used as reversal entries as well. By default the timing is set for asian session but you can change it according to your need.
Use as breakout
Use as liquidity sweep
Note:
On some pairs the timing changes automatically (I don't know why), if you face this issue , go to settings and set the timing accordingly and save it as templet so that you don't have to change it every time you load the chart with timing issue.
I hope you guys find it useful. Do share your though and feedback in comments.

Trend Lines [LuxAlgo]Our new "Trend Lines" indicator detects and highlights relevant trendlines on the user chart while keeping it free of as much clutter as possible.
The indicator is thought for real-time usage and includes several filters as well as the ability to estimate trendline angles.
🔶 USAGE
Trendlines can act as support/resistance, with a higher number of tests indicating a more significant support/resistance role.
A broken TrendLine can be indicative of a potential trend reversal. The script highlights breaks with a label.
Users can additionally filter trendlines, only showing trendlines whose angles fall within a user set range:
This allows for the removal of potential clutter from the chart but also helps keep steeper or more horizontal trendlines.
🔶 DETAILS
When a swing (pivot point) is found, a Trendline is drawn when certain conditions are fulfilled.
An essential condition is that a Bearish Trendline (red) always occurs on a lower high, while a Bullish Trendline (blue) occurs on a higher low.
Our implementation will first show an initial dotted-styled TrendLine on confirmation, after which a solid-styled secondary TrendLine will develop. The latter will be used for the real-time detection of breaks at that line:
Furthermore, the script allows you to add more conditions:
🔹 Length (Swings)
A swing develops when a high/low is the highest/lowest against x highs/lows on the left AND right of that bar. x can be set by "Length" in settings.
The following images clarify this. The script confirms a swing where the yellow flag is shown; the high (here visualized with a purple label) is the highest point against x bars left and right of that point.
At that moment, this swing is checked against the previous swing. If all conditions are fulfilled, an initial TrendLine is drawn on confirmation.
After that point, a secondary thicker solid line is seen which keeps progressing bar after bar, until:
• a new TrendLine is formed
• the TrendLine is broken
🔹 Breaks between Swings
Once there is confirmation that a TrendLine can be drawn, the script allows you to filter for breakthroughs on that line. This can be set with "Check breaks between"
Disabled : the initial TrendLine is allowed to be pierced:
Check breaks between point A - point B : no breaks are allowed between both Swing points:
Point A - Current bar : no breaks are allowed between the first Swing point and the point of confirmation ('current' bar):
🔹 TrendLine breaks
As mentioned, the secondary TrendLine (solid line) progresses bar after bar until a new TrendLine is formed or the TrendLine is broken. When a TrendLine is broken, the TrendLine stops progressing, but if there isn't a new TrendLine and price return back, the TrendLine will re-appear, potentially giving several signals when the TrendLine is broken again.
Minimal bars allow you to regulate the amount of signals when the TrendLine is broken.
-> The secondary TrendLine must be uninterrupted for at least x bars before a potential break can be considered.
The following example shows 1 signal against 3 by adjusting this setting from 2 to 5:
🔹 Angles
Angles should normally be calculated when the units of the X and Y axis are the same. However, on our charts, the unit of the X-axis is bar_index (bars), and on the Y-axis the unit is price (¥, €, £, $,...).
It is not easy to normalize and create reasonably valid angles. Often certain angle calculations can differ through price changes or volatility.
Our calculate_slope() function tries to make corresponding angles through all bars.
We do this by calculating the difference between the highest/lowest price values in a certain bar range. The bar range is our X-axis, and the price difference is our Y-axis.
Zooming in/out will not change the amount of bars or the price. Since it does change our view on the chart, and thereby how we see the angles, we have included a setting where you can personalize the ratio between X and Y-axis (Angles -> Ratio X-Y axis).
Settings: Angles - Ratio X-Y axis:
🔶 SETTINGS
🔹 Swings
Length: Lookback period for the detection of swing points.
🔹 Trendline validation
Check breaks between :
Disabled : the initial TrendLine is allowed to be pierced
Check breaks between point A - point B : no breaks are allowed between both Swing points
Point A - Current bar : no breaks are allowed between the first Swing point and the point of confirmation ('current' bar)
Source (breaks) : Source which invalidates TrendLine, default: close
🔹 TrendLine breaks
Minimal bars : The secondary TrendLine must be uninterrupted for at least x bars before a potential break can be considered.
🔹 Angles
Show : Toggle labels.
Ratio X-Y axis : Every user has his preferences regarding zoom, chart layout,...
If the shown angles are not according to your expectations, you can adjust this number.
Only TrendLine between : Only allow TrendLines between the minimum and maximum degrees. Set only the minimal and maximum values above 0.

RSI Box Strategy (pseudo- Grid Bot)This is a strategy intended primarily for algorithmic traders. It's a pseudo-grid bot that uses a dynamic, volume-weighted grid that only updates when the RSI meets certain conditions. It's also a breakout strategy, whereas normal grid bots are not (typical grid bots sell when a higher grid is reached, whereas this strategy sells when a lower grid is breached under specific conditions). This strategy also sells 100% of pyramiding orders on close.
In a nutshell, the strategy updates its grid to the volume-weighted highest/lowest values of your given source ("src" in the settings) each time that there is a RSI crossunder/crossover. From this range it produces an evenly-spaced grid of five lines, and uses the current source to determine which grid line is closest to the source. Then, if the source crosses over the line directly above the current line, it enters a buy order. If the source crosses under the line directly below the current line, it enters a sell order.
You can configure shorts, source, RSI length, and overbought/oversold levels in the settings.
For the strategy results below: fees are at 0.1% per trade, with order size 1% of equity and a max pyramiding value of 33. For a greater R/R profile, you can increase the order size, which will increase drawdown but potentially yield better results.

Range Detector [LuxAlgo]The Range Detector indicator aims to detect and highlight intervals where prices are ranging. The extremities of the ranges are highlighted in real-time, with breakouts being indicated by the color changes of the extremities.
🔶 USAGE
Ranging prices are defined by a period of stationarity, that is where prices move within a specific range.
Detecting ranging markets is a common task performed manually by traders. Price breaking one of the extremities of a range can be indicative of a new trend, with an uptrend if price breaks the upper range extremity, and a downtrend if price breaks the lower range extremity.
Ranges are highlighted as zones and are set retrospectively, that is the starting point of a range is offset in the past. The exact moment a range is detected is highlighted by a gray background color. The average between the maximum/minimum of a zone is also highlighted as a dotted line and is also set retrospectively.
The range extremities are set in real-time, blue extremities indicate the range extremities were not broken, green extremities indicate that price broke the upper range extremity, while red extremities indicate price broke the lower range extremity.
Extremities are extended until a new range is detected, allowing past ranges extremities can be used as future support/resistances.
🔶 DETAILS
The detection algorithm used to detect ranges tests if all the prices within a user-set window are all within two extremities. These extremities are determined by the mean of the detection window plus/minus an ATR value.
When a new range is detected, the script checks if this new range overlaps with a previously detected range, if this is the case, both ranges are merged into one; updating the extremities of the previous range.
This can be observed with the real-time extremities changing within a highlighted zone.
🔶 SETTINGS
Minimum Range Length: Minimum amount of bars needed to detect a range.
Range Width: Multiplicative factor for the ATR used to detect new ranges. Lower values detect ranges with a lower width. Using higher values might return false positives.
ATR Length: ATR length used to determine the range width.

Range Breakout Signals (Intrabar) [LuxAlgo]The Range Breakout Signals (Intrabar) is a novel indicator highlighting trending/ranging intrabar candles and providing signals when the price breaks the extremities of a ranging intrabar candles.
🔶 USAGE
The indicator highlights candles with trending intrabar prices, with uptrending candles being highlighted in green, and down-trending candles being highlighted in red.
This highlighting is affected by the selected intrabar timeframe, with a lower timeframe returning a more precise estimation of a candle trending/ranging state.
When a candle intrabar prices are ranging the body of the candle is hidden from the chart, and one upper & lower extremities are displayed, the upper extremity is equal to the candle high and the lower extremity to the candle low. Price breaking one of these extremities generates a signal.
The indicator comes with two modes, "Trend Following" and "Reversal", these modes determine the extremities that need to be broken in order to return a signal. The "Trend Following" mode as its name suggests will provide trend-following signals, while "Reversal" will aim at providing early signals suggesting a potential reversal.
🔶 DETAILS
To determine if intrabar prices are trending or ranging we calculate the r-squared of the intrabar data, if the r-squared is above 0.5 it would suggest that lower time frame prices are trending, else ranging.
This approach allows almost obtaining a "settings" free indicator, which is uncommon. The intrabar timeframe setting only controls the intrabar precision, with a timeframe significantly lower than the chart timeframe returning more intrabar data as a result, this however might not necessarily affect the displayed information by the indicator.
🔶 SETTINGS
Intrabar Timeframe: Timeframe used to retrieve the intrabar data within a chart candle. Must be lower than the user chart timeframe.
Auto: Select the intrabar timeframe automatically. This setting is more adapted to intraday charts.
Mode: Signal generation mode.
Filter Out Successive Signals: Allows removing successive signals of the same type, returning a more easily readable chart.

The Opening Range / First Bar By Market Mindset - Zero To EndlesThe script shows the opening range of the instrument based on different resolutions and timeframes.
Inputs :
1. Resolution
It decides the calculation frequency of the script.
In Auto resolution, Standard values have been used.
2. Timeframe
It decides the timeframe for the OHLC values.
By default, it will use the chart timeframe and so chart OHLC values.
3. Lookback
It decides the no. of ranges shown on the chart.
Middle Line can be hidden from the settings.
The script can be used for any instrument and on any timeframe.
If price is above the opening range or the middle line, a trader should look for long opportunities.
If price is below the opening range or the middle line, a trader should look for short opportunities.
A sideways or choppy move is exoected if Middle line is crossed again and again.
For trading, wait for atleast 1st bar to close. and let the opening range build up first.
Happy Trading

Buy/Sell BoxThis indicator tries to identify the points where the price exceeds or falls below a rectangle based on the opening and closing prices of the previous period, the creation of the boxes occurs when a doji is detected therefore it will calculate the coordinates of the rectangle that will be drawn around it, therefore the indicator offers buy or sell signals based on this logic. Specifically, the buy signal is generated if the closing price is above the top of the rectangle and satisfies some previous price conditions while the sell signal is generated if the closing price is below the bottom of the rectangle and satisfies some conditions of previous prices within a further threshold based on the Ema 150.
Lines are then drawn on the graph to visually display the extreme price levels, which can be useful for any confirmation of buy and sell signals, Stop Loss and Take Profit, Trend Filter (to visually understand if the trend is bullish or bearish)
A potentially effective trading strategy could involve identifying buy and sell signals near the extreme price level lines drawn by the indicator. This approach can be used to try to improve the accuracy of your trading signals and make more informed decisions. For example:
When you receive a buy or sell signal based on the dojis and rectangles generated by the indicator, check whether the price is also near one of the extreme price level lines. If you are receiving a buy signal and notice that the current price is near a low of the lower level line, this may further confirm the buying opportunity, as the price is near a significant resistance level. On the contrary, if the sell signal was close to a maximum price level it could confirm an excellent short entry.
It is also possible to use the boxes as reference points to set the stop loss and take profit levels. If you are entering a buy position, you might consider setting your stop loss just below an upper line of the last box. Additionally, you may want to set your take profit near a higher price level if you are looking to maximize profits. This will help manage risks and protect your capital.

TrendCylinder (Expo)█ Overview
The TrendCylinder is a dynamic trading indicator designed to capture trends and volatility in an asset's price. It provides a visualization of the current trend direction and upper and lower bands that adapt to volatility changes. By using this indicator, traders can identify potential breakouts or support and resistance levels. While also gauging the volatility to generate trading ranges. The indicator is a comprehensive tool for traders navigating various market conditions by providing a sophisticated blend of trend-following and volatility-based metrics.
█ How It Works
Trend Line: The trend line is constructed using the closing prices with the influence of volatility metrics. The trend line reacts to sudden price changes based on the trend factor and step settings.
Upper & Lower Bands: These bands are not static; they are dynamically adjusted with the calculated standard deviation and Average True Range (ATR) metrics to offer a more flexible, real-world representation of potential price movements, offering an idea of the market's likely trading range.
█ How to Use
Identifying Trends
The trend line can be used to identify the current market trend. If the price is above the trend line, it indicates a bullish trend. Conversely, if the price is below the trend line, it indicates a bearish trend.
Dynamic Support and Resistance
The upper and lower bands (including the trend line) dynamically change with market volatility, acting as moving targets of support and resistance. This helps set up stop-loss or take-profit levels with a higher degree of accuracy.
Breakout vs. Reversion Strategies
Price movements beyond the bands could signify strong trends, making it ideal for breakout strategies.
Fakeouts
If the price touches one of the bands and reverses direction, it could be a fakeout. Traders may choose to trade against the breakout in such scenarios.
█ Settings
Volatility Period: Defines the look-back period for calculating volatility. Higher values adapt the bands more slowly, whereas lower values adapt them more quickly.
Trend Factor: Adjusts the sensitivity of the trend line. Higher values produce a smoother line, while lower values make it more reactive to price changes.
Trend Step: Controls the pace at which the trend line adjusts to sudden price movements. Higher values lead to a slower adjustment and a smoother line, while lower values result in quicker adjustments.
-----------------
Disclaimer
The information contained in my Scripts/Indicators/Ideas/Algos/Systems does not constitute financial advice or a solicitation to buy or sell any securities of any type. I will not accept liability for any loss or damage, including without limitation any loss of profit, which may arise directly or indirectly from the use of or reliance on such information.
All investments involve risk, and the past performance of a security, industry, sector, market, financial product, trading strategy, backtest, or individual's trading does not guarantee future results or returns. Investors are fully responsible for any investment decisions they make. Such decisions should be based solely on an evaluation of their financial circumstances, investment objectives, risk tolerance, and liquidity needs.
My Scripts/Indicators/Ideas/Algos/Systems are only for educational purposes!

Daily Pivots with Fakeout Protection█ OVERVIEW
The "Daily Pivots with Fakeout Protection" indicator is a powerful tool designed to help traders identify potential price breakouts and pivot levels on daily charts. This indicator calculates and displays daily pivot points along with breakout lines that are adjusted to provide a certain level of protection against fakeouts, which are false price movements that can mislead traders.
█ FEATURES
• Pivot Timeframe Selection: You can choose the timeframe for the pivot calculations. The default is set to daily (D), but you have the flexibility to select other timeframes as well.
• Fakeout Protection: A percentage-based parameter allows you to define the amount of protection you want against fakeouts. This helps filter out potentially unreliable breakouts.
• Bullish and Bearish Signals: The indicator distinguishes between bullish and bearish conditions by comparing the closing price to the daily high and low.
• Breakout Signals: Triangular symbols (upward and downward) appear below and above bars to signal potential breakout points. These are based on the closing price crossing the adjusted breakout lines.
• Visual Representation: Pivot points, daily high, and daily low are plotted on the chart, with distinctive line styles and colors for easy identification.
• Background Highlighting: The background color of the chart changes when a new period begins, helping you quickly recognize the start of a new trading day.
• Color-Coded Zones: The indicator colors the background around the closing price differently based on whether the market is bullish (green) or bearish (red).
█ HOW TO USE
1 — Apply the "Daily Pivots with Fakeout Protection" indicator to your TradingView chart.
2 — Customize the parameters like pivot timeframe and fakeout protection percentage according to your trading preferences.
3 — Watch for the triangular breakout symbols that appear above and below bars, indicating potential breakout points.
4 — Keep an eye on the pivot points, daily high, and daily low lines to understand price levels relevant to the current trading day.
5 — Use the background color changes to quickly identify the beginning of a new trading day and any potential shifts in market sentiment.
Note:
• This indicator is designed for daily charts but can be adjusted to work with other timeframes as well.
• Be cautious of relying solely on breakout signals; consider using additional technical and fundamental analysis for confirmation.
Start integrating the "Daily Pivots with Fakeout Protection" indicator into your trading strategy to enhance your ability to identify breakouts and pivot levels more effectively.

Support and Resistance Signals MTF [LuxAlgo]The Support and Resistance Signals MTF indicator aims to identify undoubtedly one of the key concepts of technical analysis Support and Resistance Levels and more importantly, the script aims to capture and highlight major price action movements, such as Breakouts , Tests of the Zones , Retests of the Zones , and Rejections .
The script supports Multi-TimeFrame (MTF) functionality allowing users to analyze and observe the Support and Resistance Levels/Zones and their associated Signals from a higher timeframe perspective.
This script is an extended version of our previously published Support-and-Resistance-Levels-with-Breaks script from 2020.
Identification of key support and resistance levels/zones is an essential ingredient to successful technical analysis.
🔶 USAGE
Support and resistance are key concepts that help traders understand, analyze and act on chart patterns in the financial markets. Support describes a price level where a downtrend pauses due to demand for an asset increasing, while resistance refers to a level where an uptrend reverses as a sell-off happens.
The creation of support and resistance levels comes as a result of an initial imbalance of supply/demand, which forms what we know as a swing high or swing low. This script starts its processing using the swing highs/lows. Swing Highs/Lows are levels that many of the market participants use as a historical reference to place their trading orders (buy, sell, stop loss), as a result, those price levels potentially become and serve as key support and resistance levels.
One of the important features of the script is the signals it provides. The script follows the major price movements and highlights them on the chart.
🔹 Breakouts (non-repaint)
A breakout is a price moving outside a defined support or resistance level, the significance of the breakout can be measured by examining the volume. This script is not filtering them based on volume but provides volume information for the bar where the breakout takes place.
🔹 Retests
Retest is a case where the price action breaches a zone and then revisits the level breached.
🔹 Tests
Test is a case where the price action touches the support or resistance zones.
🔹 Rejections
Rejections are pin bar patterns with high trading volume.
Finally, Multi TimeFrame (MTF) functionality allows users to analyze and observe the Support and Resistance Levels/Zones and their associated Signals from a higher timeframe perspective.
🔶 SETTINGS
The script takes into account user-defined parameters to detect and highlight the zones, levels, and signals.
🔹 Support & Resistance Settings
Detection Timeframe: Set the indicator resolution, the users may examine higher timeframe detection on their chart timeframe.
Detection Length: Swing levels detection length
Check Previous Historical S&R Level: enables the script to check the previous historical levels.
🔹 Signals
Breakouts: Toggles the visibility of the Breakouts, enables customization of the color and the size of the visuals
Tests: Toggles the visibility of the Tests, enables customization of the color and the size of the visuals
Retests: Toggles the visibility of the Retests, enables customization of the color and the size of the visuals
Rejections: Toggles the visibility of the Rejections, enables customization of the color and the size of the visuals
🔹 Others
Sentiment Profile: Toggles the visibility of the Sentiment Profiles
Bullish Nodes: Color option for Bullish Nodes
Bearish Nodes: Color option for Bearish Nodes
🔶 RELATED SCRIPTS
Support-and-Resistance-Levels-with-Breaks
Buyside-Sellside-Liquidity
Liquidity-Levels-Voids

Consolidation Spotter Multi Time FrameThis tool is designed for traders looking to spot areas of consolidation on their charts across various time frames. It highlights these consolidation areas using visually appealing boxes, making it easier to identify potential breakout or breakdown zones.
How To Use:
Spotting Consolidation: When you see a box form on your chart, this represents a consolidation zone. Within this zone, the price is moving sideways without a strong upward or downward trend.
Anticipating Breakouts & Breakdowns: Watch the price as it approaches the edges of the box. A movement outside the box can signal a potential breakout (if above the box) or a breakdown (if below the box). This is where momentum shifts can happen.
Momentum Confirmation: Once the price clearly moves out of the box, it indicates a momentum shift. If the price moves upwards out of the box, this can be seen as bullish momentum. Conversely, if the price moves downwards out of the box, this can be seen as bearish momentum.
To use the tool effectively, adjust the settings to suit your trading style, choose your preferred visual theme, and watch as the script highlights key consolidation areas on your chart.
Tip: To visualize fractals, consider using multiple instances of the "Consolidation Spotter" indicator, each set to a different timeframe. This approach allows you to observe consolidations nested within larger consolidations, offering deeper insights into market structures. 😉

Strategy - Relative Volume GainersStrategy - Relative Volume Gainers
Overview:
This trading strategy, called "Relative Volume Gainers," is designed for Long Entry opportunities in the stock market. The strategy aims to identify potential trading candidates based on specific technical conditions, including volume, price movements, and indicator alignments.
Strategy Rules:
The strategy is focused solely on Long Entry positions.
The volume for the current trading day must be greater than or equal to the volume of the previous day.
The percentage change in price must be greater than or equal to 2.5%.
The Last Traded Price (LTP) must be greater than or equal to the Exponential Moving Average (EMA) 200.
The Relative Volume for the current trading day (calculated over the last 30 days) must be greater than or equal to the Simple Moving Average (SMA) of Relative Volume over the same 30 days.
The current candle on the chart should be Green or Bullish, indicating positive price movement.
The price difference between bid and ask prices should be kept to a minimum.
It's recommended to also analyze market depth for better insights.
Strategy Requirements:
Add the Exponential Moving Average (EMA) 200 to your trading chart.
This strategy can be applied on charts of any timeframe.
For intraday trading, particularly for early entry, consider using a 1-minute timeframe.
It is advisable to create a screener to identify potential trades in real-time market conditions.
Risk Warning:
Stocks that meet the strategy criteria might exhibit high volatility and a high beta, making them inherently risky to trade. Exercise caution and adhere to predetermined risk management strategies.
Determine your trading quantity based on your entry price and stop loss in order to manage risk effectively.
Quantity Calculation Formula:
Quantity calculation is crucial to manage risk and position sizing. The following formulas can be used based on your trading scenario:
Quantity with Leverage:
Quantity = (((Using Capital / 100) * Risk Percent) / (Entry Price - Stop Loss)) * Leverage
Eg: Quantity = (((10000 / 100) * 0.2) / (405.5 - 398.5)) * 5
Quantity = 14
Risk = Rs.100 (Rs.100 is 1% of Rs.10000. So the risk is 1%, means we lose only Rs.100 when the SL is hit. If SL is increased the Quantity will get reduced to maintain a fixed risk of Rs.100)
Quantity without Leverage:
Quantity = (((Using Capital / 100) * Risk Percent) / (Entry Price - Stop Loss))
Note:
Always stay informed about market conditions and be prepared for potential rapid price movements when trading stocks that meet the strategy criteria. Strictly adhere to your predefined risk management strategy to safeguard your capital.

Previous Day High Low Strategy only for LongWelcome to the "Previous Day High Low Strategy only for Long"!.
This strategy aims to identify potential long trading opportunities based on the previous day's high and low prices, along with certain market strength conditions.
Key Features:
Entry Conditions: The strategy triggers a long position when the current day's closing price crosses above the previous day's high or low.
Market Strength Filter: The strategy incorporates a market strength filter using the Average Directional Index (ADX). It only takes long positions when the ADX value is above a specific threshold and when there is a predominance of upward movement.
Trade Timing: The strategy operates within a specified trade window, starting at 09:30 and ending at 15:10. Positions are closed at 15:15 if still active.
Risk Management: The strategy employs dynamic stop-loss and profit-taking levels based on a user-defined Max Profit value. It has three profit targets (T1, T2, T3) and a stop-loss level to manage risk effectively.
Rules:
Ensure that the strategy idea is clearly understandable. Provide an easy-to-read title and a thoughtful description explaining the reasoning behind the strategy.
All content should be ad-free. Avoid any form of promotion, advertising, or solicitation.
No fundraising requests or money solicitation is allowed on TradingView.
Publish in the same language as the TradingView subdomain you're on, except for script titles, which must be in English.
Don't plagiarize. Create and share only unique content, and always give credit when using someone else's work.
Be respectful, kind, and constructive when engaging with others.
Zero tolerance for contentious political discourse, defamatory, threatening, or discriminatory remarks.
Avoid sharing harmful, misleading, or inappropriate content.
Respect the moderators' work and address complaints privately.
Use only your original account and avoid creating duplicate or fake accounts.
Do not attempt to manipulate the reputation system or engage in like-for-like schemes.
Explanation of how the strategy works
1. Previous Day's High and Low (HH, LL):
In this strategy, we start by obtaining the high and low prices of the previous day (not the current day) using the request.security function. This function allows us to access historical data for a specific time frame. The high and low prices are stored in the variables HH and LL, respectively.
2. Entry Conditions:
The strategy uses two conditions to trigger a long position:
Condition 1 (Long Condition 1): If the closing price of the current day crosses above the previous day's high (HH), it generates a long signal. This is achieved using the ta.crossover function, which detects when a crossover occurs.
Condition 2 (Long Condition 2): Similarly, if the closing price of the current day crosses above the previous day's low (LL), it also generates a long signal.
Combined Condition: To take long positions, the strategy combines both long conditions using the logical OR operator (or). This means that if either of the two conditions is met, a long position will be initiated.
3. Market Strength Filter:
The strategy also includes a filter based on the Average Directional Index (ADX) to gauge the market's strength before taking long positions. The ADX measures the strength of a trend in the market. The higher the ADX value, the stronger the trend.
Calculation of ADX: The ADX is calculated using the adx function, which takes two parameters: LWdilength (DMI Length) and LWadxlength (ADX period).
Strength Condition (strength_up): The strategy requires that the ADX value should be above a threshold (11 in this case) and that there is a predominance of upward movement (up > down) before initiating a long position. The LWADX value is multiplied by 2.5 and compared to the highest value of LWADX from the last 4 periods using ta.highest(LWADX , 4). If these conditions are met, the variable strength_up is set to true.
Combined Condition: The strength_up condition is then combined with the long conditions using the logical AND operator (and). This means that the strategy will only take a long position if both the long conditions and the market strength condition are met.
4. Trade Timing:
The strategy sets a specific trade window between 09:30 and 15:10. It will only execute trades within this time frame (TradeTime).
5. Risk Management:
The strategy implements dynamic stop-loss (SL) and profit-taking levels (T1, T2, T3) based on a user-defined Max Profit value. The stop-loss is set as a percentage of the Max Profit value. As the position moves in favor of the trader, the profit targets are adjusted accordingly.
6. Position Management:
The strategy uses the strategy.entry function to enter long positions based on the combined entry conditions. Once a position is open, the script uses strategy.exit to define the exit condition when either the profit target or stop-loss level is hit. The strategy.close function is used to close any open position at the end of the trade window (15:15).
7. Plotting:
The strategy uses the plot function to visualize the previous day's high and low prices, as well as the stop-loss (SL) and profit-taking (T1, T2, T3) levels on the chart.
Overall, the "Previous Day High Low Strategy only for Long" aims to identify potential long trading opportunities based on the previous day's price action and market strength conditions. However, as with any trading strategy, it's essential to thoroughly test it and consider risk management before applying it to real-world trading scenarios.
Disclaimer:
The information presented by this strategy is for educational purposes only and should not be considered as investment advice. The strategy is not designed for qualified investors. Always conduct your own research and consult with a financial advisor before making any trading decisions.
Remember, the success of any trading strategy depends on various factors, including market conditions, risk management, and individual trading skills. Past performance is not indicative of future results.
