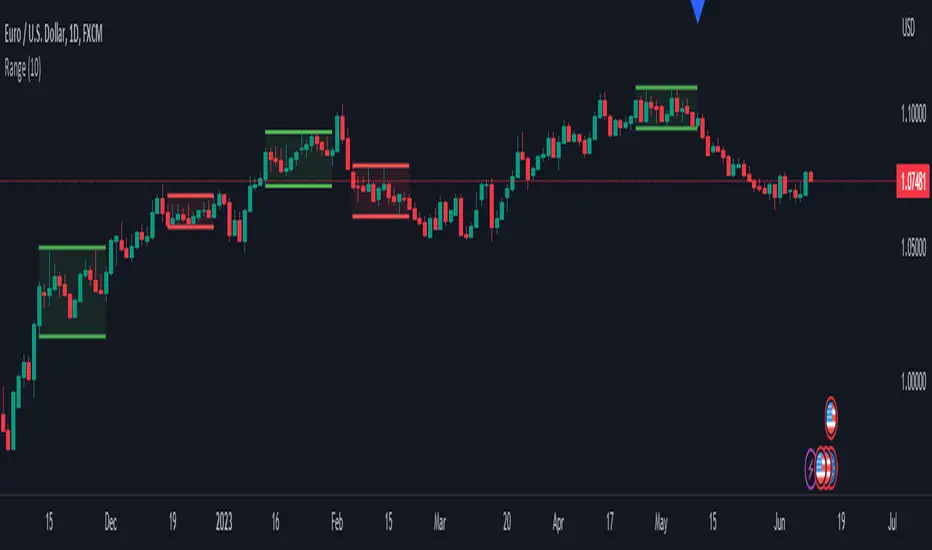
Swing Failure Pattern SFP [TradingFinder] SFP ICT Strategy🔵 Introduction
The Swing Failure Pattern (SFP), also referred to as a "Fake Breakout" or "False Breakout," is a vital concept in technical analysis. This pattern is derived from classic technical analysis, price action strategies, ICT concepts, and Smart Money Concepts.
It’s frequently utilized by traders to identify potential trend reversals in financial markets, especially in volatile markets like cryptocurrencies and forex. SFP helps traders recognize failed attempts to breach key support or resistance levels, providing strategic opportunities for trades.
The Swing Failure Pattern (SFP) is a popular strategy among traders used to identify false breakouts and potential trend reversals in the market. This strategy involves spotting moments where the price attempts to break above or below a previous high or low (breakout) but fails to sustain the move, leading to a sharp reversal.
Traders use this strategy to identify liquidity zones where stop orders (stop hunt) are typically placed and targeted by larger market participants or whales.
When the price penetrates these areas but fails to hold the levels, a liquidity sweep occurs, signaling exhaustion in the trend and a potential reversal. This strategy allows traders to enter the market at the right time and capitalize on opportunities created by false breakouts.
🟣 Types of SFP
When analyzing SFPs, two main variations are essential :
Real SFP : This occurs when the price breaks a critical level but fails to close above it, then quickly reverses. Due to its clarity and strong signal, this SFP type is highly reliable for traders.
Considerable SFP : In this scenario, the price closes slightly above a key level but quickly declines. Although significant, it is not as definitive or trustworthy as a Real SFP.
🟣 Understanding SFP
The Swing Failure Pattern, or False Breakout, is identified when the price momentarily breaks a crucial support or resistance level but cannot maintain the movement, leading to a rapid reversal.
The pattern can be categorized as follows :
Bullish SFP : This type occurs when the price dips below a support level but rebounds above it, signaling that sellers failed to push the price lower, indicating a potential upward trend.
Bearish SFP : This pattern forms when the price surpasses a resistance level but fails to hold, suggesting that buyers couldn’t maintain the higher price, leading to a potential decline.
🔵 How to Use
To effectively identify an SFP or Fake Breakout on a price chart, traders should follow these steps :
Identify Key Levels: Locate significant support or resistance levels on the chart.
Observe the Fake Breakout: The price should break the identified level but fail to close beyond it.
Monitor Price Reversal: After the breakout, the price should quickly reverse direction.
Execute the Trade: Traders typically enter the market after confirming the SFP.
🟣 Examples
Bullish Example : Bitcoin breaks below a $30,000 support level, drops to $29,000, but closes above $30,000 by the end of the day, signaling a Real Bullish SFP.
Bearish Example : Ethereum surpasses a $2,000 resistance level, rises to $2,100, but then falls back below $2,000, forming a Bearish SFP.
🟣 Pros and Cons of SFP
Pros :
Effective in identifying strong reversal points.
Offers a favorable risk-to-reward ratio.
Applicable across different timeframes.
Cons :
Requires experience and deep market understanding.
Risk of encountering false breakouts.
Should be combined with other technical tools for optimal effectiveness.
🔵 Settings
🟣 Logical settings
Swing period : You can set the swing detection period.
SFP Type : Choose between "All", "Real" and "Considerable" modes to identify the swing failure pattern.
Max Swing Back Method : It is in two modes "All" and "Custom". If it is in "All" mode, it will check all swings, and if it is in "Custom" mode, it will check the swings to the extent you determine.
Max Swing Back : You can set the number of swings that will go back for checking.
🟣 Display settings
Displaying or not displaying swings and setting the color of labels and lines.
🟣 Alert Settings
Alert SFP : Enables alerts for Swing Failure Pattern.
Message Frequency : Determines the frequency of alerts. Options include 'All' (every function call), 'Once Per Bar' (first call within the bar), and 'Once Per Bar Close' (final script execution of the real-time bar). Default is 'Once per Bar'.
Show Alert Time by Time Zone : Configures the time zone for alert messages. Default is 'UTC'.
🔵 Conclusion
The Swing Failure Pattern (SFP), or False Breakout, is an essential analytical tool that assists traders in identifying key market reversal points for successful trading.
By understanding the nuances between Real SFP and Considerable SFP, and integrating this pattern with other technical analysis tools, traders can make more informed decisions and better manage their trading risks.
Breakoutsignal

Swing Points [CrossTrade]The "Swing Points" indicator is designed to help identify key swing points, trends, and potential support and resistance areas on a trading chart. This indicator overlays on the price chart and offers several features for enhanced market analysis.
Swing Point Identification: The indicator identifies swing highs and lows (pivot points) over a user-defined period. These points are crucial in understanding market reversals and momentum.
Swing Points Display: Users have the option to visually display these pivot points on the chart. Swing highs are marked with a red "H" above the bar, and swing lows with a green "L" below the bar, aiding in quick visual identification.
Center Line Calculation and Display: A dynamic center line is calculated using the pivot points, providing a baseline that adapts to market movements. The center line's appearance changes based on its position relative to the current price, making it a useful trend indicator.
Support and Resistance Levels: The indicator plots horizontal support and resistance lines based on the swing lows and highs, respectively. This feature helps traders identify potential areas of price consolidation or breakout.
Customization Options: Users can customize the period for swing point calculation and choose whether to display the pivot points, center line, and support/resistance levels.
Alert Features
Swing High Break Alert: An alert is triggered when a new swing high is detected, signaling a potential upward momentum shift.
Swing Low Break Alert: This alert activates when a new swing low is formed, possibly indicating a downward momentum shift.
Center Line Trend Color Change Alert: Alerts users when the center line changes its trend color, which could signify a change in overall market trend direction.

Historical Swing High-Low Gann IndicatorThe Historical Swing High-Low Gann Indicator is a powerful tool designed to track and visualize key market swing points over time. This indicator identifies significant swing highs and lows within a specified time frame and draws connecting lines between these points, allowing traders to observe the natural ebb and flow of the market.
What sets this indicator apart is its ability to maintain all previously drawn swing lines, creating a comprehensive historical view of market movements. Additionally, the indicator projects Gann-style lines from the most recent swing highs and lows, providing traders with potential future support and resistance levels based on the geometric progression of price action.
Features:
Swing Detection: Automatically detects significant swing highs and lows over a user-defined period (default is 3 hours).
Persistent Historical Lines: Keeps all previously drawn lines, offering a complete visual history of the market's swing points.
Gann-Style Projections: Draws forward-looking lines from the latest swing points to help predict possible future market levels.
Customizable Parameters: Allows users to adjust the swing detection period to suit different trading styles and time frames.
This indicator is ideal for traders who rely on price action, support and resistance levels, and Gann theory for their analysis. Whether used in isolation or as part of a broader strategy, the Historical Swing High-Low Gann Indicator provides valuable insights into the market's behavior over time.

Pivot Channel Breaks [BigBeluga]Pivot Channel Break
The Pivot Channel Break indicator identifies key pivot points and creates a dynamic channel based on these pivots. It detects breakouts from this channel, providing potential entry and exit signals for traders.
🔵 How to Use
Channel Identification:
- Upper and lower channel lines drawn based on pivot highs and lows
- Channel width dynamically adjusted using ATR-like calculation
Breakout Signals:
- Upward breakout: Price closes above upper channel line
- Downward breakout: Price closes below lower channel line
- Signals shown as X marks on the chart
Pivot Points:
- High pivots marked with "H" triangles
- Low pivots marked with "L" triangles
Support & Resistance:
- Optional signals when price touches but doesn't break channel lines
Trend Visualization:
- Optional bar coloring based on the most recent breakout direction
🔵 Customization
• Pivot Right: Lookback period for pivot detection (default: 10)
• Pivot Left: Forward period for pivot confirmation (default: 40)
• Channel Width: Multiplier for channel width calculation (default: 1.0)
• Support & Resistance Signals: Toggle additional touch signals
• Bar Color: Enable/disable trend-based bar coloring
Calculation:
Detect pivot highs and lows using specified lookback periods
Calculate channel basis using 10-period SMA of close prices
Determine channel width using ATR-like calculation: RMA(high - low, 10) * width multiplier
Set channel lines based on pivot points and calculated deviations
Identify breakouts when price crosses beyond channel lines
The Pivot Channel Break indicator offers a dynamic approach to identifying potential trend changes and breakout opportunities. It combines pivot point analysis with a flexible channel calculation, providing traders with a visual tool for market structure analysis. Use this indicator in conjunction with other technical analysis methods to confirm signals and manage risk effectively.

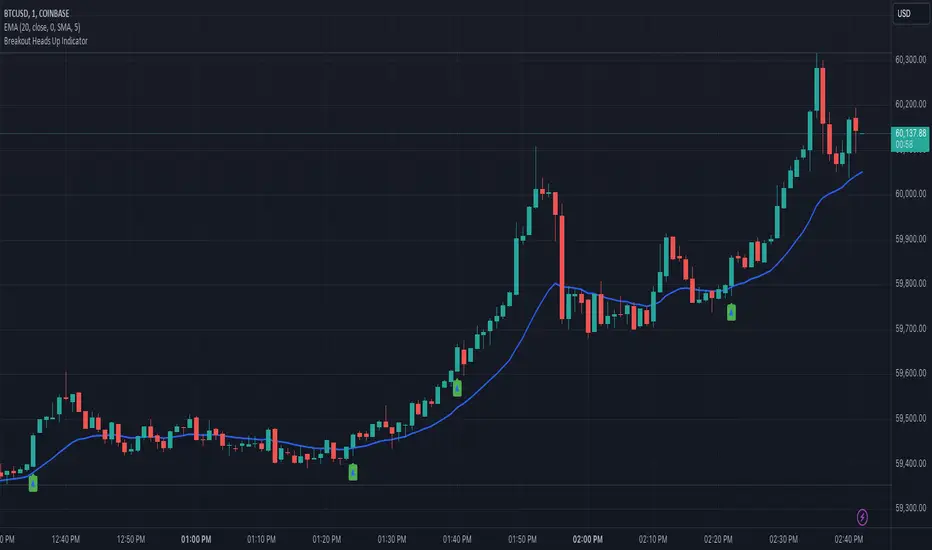
Heads UpAn indicator that gives you the "heads up" that that bullish/ bearish strength is increasing.
I wanted an indicator that could give me the "heads up" that bullish/ bearish strength is increasing. This would help me get into a breakout early or avoid entering a breakout that had a high probability of failure.
Here are my definitions for this indicator:
My bull bar definition:
- A green candle that closes above 75% of it's candle range.
- The candle's body does not overlap the previous candle's body. Tails/ wicks CAN overlap.
My bear bar definition:
- A red candle that closes below 75% of it's candle range.
- the candle's body does not overlap the previous candle's body. Tails/ ticks CAN overlap.
Bullish strength increasing (arrow up):
- Bull bars are increasing in size (the candle's range) compared to previous 5 bars.
- 2 consecutive bull bars.
Bearish strength increasing (arrow down):
- Bear bars are increasing in size (the candle's range) compared to previous 5 bars.
- 2 consecutive bear bars.
You will not see this indicator trigger very often but when it does - it's because there is a change in bullish bearish strength.
Things to be aware of:
Use the indicator in line with the context of the previous trend. You will get triggers that fail. These are usually because they appear counter trend. When in doubt zoom out.
It will not call every successful breakout. If you understand the definitions you'll understand why it appears.
This is my first indicator and used for my personal use. Feedback and other ideas are welcome.
Swing Failure Pattern (SFP) [LuxAlgo]The Swing Failure Pattern indicator highlights Swing Failure Patterns (SFP) on the user chart, a pattern occurring during liquidity generation from significant market participants.
A Confirmation level used to confirm a trend reversal is also included. Users can additionally filter out SFP based on a set Volume % Threshold .
🔶 USAGE
Swing failure patterns occur when candle wicks exceed (above/below) a recent swing level but close back below/above it, and occur from more significant market participants engineering liquidity. This pattern can be indicative of a potential trend reversal.
A label and an accentuated wick line highlight the SFP (both can be disabled).
Using a higher "Swings" period will not return different SFP but will however potentially reduce their detection rate.
🔹 Confirmation Level
The confirmation level is the highest point between the previous swing and SFP for a bullish SFP, and the lowest point for a bearish SFP. This level allows confirming a trend reversal after an SFP once the price breaks it.
A small triangle will be displayed when the price closes beyond the confirmation level.
A more reactive and contrarian approach could use the SFP as an entry point, and the confirmation level for taking (partial) profit, or stop loss. The example below shows a possible scenario:
🔹 Volume % Threshold
During the occurrence of an SFP, the Volume % Threshold option allows comparing the cumulative volume outside the Swing level to the total volume of the candle. The following options are included:
Volume outside swing < Threshold: Volume outside the Swing level needs to be lower than x % of total candle volume. Prevent excessive liquidity generation.
Volume outside swing > Threshold: Volume outside the Swing level needs to be higher than x % of total candle volume. Requires more significant liquidity to be generated.
None: No extra filter is applied
Note that in the above case, the left SFP is no longer highlighted because the volume above the swing level was higher than the 25% threshold of the total volume.
When we change the setting to "Volume outside swing > Threshold", we get the reversed situation.
The "Volume outside Swing level" is obtained using intrabar - Lower TimeFrame (LTF) data.
At the intrabar (LTF) level, there are a maximum of 100K bars available. When using the Volume % Threshold filter, a vertical line will highlight the maximum period during which intrabars are available.
🔶 DETAILS
🔹 LTF Settings
When 'Auto' is enabled (Settings, LTF), the LTF will be the nearest possible x times smaller TF than the current TF. When 'Premium' is disabled, the minimum TF will always be 1 minute to ensure TradingView plans lower than Premium don't get an error.
Examples with current Daily TF (when Premium is enabled):
500 : 3-minute LTF
1500 (default): 1-minute LTF
5000: 30 seconds LTF (1 minute if Premium is disabled)
The concerning LTF can be seen at the right-top (default) corner.
🔶 SETTINGS
Swings: Period used for the swing detection, with higher values returning longer-term Swing Levels.
Bullish SFP: enable/disable bullish Swing Failure Patterns.
Bearish SFP: enable/disable bearish Swing Failure Patterns.
🔹 Volume Validation
Validation:
Volume outside swing < Threshold: The volume outside the swing level needs to be lower than x % of the total volume.
Volume outside swing > Threshold: The volume outside the swing level needs to be higher than x % of the total volume.
None: No extra validation is applied.
Volume % Threshold: % of total volume as threshold.
Auto + multiple: Adjusts the initial set LTF
LTF: LTF setting
Premium: Enable when your TradingView plan is Premium or higher
🔹 Dashboard
Show Dashboard: Display applied Lower Timeframe (LTF)
Location: Location of the dashboard
Size: Size of the dashboard
🔹 Style
Swing Lines
Confirmation Lines
Swing Failure Wick
Swing Failure Label
Lines / Labels: Color for lines and labels
SFP Wicks: Color for SFP wick line

TrendLine Toolkit w/ Breaks (Real-Time)The TrendLine Toolkit script introduces an innovating capability by extending the conventional use of trendlines beyond price action to include oscillators and other technical indicators. This tool allows traders to automatically detect and display trendlines on any TradingView built-in oscillator or community-built script, offering a versatile approach to trend analysis. With breakout detection and real-time alerts, this script enhances the way traders interpret trends in various indicators.
🔲 Methodology
Trendlines are a fundamental tool in technical analysis used to identify and visualize the direction and strength of a price trend. They are drawn by connecting two or more significant points on a price chart, typically the highs or lows of consecutive price movements (pivots).
Drawing Trendlines:
Uptrend Line - Connects a series of higher lows. It signals an upward price trend.
Downtrend Line - Connects a series of lower highs. It indicates a downward price trend.
Support and Resistance:
Support Line - A trendline drawn under rising prices, indicating a level where buying interest is historically strong.
Resistance Line - A trendline drawn above falling prices, showing a level where selling interest historically prevails.
Identification of Trends:
Uptrend - Prices making higher highs and higher lows.
Downtrend - Prices making lower highs and lower lows.
Sideways (or Range-bound) - Prices moving within a horizontal range.
A trendline helps confirm the existence and direction of a trend, providing guidance in aligning with the prevailing market sentiment. Additionally, they are usually paired with breakout analysis, a breakout occurs when the price breaches a trendline. This signals a potential change in trend direction or an acceleration of the existing trend.
The script adapts this methodology to oscillators and other indicators. Instead of relying on price pivots, which can only be detected in retrospect, the script utilizes a trailing stop on the oscillator to identify potential swings in real-time, you may find more info about it here (SuperTrend toolkit) . We detect swings or pivots simply by testing for crosses between the indicator and its trailing stop.
type oscillator
float o = Oscillator Value
float s = Trailing Stop Value
oscillator osc = oscillator.new()
bool l = ta.crossunder(osc.o, osc.s) => Utilized as a formed high
bool h = ta.crossover (osc.o, osc.s) => Utilized as a formed low
This approach enables the algorithm to detect trendlines between consecutive pivot highs or lows on the oscillator itself, providing a dynamic and immediate representation of trend dynamics.
🔲 Breakout Detection
The script goes beyond trendline creation by incorporating breakout detection directly within the oscillator. After identifying a trendline, the algorithm continuously monitors the oscillator for potential breakouts, signaling shifts in market sentiment.
🔲 Setup Guide
A simple example on one of my public scripts, Z-Score Heikin-Ashi Transformed
🔲 Settings
Source - Choose an oscillator source of which to base the Toolkit on.
Zeroing - The Mid-Line value of the oscillator, for example RSI & MFI use 50.
Sensitivity - Calibrates the Sensitivity of which TrendLines are detected, higher values result in more detections.
🔲 Alerts
Bearish TrendLine
Bullish TrendLine
Bearish Breakout
Bullish Breakout
As well as the option to trigger 'any alert' call.
By integrating trendline analysis into oscillators, this Toolkit enhances the capabilities of technical analysis, bringing a dynamic and comprehensive approach to identifying trends, support/resistance levels, and breakout signals across various indicators.

Dynamic Momentum GaugeOverview
The Dynamic Momentum Gauge is an indicator designed to provide information and insights into the trend and momentum of a financial asset. While this indicator is not directional , it helps you know when there will be a trend, big move, or when momentum will have a run, and when you should take profits.
How It Works
This indicator calculates momentum and then removes the negative values to focus instead on when the big trend could likely happen and when it could end, or when you should enter a trade based on momentum or exit. Traders can basically use this indicator to time their market entries or exits, and align their strategies with momentum dynamics.
How To Use
As previously mentioned, this is not a directional indicator but more like a timing indicator. This indicator helps you find when the trend moves, and big moves in the markets will occur and its possibly best to exit the trades. For example, if you decide to enter a long trade if the Dynamic Momentum Gauge value is at an extreme low and another momentum indicator that you use has conditions that you would consider to long with, then this indicator is basically telling you that there isn't more space for the momentum to squeeze any longer, can only really expand from that point or stay where it currently is, but this is also a mean reverting process so it does tend to go back up from the low point.
Settings:
Length: This is the length of the momentum, by default its at 100.
Normalization Length: Length of the Normalization which ensures the the values fall within a consistent range.

Breakout Detector (Previous MTF High Low Levels) [LuxAlgo]The Breakout Detector (Previous MTF High Low Levels) indicator highlights breakouts of previous high/low levels from a higher timeframe.
The indicator is able to: display take-profit/stop-loss levels based on a user selected Win/Loss ratio, detect false breakouts, and display a dashboard with various useful statistics.
Do note that previous high/low levels are subject to backpainting, that is they are drawn retrospectively in their corresponding location. Other elements in the script are not subject to backpainting.
🔶 USAGE
Breakouts occur when the price closes above a previous Higher Timeframe (HTF) High or below a previous HTF Low.
On the advent of a breakout, the closing price acts as an entry level at which a Take Profit (TP) and Stop Loss (SL) are placed. When a TP or SL level is reached, the SL/TP box border is highlighted.
When there is a breakout in the opposite direction of an active breakout, previous breakout levels stop being updated. Not reaching an SL/TP level will result in a partial loss/win,
which will result in the box being highlighted with a dotted border (default). This can also be set as a dashed or solid border.
Detection of False Breakouts (default on) can be helpful to avoid false positives, these can also be indicative of potential trend reversals.
This indicator contains visualization when a new HTF interval begins (thick vertical grey line) and a dashboard for reviewing the breakout results (both defaults enabled; and can be disabled).
As seen in the example above, the active, open breakout is colored green/red.
You can enable the setting ' Cancel TP/SL at the end of HTF ', which will stop updating previous TP/SL levels on the occurrence of a new HTF interval.
🔶 DETAILS
🔹 Principles
Every time a new timeframe period starts, the previous high and low are detected of the higher timeframe. On that bar only there won't be a breakout detection.
A breakout is confirmed when the close price breaks the previous HTF high/low
A breakout in the same direction as the active breakout is ignored.
A breakout in the opposite direction stops previous breakout levels from being updated.
Take Profit/Stop Loss, partially or not, will be highlighted in an easily interpretable manner.
🔹 Set Higher Timeframe
There are 2 options for choosing a higher timeframe:
• Choose a specific higher timeframe (in this example, Weekly higher TF on a 4h chart)
• Choose a multiple of the current timeframe (in this example, 75 minutes TF on a 15 min chart - 15 x 5)
Do mind, that when using this option, non-standard TFs can give less desired timeframe changes.
🔹 Setting Win/Loss Levels
The Stop Loss (SL) / Take Profit (TP) setting has 2 options:
W%:L% : A fixed percentage is chosen, for TP and SL.
W:L : In this case L (Loss-part) is set through Loss Settings , W (Win-part) is calculated by multiplying L , for example W : L = 2 : 1, W will be twice as large as the L .
🔹 Loss Settings
The last drawing at the right is still active (colored green/red)
The Loss part can be:
A multiple of the Average True Range (ATR) of the last 200 bars.
A multiple of the Range Cumulative Mean (RCM).
The Latest Swing (with Length setting)
Range Cumulative Mean is the sum of the Candle Range (high - low) divided by its bar index.
🔹 False Breakouts
A False Breakout is confirmed when the price of the bar immediately after the breakout bar returns above/below the breakout level.
🔹 Dashboard
🔶 ALERTS
This publication provides several alerts
Bullish/Bearish Breakout: A new Breakout.
Bullish/Bearish False Breakout: False Breakout detected, 1 bar after the Breakout.
Bullish/Bearish TP: When the TP/profit level has been reached.
Bullish/Bearish Fail: When the SL/stop-loss level has been reached.
Note that when a new Breakout causes the previous Breakout to stop being updated, only an alert is provided of the new Breakout.
🔶 SETTINGS
🔹 Set Higher Timeframe
Option : HTF/Mult
HTF : When HTF is chosen as Option , set the Higher Timeframe (higher than current TF)
Mult : When Mult is chosen as Option , set the multiple of current TF (for example 3, curr. TF 15min -> 45min)
🔹 Set Win/Loss Level
SL/TP : W:L or W%:L%: Set the Win/Loss Ratio (Take Profit/Stop Loss)
• W : L : Set the Ratio of Win (TP) against Loss (SL) . The L level is set at Loss Settings
• W% : L% : Set a fixed percentage of breakout price as SL/TP
🔹 Loss Settings
When W : L is chosen as SL/TP Option, this sets the Loss part (L)
Base :
• RCM : Range Cumulative Mean
• ATR : Average True Range of last 200 bars
• Last Swing : Last Swing Low when bullish breakout, last Swing High when bearish breakout
Multiple : x times RCM/ATR
Swing Length : Sets the 'left' period ('right' period is always 1)
Colours : colour of TP/SL box and border
Borders : Style border when breakout levels stop being updated, but TP/SL is not reached. (Default dotted dot , other option is dashed dsh or solid sol )
🔹 Extra
Show Timeframe Change : Show a grey vertical line when a new Higher Timeframe interval begins
Detect False Outbreak
Cancel TP/SL at end of HTF
🔹 Show Dashboard
Location: Location of the dashboard (Top Right or Bottom Right/Left)
Size: Text size (Tiny, Small, Normal)
See USAGE/DETAILS for more information

Range Breakout Signals (Intrabar) [LuxAlgo]The Range Breakout Signals (Intrabar) is a novel indicator highlighting trending/ranging intrabar candles and providing signals when the price breaks the extremities of a ranging intrabar candles.
🔶 USAGE
The indicator highlights candles with trending intrabar prices, with uptrending candles being highlighted in green, and down-trending candles being highlighted in red.
This highlighting is affected by the selected intrabar timeframe, with a lower timeframe returning a more precise estimation of a candle trending/ranging state.
When a candle intrabar prices are ranging the body of the candle is hidden from the chart, and one upper & lower extremities are displayed, the upper extremity is equal to the candle high and the lower extremity to the candle low. Price breaking one of these extremities generates a signal.
The indicator comes with two modes, "Trend Following" and "Reversal", these modes determine the extremities that need to be broken in order to return a signal. The "Trend Following" mode as its name suggests will provide trend-following signals, while "Reversal" will aim at providing early signals suggesting a potential reversal.
🔶 DETAILS
To determine if intrabar prices are trending or ranging we calculate the r-squared of the intrabar data, if the r-squared is above 0.5 it would suggest that lower time frame prices are trending, else ranging.
This approach allows almost obtaining a "settings" free indicator, which is uncommon. The intrabar timeframe setting only controls the intrabar precision, with a timeframe significantly lower than the chart timeframe returning more intrabar data as a result, this however might not necessarily affect the displayed information by the indicator.
🔶 SETTINGS
Intrabar Timeframe: Timeframe used to retrieve the intrabar data within a chart candle. Must be lower than the user chart timeframe.
Auto: Select the intrabar timeframe automatically. This setting is more adapted to intraday charts.
Mode: Signal generation mode.
Filter Out Successive Signals: Allows removing successive signals of the same type, returning a more easily readable chart.

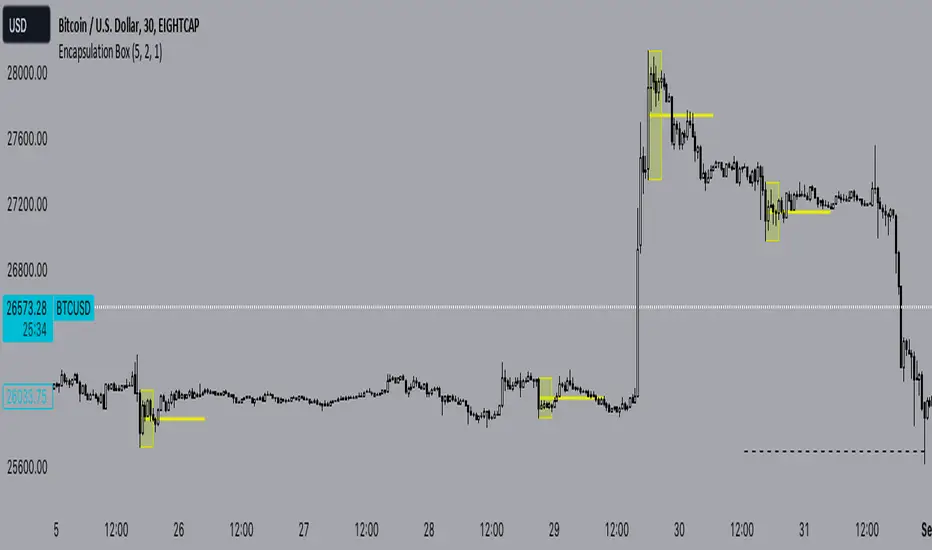
Encapsulation BoxThe “Encapsulation Box” indicator is designed to locate areas of the chart where the highs and lows of candlesticks are “embedded” or enclosed within the body of a previous candlestick. This setup indicates a significant contraction in the market and can provide important trading signals. Here's how it works in more detail:
Detecting contraction: The indicator looks for situations where the price range of the candles is very narrow, i.e. when subsequent candles have highs and lows that are contained within the range of a previous candle. This condition indicates a contraction in the market before a possible directional move.
When a contraction is detected, the indicator draws a rectangle around the area where the highs and lows of the candles are embedded. The rectangle has its upper vertex corresponding to the maximum of the candles involved and its lower vertex corresponding to the minimum. The width of the rectangle is defined by can be customized by the user.
A key feature of this indicator is the horizontal line drawn outside the rectangle. This line is positioned in the middle of the rectangle and represents 50% of the range of the rectangle itself. This line acts as a significant support or resistance level depending on the direction the contraction breaks.
The indicator can generate buy or sell signals when a break in the rectangle or horizontal line occurs. For example, if the price breaks above the rectangle and the horizontal line, it could generate a buy signal, indicating a possible uptrend. Conversely, if the price breaks below the rectangle and the horizontal line, it could generate a sell signal, indicating a possible downtrend.
Support and Resistance Signals MTF [LuxAlgo]The Support and Resistance Signals MTF indicator aims to identify undoubtedly one of the key concepts of technical analysis Support and Resistance Levels and more importantly, the script aims to capture and highlight major price action movements, such as Breakouts , Tests of the Zones , Retests of the Zones , and Rejections .
The script supports Multi-TimeFrame (MTF) functionality allowing users to analyze and observe the Support and Resistance Levels/Zones and their associated Signals from a higher timeframe perspective.
This script is an extended version of our previously published Support-and-Resistance-Levels-with-Breaks script from 2020.
Identification of key support and resistance levels/zones is an essential ingredient to successful technical analysis.
🔶 USAGE
Support and resistance are key concepts that help traders understand, analyze and act on chart patterns in the financial markets. Support describes a price level where a downtrend pauses due to demand for an asset increasing, while resistance refers to a level where an uptrend reverses as a sell-off happens.
The creation of support and resistance levels comes as a result of an initial imbalance of supply/demand, which forms what we know as a swing high or swing low. This script starts its processing using the swing highs/lows. Swing Highs/Lows are levels that many of the market participants use as a historical reference to place their trading orders (buy, sell, stop loss), as a result, those price levels potentially become and serve as key support and resistance levels.
One of the important features of the script is the signals it provides. The script follows the major price movements and highlights them on the chart.
🔹 Breakouts (non-repaint)
A breakout is a price moving outside a defined support or resistance level, the significance of the breakout can be measured by examining the volume. This script is not filtering them based on volume but provides volume information for the bar where the breakout takes place.
🔹 Retests
Retest is a case where the price action breaches a zone and then revisits the level breached.
🔹 Tests
Test is a case where the price action touches the support or resistance zones.
🔹 Rejections
Rejections are pin bar patterns with high trading volume.
Finally, Multi TimeFrame (MTF) functionality allows users to analyze and observe the Support and Resistance Levels/Zones and their associated Signals from a higher timeframe perspective.
🔶 SETTINGS
The script takes into account user-defined parameters to detect and highlight the zones, levels, and signals.
🔹 Support & Resistance Settings
Detection Timeframe: Set the indicator resolution, the users may examine higher timeframe detection on their chart timeframe.
Detection Length: Swing levels detection length
Check Previous Historical S&R Level: enables the script to check the previous historical levels.
🔹 Signals
Breakouts: Toggles the visibility of the Breakouts, enables customization of the color and the size of the visuals
Tests: Toggles the visibility of the Tests, enables customization of the color and the size of the visuals
Retests: Toggles the visibility of the Retests, enables customization of the color and the size of the visuals
Rejections: Toggles the visibility of the Rejections, enables customization of the color and the size of the visuals
🔹 Others
Sentiment Profile: Toggles the visibility of the Sentiment Profiles
Bullish Nodes: Color option for Bullish Nodes
Bearish Nodes: Color option for Bearish Nodes
🔶 RELATED SCRIPTS
Support-and-Resistance-Levels-with-Breaks
Buyside-Sellside-Liquidity
Liquidity-Levels-Voids

Main Market Opener Breakout [RH]Based on my observations while analyzing the crypto and forex charts, particularly BTCUSDT and EURUSD, I have noticed that the prices exhibit significant movements during most stock market sessions, particularly during New York main market session.
With the aim of capturing these moves, I embarked on extensive research. Through this research, I discovered that by considering the very first "15m" or "30m" candle of the main market trading session and marking that first candle's high and low points, we can create potential trigger points.
A break above the high point indicates a bullish signal, while a break below the low point suggests a bearish signal. To further refine our analysis and filter out some noise, we can incorporate the Average True Range (ATR) value of that candle.
Candle time is very important here. We will mark the candle when the actual trading begins in New York stock exchange. The trading hours for the New York Stock Exchange (NYSE) typically begin at 9:30 AM and end at 4:00 PM Eastern Time (ET), Monday through Friday. This is known as the "NYSE Regular Trading Session." However, it's important to note that there are also pre-market and after-hours trading sessions that occur outside of these core hours. We will not consider these pre and after-hours.
Example:
First break-above and break-below is marked automatically and alerts are also available for first breaks.
Example:
I have also added the option to add the, London Stock Exchange Main Market and Tokyo Stock Exchange Regular Trading Session. You can add those sessions also and test with different symbols.
Stocks symbols from different stock exchanges just mark the very first candle of the day(main market trading session).
Alerts are available.

Multi-Band Breakout IndicatorThe Multi-Band Breakout Indicator was created to help identify potential breakout opportunities in the market. It combines multiple bands (ATR-Based and Donchian) and moving averages to provide valuable insights into the underlying trend and potential breakouts. By understanding the calculations, interpretation, parameter adjustments, potential applications, and limitations of the indicator, traders can effectively incorporate it into their trading strategy.
Calculation:
The indicator utilizes several calculations to plot the bands and moving averages. The length parameter determines the period used for the Average True Range (ATR), which measures volatility. A higher length captures a longer-term view of price movement, while a lower length focuses on shorter-term volatility. The multiplier parameter adjusts the distance of the upper and lower bands from the ATR. A higher multiplier expands the bands, accommodating greater price volatility, while a lower multiplier tightens the bands, reflecting lower volatility. The MA Length parameter determines the period for the moving averages used to calculate the trend and trend moving average. A higher MA Length creates a smoother trend line, filtering out shorter-term fluctuations, while a lower MA Length provides a more sensitive trend line.
The Donchian calculations in the Multi-Band Breakout Indicator play a significant role in identifying potential breakout opportunities and providing additional confirmation for trading signals. In this indicator, the Donchian calculations are applied to the trend line, which represents the average of the upper and lower bands. To calculate the Donchian levels, the indicator uses the Donchian Length parameter, which determines the period over which the highest high and lowest low are calculated. A longer Donchian Length captures a broader price range, while a shorter length focuses on more recent price action. By incorporating the Donchian calculations into the Multi-Band Breakout Indicator, traders gain an additional layer of confirmation for breakout signals.
Interpretation:
The Multi-Band Breakout Indicator offers valuable interpretation for traders. The upper and lower bands represent dynamic levels of resistance and support, respectively. These bands reflect the potential price range within which the asset is expected to trade. The trend line is the average of these bands and provides a central reference point for the overall trend. When the price moves above the upper band, it suggests a potential overbought condition and a higher probability of a pullback. Conversely, when the price falls below the lower band, it indicates a potential oversold condition and an increased likelihood of a bounce. The trend moving average further smooths the trend line, making it easier to identify the prevailing direction.
The crossover of the trend line (representing the average of the upper and lower bands) and the trend moving average holds a significant benefit for traders. This crossover serves as a powerful signal for potential trend changes and breakout opportunities in the market. When the trend line crosses above the trend moving average, it suggests a shift in momentum towards the upside, indicating a potential bullish trend. This provides traders with an early indication of a possible upward movement in prices. Conversely, when the trend line crosses below the trend moving average, it indicates a shift in momentum towards the downside, signaling a potential bearish trend. This crossover acts as an early warning for potential downward price movement. By identifying these crossovers, traders can capture the initial stages of a new trend, enabling them to enter trades at favorable entry points and potentially maximize their profit potential.
Breakout Signals:
For bullish breakouts, the indicator looks for a bullish crossover between the trend line and the trend moving average. This crossover suggests a shift in momentum towards the upside. Additionally, it checks if the current price has broken above the upper band and the previous Donchian high. This confirms that the price is surpassing a previous resistance level, indicating further upward movement.
For bearish breakouts, the indicator looks for a bearish crossunder between the trend line and the trend moving average. This crossunder indicates a shift in momentum towards the downside. It also checks if the current price has broken below the lower band and the previous Donchian low. This confirms that the price is breaking through a previous support level, signaling potential downward movement.
When a bullish or bearish breakout is detected, it suggests a potential trading opportunity. Traders may consider initiating positions in the direction of the breakout, anticipating further price movement in that direction. However, it's important to remember that breakouts alone do not guarantee a successful trade. Other factors, such as market conditions, volume, and confirmation from additional indicators, should be taken into account. Risk management techniques should also be implemented to manage potential losses.
Coloration:
The coloration in the Multi-Band Breakout Indicator is used to visually represent different aspects of the indicator and provide valuable insights to traders. Let's break down the coloration components:
-- Trend/Basis Color : The tColor variable determines the color of the bars based on the relationship between the trend line (trend) and the closing price (close), as well as the relationship between the trend line and the trend moving average (trendMA). If the trend line is above the closing price and the trend moving average is also above the closing price, the bars are colored fuchsia, indicating a potential bullish trend. If the trend line is below the closing price and the trend moving average is also below the closing price, the bars are colored lime, indicating a potential bearish trend. If neither of these conditions is met, the bars are colored yellow, representing a neutral or indecisive market condition.
-- Moving Average Color : The maColor variable determines the color of the filled area between the trend line and the trend moving average. If the trend line is above the trend moving average, the area is filled with a lime color with 70% opacity, indicating a potential bullish trend. Conversely, if the trend line is below the trend moving average, the area is filled with a fuchsia color with 70% opacity, indicating a potential bearish trend. This coloration helps traders visually identify the relationship between the trend line and the trend moving average.
-- highColor and lowColor : The highColor and lowColor variables determine the colors of the high Donchian band (hhigh) and the low Donchian band (llow), respectively. These bands represent dynamic levels of resistance and support. If the highest point in the previous Donchian period (hhigh) is above the upper band, the highColor is set to olive with 90% opacity, indicating a potential resistance level. On the other hand, if the lowest point in the previous Donchian period (llow) is below the lower band, the lowColor is set to red with 90% opacity, suggesting a potential support level. These colorations help traders quickly identify important price levels and assess their significance in relation to the bands.
By incorporating coloration, the Multi-Band Breakout Indicator provides visual cues to traders, making it easier to interpret the relationships between various components and assisting in identifying potential trend changes and breakout opportunities. Traders can use these color cues to quickly assess the prevailing market conditions and make informed trading decisions.
Adjusting Parameters:
The Multi-Band Breakout Indicator offers flexibility through parameter adjustments. Traders can customize the indicator based on their preferences and trading style. The length parameter controls the sensitivity to price changes, with higher values capturing longer-term trends, while lower values focus on shorter-term price movements. By adjusting the parameters, such as the ATR length, multiplier, Donchian length, and MA length, traders can customize the indicator to suit different timeframes and trading strategies. For shorter timeframes, smaller values for these parameters may be more suitable, while longer timeframes may require larger values.
Potential Applications:
The Multi-Band Breakout Indicator can be applied in various trading strategies. It helps identify potential breakout opportunities, allowing traders to enter trades in the direction of the breakout. Traders can use the indicator to initiate trades when the price moves above the upper band or below the lower band, confirming a potential breakout and providing a signal to enter a trade. Additionally, the indicator can be combined with other technical analysis tools, such as support and resistance levels, candlestick patterns, or trend indicators, to increase the probability of successful trades. By incorporating the Multi-Band Breakout Indicator into their trading approach, traders can gain a better understanding of market trends and capture potential profit opportunities.
Limitations:
While the Multi-Band Breakout Indicator is a useful tool, it has some limitations that traders should consider. The indicator performs best in trending markets where price movements are relatively strong and sustained. During ranging or choppy market conditions, the indicator may generate false signals, leading to potential losses. It is crucial to use the indicator in conjunction with other analysis techniques and risk management strategies to enhance its effectiveness. Additionally, traders should consider external factors such as market news, economic events, and overall market sentiment when interpreting the signals generated by the indicator.
By combining multiple bands and moving averages, this indicator offers valuable insights into the underlying trend and helps traders make informed trading decisions. With customization options and careful interpretation, this indicator can be a valuable addition to any trader's toolkit, assisting in identifying potential breakouts, capturing profitable trades, and enhancing overall trading performance.

Range H/L Buy and Sell SignalThe "Range H/L Buy and Sell Signal" indicator is designed to identify potential buy and sell signals based on a specified price range and market volatility. This indicator can be used in the TradingView platform to assist traders in making informed decisions.
The indicator allows customization of several parameters to adapt to different trading strategies. These parameters include the start and end times for the price range, the volatility threshold, and the desired breakout conditions.
To begin, the indicator calculates the range start and end timestamps based on the provided hours and minutes. This defines the time period within which the indicator will analyze price movements.
Next, the indicator determines the highest high (High) and lowest low (Low) within the specified price range. These levels represent the upper and lower boundaries of the range and act as potential breakout points.
Volatility is also taken into account to filter out false signals. The indicator calculates the true range and the average true range over a period of 14 bars. The true range measures the price range from the current high to low, while the average true range provides an indication of market volatility.
Based on the breakout conditions and the volatility threshold, buy and sell signals are generated. A buy signal occurs when the closing price crosses above the High and the true range is greater than the volatility threshold multiplied by the average true range. Conversely, a sell signal is triggered when the closing price crosses below the Low and the true range exceeds the volatility threshold multiplied by the average true range.
The indicator visually displays the High and Low levels as plotted lines on the chart. Additionally, it marks the buy signals with green labels labeled "BUY" below the corresponding bars and the sell signals with red labels labeled "SELL" above the bars.
It is important to note that this indicator should be used in conjunction with other technical analysis tools and indicators for comprehensive market analysis. Trading always carries risks, and it is crucial to exercise caution and conduct thorough analysis before making any trading decisions.
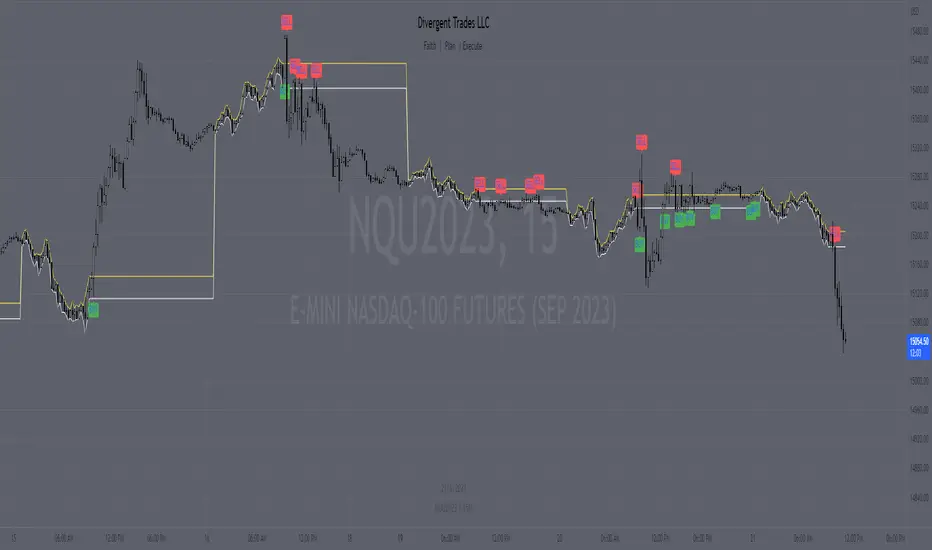
Divergent Trades LLC:
Disclaimer: The information provided by the Divergent Trades LLC indicator is for educational and informational purposes only. It should not be considered financial advice or a recommendation to buy, sell, or trade any financial instrument. Divergent Trades LLC is not responsible for any losses incurred as a result of using this indicator. Trading in the financial markets carries a high level of risk and may not be suitable for all investors. Before making any investment decisions, please consult with a financial advisor and do your own due diligence. Past performance is not indicative of future results. By using the Divergent Trades LLC indicator, you acknowledge that you have read and understand this disclaimer and agree to its terms and conditions.
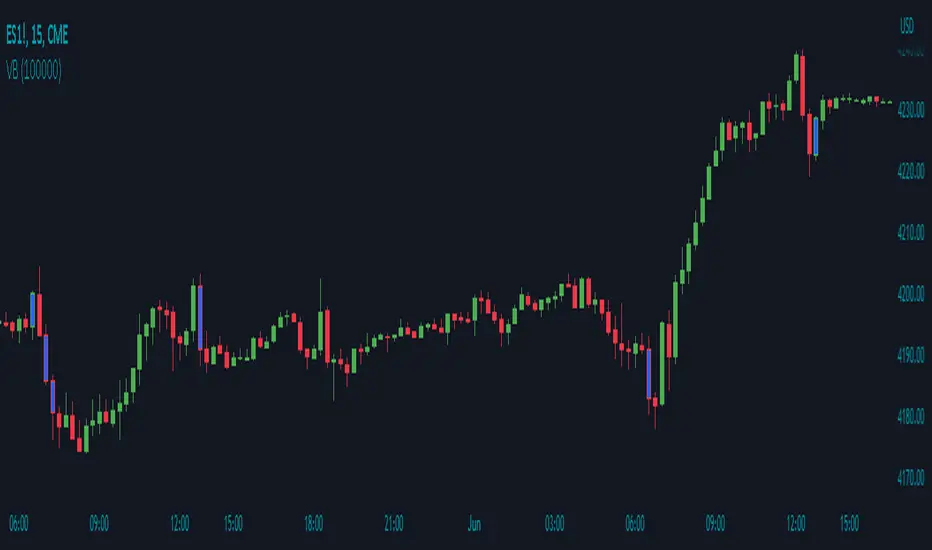
Volume Breakout by Chosen VolumeDescription:
The Volume Breakout indicator (VB) is a technical analysis tool that highlights candles with significant trading volume. It helps traders identify potential breakout periods characterized by high volume activity.
How it Works:
The Volume Breakout indicator compares the volume of each candle with a user-defined minimum volume threshold. If the volume of a candle exceeds or is equal to the specified minimum volume requirement, the indicator identifies it as a volume breakout and marks it accordingly.
Usage:
To effectively utilize the Volume Breakout indicator, follow these steps:
1. Apply the VB indicator to your chart by adding it from the available indicators.
2. Customize the minimum required volume parameter according to your trading preferences. This parameter determines the threshold volume level that a candle must meet or exceed to be considered a breakout candidate.
3. Observe the candles on the chart:
- Candles that meet or exceed the minimum required volume are highlighted with a specific color (yellow by default), indicating potential breakout periods.
4. Pay attention to the volume breakout indications within the candles, as they suggest periods of increased trading activity.
5. Analyze the price action accompanying the volume breakout candles. Breakouts often indicate a surge in buying or selling pressure, potentially leading to significant price moves or trend reversals.
6. Combine the analysis of volume breakout candles with other technical analysis tools, such as trend lines, support and resistance levels, or indicators, to confirm potential trade setups.
7. Implement appropriate risk management strategies, including setting stop-loss orders and position sizing, to manage your trades effectively and protect your capital.
Range DetectionThis is a simple indicator to find the sideways market or ranging market.
It is mainly focused on BTCUSD as BTCUSD doesn’t make big moves each and every candle. It makes big breakouts with one candle and then goes sideways for a longer period of time.
So, this indicator identifies those big candles and plots high and lows of those big candles using lines. New range is created only when new candles close above or below previous major candles high or low.
Relative Price Volume
Relative Price Volume is an indicator which shows anomalies between price and volume on a chart over a given period. The goal is to identify potential reversal and/consolidation areas for price as it relates to volume. It is a simple variation of a Volume at Price indicators. It can also be used to mark potential support and resistance lines on the chart as the areas it signals is where the price battles are waged.
Settings:
Period = length for which to calculate average candle body and average volume
Long Factor = relative size multiplier to determine if a candle is larger than average or if volume is higher than average
Short Factor = relative size multiplier to determine if a candle is smaller than average or if volume is lower than average
Anomaly Conditions
1. If a candle is larger than average and volume is lower than average, then this is an anomaly, and we should be on alert for a change in momentum.
2. if a candle is smaller than average and volume is higher than average, then this too is an anomaly and should put us on alert.
The indicator will draw a cross on the chart indicating the candle is that is flashing the warning that the run is done and a potential consolidation and/or reversal is pending. Used in conjunction with support and resistance levels this could signal a time to enter or exit a trade.
The default size factors considers a candle or volume:
1. Larger than average if it is 60% or more (.6) larger than average.
2. Smaller than average if it is 40% or less (.4) smaller than average.
Hope this helps! Happy trading!
SBS AlgoHello traders, I am here again with a new and improved indicator.
This indicator is based on a pivot breakout algorithm which gives buy and sell signals according to the breakout of trendline. This is an advanced version of another script. It also takes price action into consideration along with some basic indicators like MACD and ADX to give good entry signals.
NOTE: This indicator is not designed to take entries completely based on signals it gives. Please use it along with your trading strategy to add more confluence to your trading system and maximize your profits.
I hope you guys will like this one too .Enjoy 👍
In case you find any bug, please do report in comment section .Thank you.

Pivot BreaksThere are built-in and published Pivot Point High Low indicators in Public Library. As far as I see none of them show the breaking candles or the trend.
with the closing price crossing over the previous / current pivot high A bearish breakOut can either indicate the progression of a lower high pattern or a trend reversal
with the closing price crossing under the previous / current pivot low A bullish breakOut can either indicate the progression of a higher low pattern or a trend reversal
This indicator can show the first breaking candle or all breaking candles . It Can also show The Breaking state (Trend) based on the last break.
Alert Mode is included, colour can be customised, Higher TimeFrame can be requested (it Can also cause repainting)
Inputs are optional as possible so have fun with it
Disclaimer: Scripts that I post publicly are experimental. They are not financial advices. Always backtest your ideas using your own methodologies.
MM Chop Filter Range BoxesMatch with the MM Chop Filter
This draw Non repainting range boxes when the oscillator see a range.
-Breakout Buy/Sell Signals and Exit signals when prices enters a range just in case you did get into a trade. .
-Alarms to match the signals
How to use
Match with the oscillator and always trade the trend with your strategy confirmation and the breakout this indicator provides

Smarter SNR (Support and Ressistance, Trendline, MTF OSC)Built with love "Smarter SNR (Support and Ressistance, Trendline, MTF OSC) "
This indiator will show you Support & Ressistance, Good Trendline, and Multi-timeframe analyzing of Oscillator (Stochastic and RSI)
You can combine with your own strategy, or use this purely
DISCLAIMER :
Measure the risk first before use it in real market
Backtest The Strategy was very important, so you know the probability
Fundamentally Logical :
SNR -> Last 3 Zigzag Pivot
Trendline -> Using two last pivot for calculating the slope
Features :
1. SNR
2. Trendline
3. MTF Oscillator Analyzing
How to use it :
1. All Label, Table & Line can be turned on/off in settings
2. Pivot Period can be Adjusted in settings
3. All Label, Table & Line style can be adjusted in settings
Regards,
Hanabil

Range BreakoutThis indicator makes easy to identify a range breakout in both the direction
Expected input is number of days that we should expect the range to be in
