Bitfinex Longs vs Shorts [R1984]TradingView Pine script to compare open Bitfinex BTCUSD long versus short positions.
This indicator compares open BTCUSD Bitfinex long versus short positions.
Features
Switch between total position and percent comparison.
Configurable gradient shading (useful with total position comparison).
Btc!

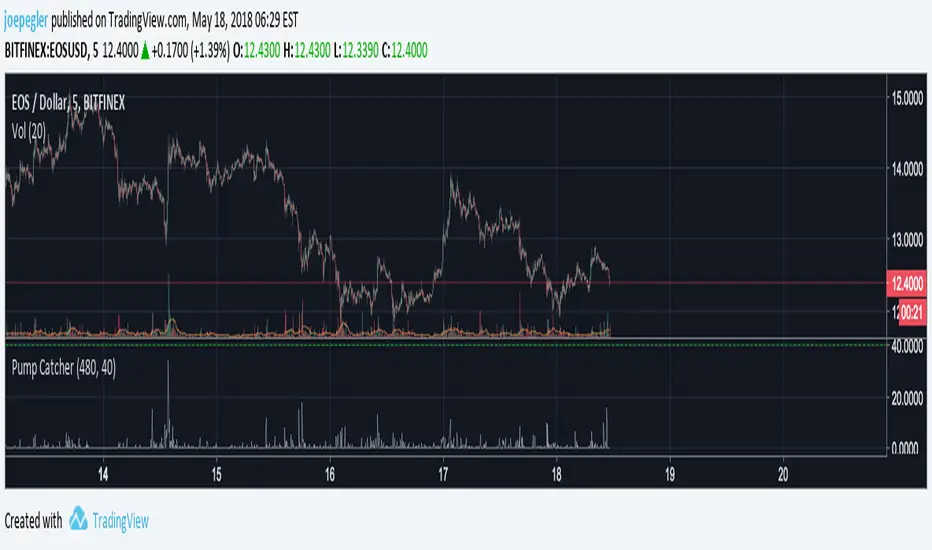
Pump CatcherThis indicator attempts to detect moments of abnormal and accelerating increase in volume. Because pumps happen over short time frames, this script is potentially better used on smaller timeframes (1 - 15 minutes). It takes two inputs: The length of the lookback for the volume rate of change (vroc) calculation (default=20), and The threshold over which a pump is determined to have happened (0-100, default=50). The vroc has been normalised to a result between 0 (no rate of change) and 100 (maximum rate of change the asset has ever undergone to date).

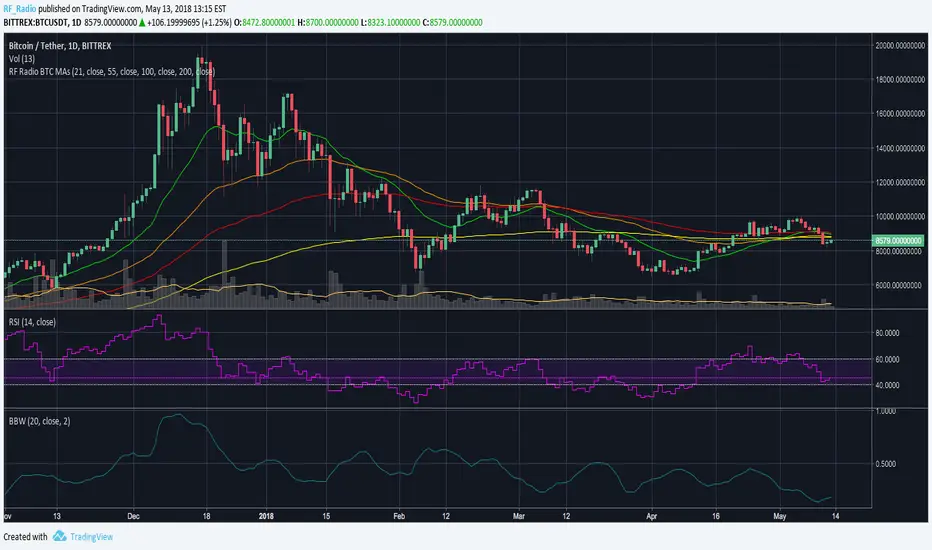
RF Radio BTC MAsThis script is intended to be used as a daily candle analysis of the BTC/USD price. It includes 3 EMAs, defaulted to the 21-day, 55-day, and 100-day EMAs respectively. It also includes the 200-day SMMA, a traditional indicator used to determine whether BTC is in a bear or bull market. Feel free to change the periods as you will, but at least now you have a simple solution for putting 4 moving averages on a chart at the same time with 1 indicator. Happy Trading!
-- RF Radio
BTC Mass profit alarmThis is a modified version of my "BTC Mass profit" strategy so that you can add alerts when a signal is produced

DepthHouse BTC Momentum Oscillator [BTC MO]NOTE: Only Works on BTC.
All testing was done on 1hr Timeframe
This is a experimental indicator - use at your own risk.
DepthHouse BTC Momentum Oscillator is an advanced tool to help determine Bitcoin Market Momentum.
---BTC MO SIgnals---
Signal Line: Generally, if the Signal Line is greater than 0, then there is more bullish momentum in the market
Tops & Bottoms: Signals used to help spot where BTC momentum may have topped or bottomed out
Possible Divergences: Used to help spot possible reversals on continuous trends
---oh92's Preset Setting---
Scalper: (20,11,17,6) Very reactive settings that I use while day trading. However, faster settings generally increase the chance of false signals(20,11,17,6)
Swing Trader: (5,25,55,10) Greatly reduces noise for my longer time trades. Generally makes 'tops' and 'bottoms' more accurate. Which can be a huge advantsge in spoting an earnly trend reversal
Custom: Allows user adjustments of all settings
---Built-in-Alerts---
Tops
Bottoms
Bearish Divergences
Bullish Divergences
Signal Line Crossovers
Try this indicator for FREE! Just leave a comment, or feel free to send me a PM

bitFlyer BTCJPY, Currency Converted [NeoButane]Utilizes FX index. Currency can be converted to your choice.

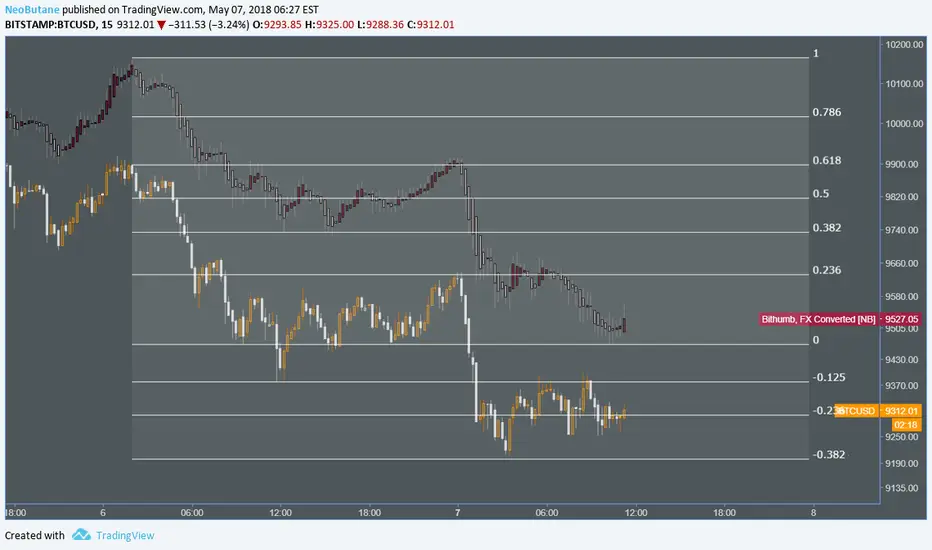
Bithumb BTCKRW, FX Converted [NeoButane]Uses live FX index. Index can be changed to your preferred currency.
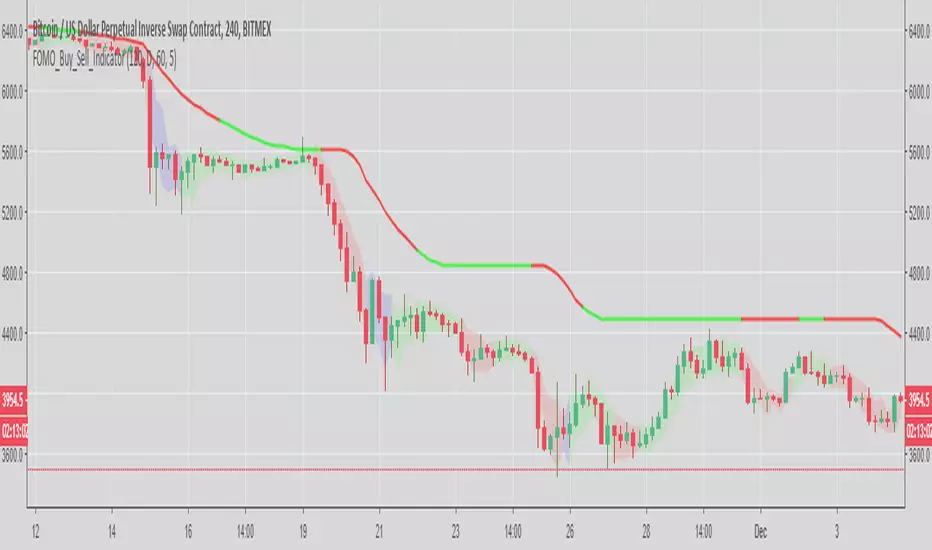
FOMO_Buy_Sell_IndicatorBuy and sell indicator that fits everyone's needs.
For noobs - You can use it even if you are not TA friendly. Green is buy and Red is sell.
For pros - It helps you second guess your ins and outs.
PM to gain access, please. Thanks
Cryptopeep RSI, Stochastic RSI, Stochastic and Williams %R, 4in14 Charts all in one chart, RSI, Stochastic RSI, Stochastic and Williams %R
Hope you like, please let me know your thoughts.
If you would like to be kept up to date please FOLLOW us and try our indicators and strategies here: uk.tradingview.com
If you like it please click the LIKE button.

CryptoPeep Candle Rule studyHere is the Study version of the CryptoPeep Candle Rule Strategy with Long and Short alerts but does not have the stop loss feature.
Please let me know your thoughts.
If you would like to be kept up to date please FOLLOW us and try our indicators and strategies here: uk.tradingview.com
This strategy is invite only. Please request an invite in comments below and if you like it please click the LIKE button.

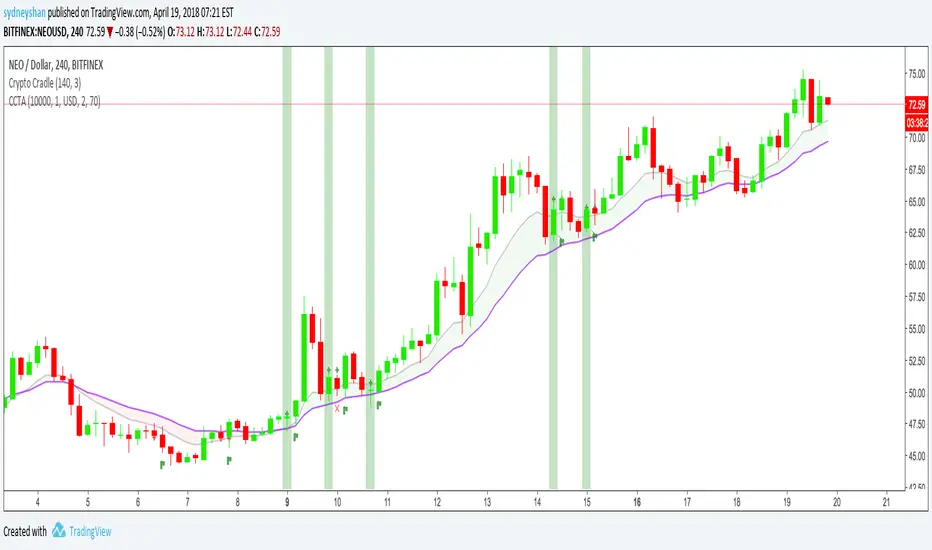
Crypto Cradle Trade AssistantThis indicator compliments the Crypto Cradle indicator by providing your entry, stop, 1:1 scale-out price, trade amount, and potential profit based on your target and scale-out strategy.
1. Ensure you have added the Crypto Cradle and Crypto Cradle Trade Assistant indicators to your chart
2. Click the cog icon to configure this indicator
3. Enter in your account balance and the % you are willing to risk on this trade (default: 1%).
3. Set your target price
4. Tweak the Trade Pair and Precision (Decimals) if required (USD/USDT only BTC & ETH coming soon)
5. Click on the 'Data Window' icon on the right-hand side of the screen and scroll down to CCTA
6. Hover over a highlighted crypto cradle candle (green for long, red for short) and a series of values will appear
Entry price
Stop price
1:1 scale out price
Amount to buy/sell (ie NEO)
Amount in traded currency (ie USD)
Target price (that you set)
Profit based on selling 50% of your bought amount when your reward equals your risk (1:1 scale-out)
Profit based on risking 1% of your portfolio
For more about the Crypto Cradle strategy, visit www.tradercobb.com
BTC longs vs shorts ratioThis is a simple script showing long / short ratio for BTC using Bitfinex exchange data.

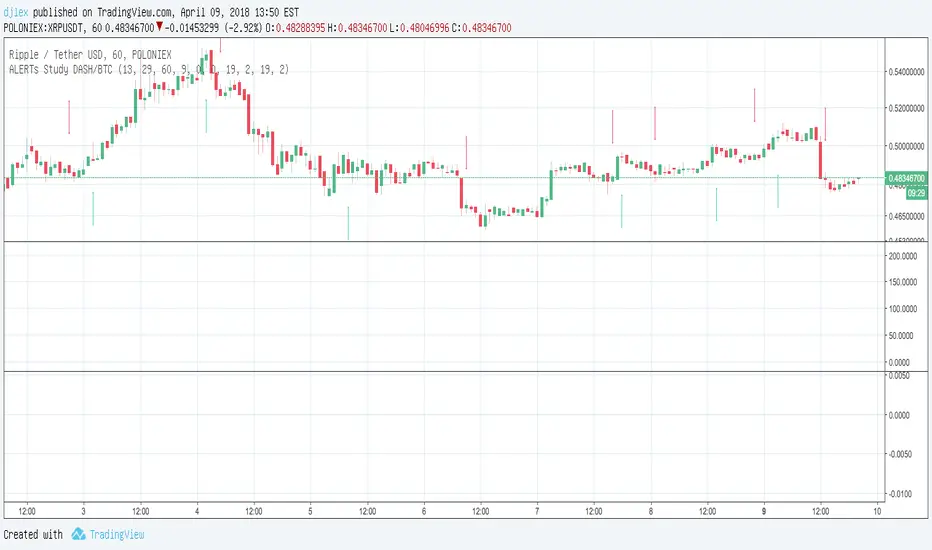
MACD Study DASH/BTC 3H ALERTS for AutoviewAutoview qualified Study Script Alerts for Autoview
Please Set Up Alert 1x Bars Close
For Margin Trading (Poloniex)
ULTIMATE PINE INJECTOR V1.2 INSERT
MACD Created by user ChrisMoody
NO REPAINT
With Stopp Loss and Trailing Stopp and Backtest
Now is for Free for all !
WeTrade. Trend Alerts 2.0
Данные сигналы были созданы для понимания начала и разворота тренда. Не забывайте правило: The trend is your friend. Стрелки НЕ ПЕРЕРИСОВЫВАЮТСЯ. Как и большинство индикаторов, данный нуждается в поддержке тех. анализом и строгом алгоритме торговле. Используется для маржинальной торговли на криптовалютных парах BTC/USD, ETH/BTC 5.24% , ADA/BTC, BCH/BTC, LTC/BTC, а так же на валютных парах EUR/USD, GBP/USD. НЕ (!) используйте индикатор на инструментах, в которых идёт жёсткий флэт и сильные pump and dump. Такие монеты были созданы не для движения по тренду! А для использования робота и накачки!
Торговля по системе идёт со строгим управлением капиталом.
Советую использовать стратегию Мартингейла. Увеличивать позиции не более чем на 40%. С кредитным плечом до X10. Контролируйте свои риски. В этом главный успех.
Всем большого дохода!
------------------------------------------------------------------------------------------------------------------------------------
This alerts is created to understand the beginning and the reversal of the trend. Do not forget the rule: The trend is your friend. The arrows do not re-painting! Like most indicators, this one needs the support of technical analysis and strict algorithm of trade. Used for margin trading on BTC 0.97% / USD, ETH / BTC 0.97% , ADA / BTC 0.97% , BCH / BTC 0.97% , LTC / BTC 0.97% , and also in currency pairs like EUR/USD -0.05% , GBP/USD 0.10% . DO NOT (!) Use the indicator on tools, in which there is a rigid flat and strong pump and dump. Such coins were not created for movement on the trend! They are created for using a robot and pumping!
Trade in the system goes with strict management of capital.
Write comments, I will answer your questions.
Thank you.

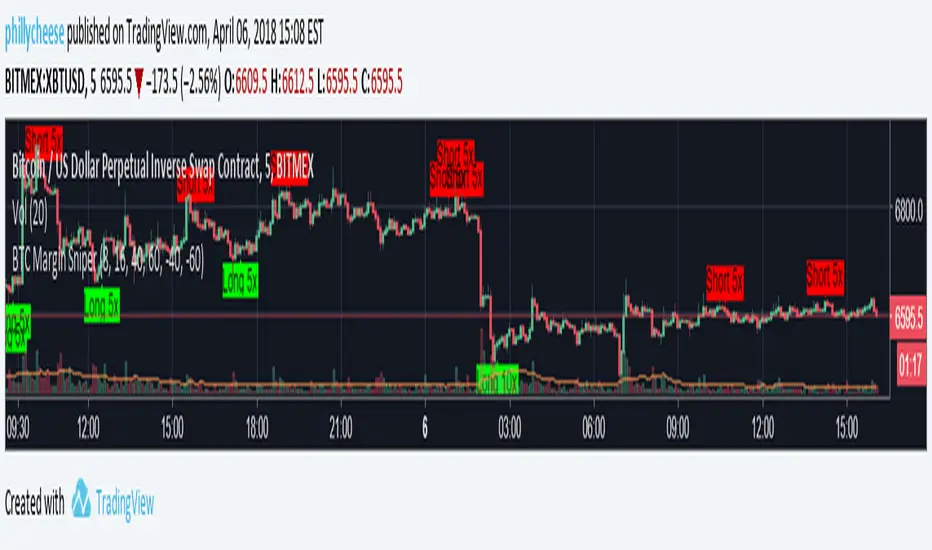
BTC Margin Sniper w/ AlertsMargin Sniper uses 2 levels for overbought and oversold to overlay possible trades on the chart. You can adjust its sensitivity by either increasing or decreasing the overbought and oversold threshold numbers. It must meet one of these levels and the short-term trend has to change direction for it to create the alert and entry on the overlay.
Increasing the overbought input makes the trigger more precise, but it may not trigger as often. Decreasing the oversold input will do the same for that trigger.
You can adjust the alerts and the overlaid position suggestions to match your preferred leverage amount.
To set an alert, click "add alert", then select this script. Choose one of the oversold or overbought alerts and enter your message.
I primarily use this on BitMEX with BTC, but you can use it with other exchanges and coins. You may have to adjust the inputs depending on the coin and the timeframe you use. Do not blindly follow this to make purchases. This is just an alert system to notify you of possible trades.
Spreads + MA + Bollinger Bands [USDBRL] Crypto
Cryptocurrency adoption is on a constant upward trajectory. The interest for trading 'crypto assets' could not stay anywhere behind. The amateur nature of the market together with huge 'price inefficiencies' is always giving rise to excellent arbitrage opportunities throughout the globe. This code aims to help traders to make money placing safe and profitable trades which will eventually help the community to move towards more efficient price discovery.
The script combines up to three assets to be monitored at the same time. It also allows the trader to plot Simple or Exponential Moving Averages and Bollinger Bands (BB) for each asset he wants to trade.
Instructions:
* International/local -- it allows the trader to switch between international spreads and local (currency) spreads, considering the market he is targeting. The default value is international. Unchecking the field will set the script for local trades.
* Fees -- enables one to add his effective operational cost directly on the chart. This feature might be potentially relevant for traders who engage with fast-moving markets which demands action to be taken right away. The logic for calculations when fees are in place is the following (fee ≠ 0): if (spread > 0), then (spread - fee). If (spread < 0), then (spread + fee). When the spread is too short, the code may plot somewhat weird charts. In this case, it might be interesting to keep fee = 0.
* Standard/ Absolute BB -- it changes from standard Bollinger Bands (default value) to absolute Bollinger Bands . The standard version calculates the bands over the moving average. The absolute version calculates each band in isolation taking absolute values as arguments. Play with the two options (and deviation) to see which is better regarding your market and the instrument of your choice. Uncheck the field to get the absolute version. Feedback on this point is particularly appreciated.
* Expon. Ma -- it switches everything from Simple Moving Averages ( SMA ) to Exponential Moving Averages ( EMA ). Default value: SMA .
I hope you guys manage to make money using the script. And if you do, feel free to show your appreciation. Any amount is welcome! Let's take advantage of what crypto enabled us.
Tips : =>
BTC: 33RUY4AXBEL89gEsoqDpXRgvdZWePhLrqc
LTC: M9mBqVhxWNuZuCPEsrRtH3ygxNYnCdMEki
LTC: 36btZsgNxqiPibag6quTEtdX367wXskUnJ (old format)
ETH: 0x1D3E1701F1A0C379e7Fcb60BADBcd14AcE8160c4
DASH: XnKHHcmhZmR2SAqavP1x6FbEBrqTYa4kTk
If you want to use the script, please, let me know leaving a comment below.
Trade wisely and good luck out there.
Spreads + MA + Bollinger BandsCryptocurrency adoption is on a constant upward trajectory. The interest for trading 'crypto assets' could not stay anywhere behind. The amateur nature of the market together with huge 'price inefficiencies' is always giving rise to excellent arbitrage opportunities throughout the globe. This code aims to help traders to make money placing safe and profitable trades which will eventually help the community to move towards more efficient price discovery.
The script combines up to three assets to be monitored at the same time. It also allows the trader to plot Simple or Exponential Moving Averages and Bollinger Bands (BB) for each asset he wants to trade.
Instructions:
* International/local -- it allows the trader to switch between international spreads and local (currency) spreads, considering the market he is targeting. The default value is international. Unchecking the field will set the script for local trades.
* Fees -- enables one to add his effective operational cost directly on the chart. This feature might be potentially relevant for traders who engage with fast-moving markets which demands action to be taken right away. The logic for calculations when fees are in place is the following (fee ≠ 0): if (spread > 0), then (spread - fee). If (spread < 0), then (spread + fee). When the spread is too short, the code may plot somewhat weird charts. In this case, it might be interesting to keep fee = 0.
* Standard/ Absolute BB -- it changes from standard Bollinger Bands (default value) to absolute Bollinger Bands. The standard version calculates the bands over the moving average. The absolute version calculates each band in isolation taking absolute values as arguments. Play with the two options (and deviation) to see which is better regarding your market and the instrument of your choice. Uncheck the field to get the absolute version. Feedback on this point is particularly appreciated.
* Expon. Ma -- it switches everything from Simple Moving Averages (SMA) to Exponential Moving Averages (EMA). Default value: SMA.
I hope you guys manage to make money using the script. And if you do, feel free to show your appreciation. Any amount is welcome! Let's take advantage of what crypto enabled us.
Tips : =>
BTC: 33RUY4AXBEL89gEsoqDpXRgvdZWePhLrqc
LTC: M9mBqVhxWNuZuCPEsrRtH3ygxNYnCdMEki
LTC: 36btZsgNxqiPibag6quTEtdX367wXskUnJ (old format)
ETH: 0x1D3E1701F1A0C379e7Fcb60BADBcd14AcE8160c4
DASH: XnKHHcmhZmR2SAqavP1x6FbEBrqTYa4kTk
If you want to use the script, please, let me know leaving a comment below.
Trade wisely and good luck out there.
% Δ, BTC Futures vs. BTC Spot By @Cipher_ScienceAlternative Version to my previous script:
I had fellow traders ask for a delta% version instead of using the delta$!
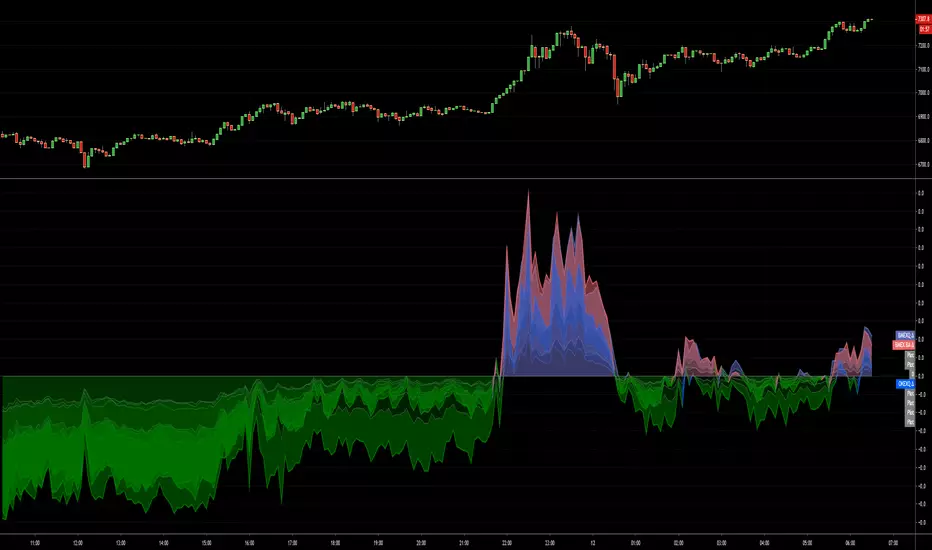
BTC World Volume (Multi-Exchange)Release: 2018-03-29
__________________________
WHAT IT DOES
Bitcoin is listed on multiple exchanges. Many people have called for a single global index that would quote BTC volume across all exchanges: this script is such a virtual volume aggregate of the 17 largest fiat exchanges on TradingView (listed in the script comments, and in Format > Inputs for you to select). It includes USD, EUR, JPY, KRW and USDT sources.
It will, independently for each tick, quote the volume from all selected exchanges and display a stacked representation, freely inspired from CoinMarketCap charts; also a Moving Average. Each fiat/continent has its own general color, to be able to quickly glance at where volume is coming from, e.g. BitMEX or Asia. (colors are based on Google's Material Design).
By default:
Grey: BitMEX
Green: USD
Yellow: Tether (USDT)
Red: Asia (JPY, KRW)
Blue: Europe (EUR)
No more "on Coinbase this" or "on Bitstamp that", you've now got a global overview! It becomes easy to debunk a few common myths.
See CoinMarketCap for reference.
Note: Bitmex is not taken into account in CoinMarketCap (afaik) since it's trading a derivative asset (XBTUSD contracts), but it usually amounts to ~50% of the overall BTC volume in USD value. The 16 other exchanges quote their volume in BTC, and they represent 30~40% of the overall BTC volume. I believe the whole is good enough to smooth out exchanges variations, and get a fair representation of real-time activity.
__________________________
HOW TO USE IT
Just add it to your chart, it will appear as a separate indicator. By default, it appears as stacked colored "areas". There is also a total volume Histogram, which is transparent by default: you can tweak that in Format > Style.
The darker and lighter backgrounds are respectively indicative of a downward price candle (open > close), or an upward price candle (close > open). They are unrelated to volume and simply help interpreting the indicator.
You can check/uncheck exchanges in the Format > Inputs tab to remove/add some of them from computation. All are enabled by default.
You can check/uncheck exchanges in the Format > Style tab to hide them (usually you would hide all or none).
You can edit colors and transpareny as well for each exchange.
You can edit "Volume histogram" transparency to have it show (it's a simpler representation than areas).
Moving Average: You can select the type (SMA, EMA, DEMA or TEMA) and length.
__________________________
Please leave feedback below or pm me directly for bugs and suggestions.

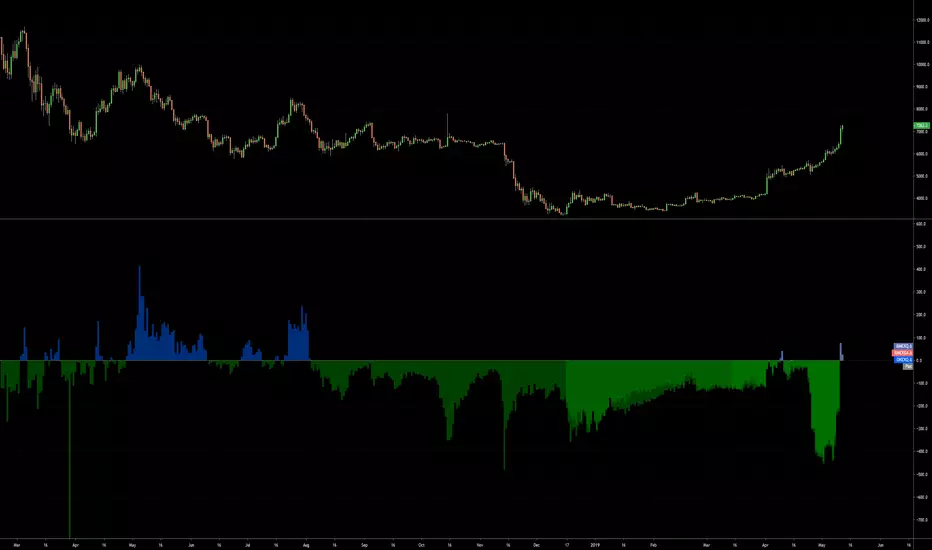
Combined BTC Futures vs. Spot {C_S}I built a baseline histogram chart that allows you to quickly view OKEX, BITMEX Quarts, and BITMEX Bi-Annuals versus spot. Colors are all editable, and you can change to area/line if youd like!
Let me know if you have any questions or suggestions!
Rainbow RoadRainbow Road allows you to visualise the price in relation to the barriers of support and resistance that are the moving averages. The price can be observed breaking above barriers , or falling below them.
Rainbow Road displays these bands like a ribbon so that the strength or weakness of a security such as Bitcoin, can be observed in a very vibrant and obvious fashion.
The name "Rainbow Road" is inspired by the final course of the Special Cup featured in all Mario Kart games and is the climactic course of each game it appears.
.,-'"*.,-'"*Housekeeping*"'-,.*"'-,.
In order for you to make your chart look exactly like this one when you apply the Rainbow Road indicator, you will need to follow these simple steps.
1. Right click on your chart -> Price Scale -> Undo Indicator Labels
2. Right click on your chart -> Price Scale -> Undo Indicator Last Value
3. Right click on your chart -> Color Theme -> Black
4. Right click on your chart -> Properties -> Background -> Vert Grid Lines -> Slide transparency bar -> Horz Grid Lines -> Slide transparency bar
@#$%@#$%@#$%@#$%@#$%@#$%@#$%@#$%@#$%@#$%@#$%@#$%@#$%@#$%@#$%@#$%@#$%@#$%@#$%@#$%@%
I appreciate the feedback of all of my followers!
Like and follow for more awesome indicators!
