BTC<>USDT calculator [mado]it's Calculator for Altcoin Arbitrage
need to input current price(XXX/btc and XXX/usdt) on config
default calculate BINANCE:BTCUSDT (based price)
red price USDT(cent)
green price BTC(sat)
BTCUSDT

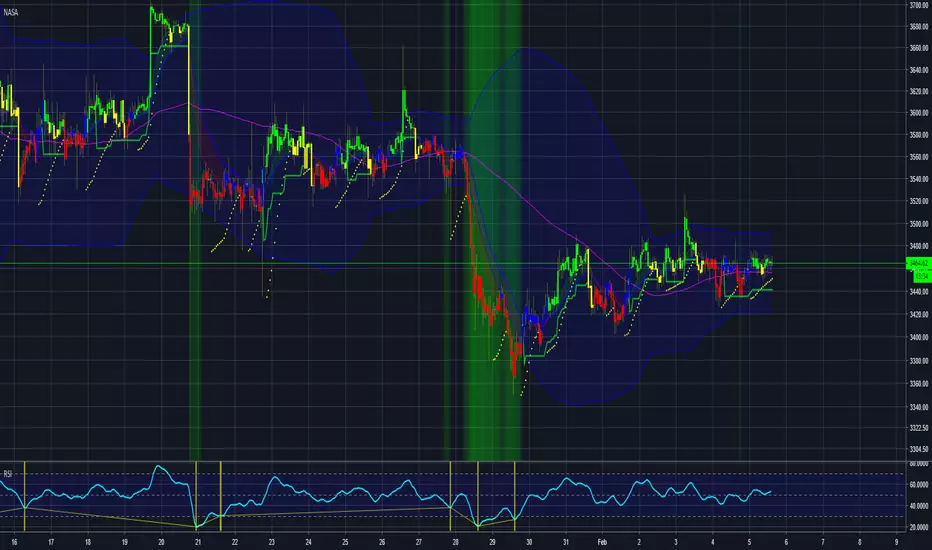
2019- BITCOIN - BTFD -BANDS-60minAs long as BTC is in this uptrend,
We have identified the BTFD bands.
They are on the chart and part of this indicator.
When the Dip happens, turn on this indicator,
Use it on the hourly chart.
BTFD will appear when price is rejected by our BTFD Band.
This strategy indicator has worked since the beginning of BTC bullish turn in February
This indicator is set to expire in December 2019
ONCE BTC closes below our Green line on the hourly, this strategy can be deemed DEAD!
Thanks, BTFD Safely
Like this indicator?
Join our Discord, link in my Bio!

Bitwise Spot Volume Index (@BTC_JackSparrow) [v2019-03-23]Following Bitwise's research on the legitimacy of volume on spot exchanges, they reported 95% of the Bitcoin market volume is fake.
According to the report 10 exchanges showed trustworthy regulated spot volume. Having accurate reporting of volume is important and therefore I have made this indicator that combines all 23 pairs listed on the exchanges mentioned by Bitwise that are available on TradingView.
The volume listed in this indicator could be used as a reference for true volume and therefore is an important addition to your trading toolkit and should more or less represent the data found on this page, released by Bitwise: www.bitcointradevolume.com
If you like this, give me a follow on TradingView and Twitter (@BTC_JackSparrow : twitter.com).
NOTE: as this indicator needs to pull a lot of data, it might take a moment to load!
How To Read?!
Volume is printed as the sum of all Bitcoins traded on the listed exchanges.
Trade safely!

BTC-USD Strategy ScriptThis is great script, and very profitable indicator. You can see it your self, how good it is... On, 15m, 4h, it is great!

CCI Highlighted & Divergence Signals [CryptoProSignal]>> This is the updated version of my previous ' CCI Highlighted ' indicator/oscillator (checkout in my previous published scripts) .
> > Whats new :
> This version of CCI highlighted has integrated divergence signals to spot various divergences on any timeframe which ultimately saves your time rather than
spotting divergences by manual analysis. Thus making it CCI Highlighted & Divergence Signals indicator/oscillator.
> By default it is optimised to give you divergence signal whenever CCI Length1 is above 100 or below -100 but you can always enable all divergences in
setting/format by simple check/uncheck.
> Tag reference in indicator/oscillator :
* Tag "R" refers to Regular divergence.
* Tag "H" refers to Hidden divergence.
----------------------------------------------------------------------------------------------------------------------------------------------------------------------
----------------------------------------------------------------------------------------------------------------------------------------------------------------------
***Below is the description copy pasted from my previous version of CCI Highlighted for remaining functionality of this updated indicator/oscillator.***
>> This script is purely based on Commodity Channel Index ( CCI ) with multiple CCI instances being used within one oscillator.
>> User can use as much as 5 CCI instances/plot within one oscillator.
> How to use :
1. When Bullish :
Whenever CCI length 14 crosses above -100(negative 100) that means bullish momentum is supported.
Best bullish/long entry would be when CCI length 14 crosses above -100(negative 100) as mentioned above and at the same time CCI length
200 is bouncing on top of +100(positive 100).
2. When Bearish :
Whenever CCI length 14 crosses below +100(positive 100) that means bearish momentum is supported .
Best bearish/short entry would be when CCI length 14 crosses below +100(positive 100) as mentioned above and at the same time CCI length
200 is bouncing at bottom of -100(negative 100) .
> Color Clarity :
a. Bullish support is highlighted GREEN and bearish support is highlighted RED within the oscillator background with respect to
Length 1 (i.e 14 by default) .
b. PURPLE is highhighted when Length 5(i.e 200 by default) is bouncing either on top of +100(for bullish ) or at bottom of -100(for bearish ).
c. AQUA is highlighted when Length 3(i.e 50 by default) is bouncing on top or at bottom of 0 from either side respectively.
d. Best entry in both cases i.e bullish or bearish as mentioned above('How to use') is highlighted WHITE by default.
> Tip:
Just observe the color outputs on any timeframe in a chart as it works fractally on every timeframe , it will help you understand better with
clarity.
> You are always free to experiment with the CCI lengths, change highlighted color and hide/unhide the Lengths as per your requirements in
setting/format .

Aggregated Volume BTCAggregates the Bitcoin volume from multiple exchanges into a single indicator.
# Exchanges and Pairs
Included are only exchanges supported by TradingView:
* Binance
* Bitstamp
* Bittrex
* Coinbase
* Gemini
* itBit
* Bitfinex
* Kraken
* Poloniex
* HitBTC
* OKCoin
* BitMEX
Excluded low volume exchanges (not in CMC Top):
* CEX.IO
* Coinfloor
Excluded low volume pairs (not in CMC Top):
* KRAKEN:XBTCAD, COINBASE:BTCUSDC, ITBIT:BTCEUR, ITBIT:BTCSGD, BITFINEX:BTCJPY, BITFINEX:BTCGBP, POLONIEX:BTCUSDC, OKCOIN:BTCUSD, OKCOIN:BTCCNY
Many other top exchanges are not included, because they are not supported by TradingView.
# Inputs
By default the spot exchanges are selected. You can select also the other margin trading and derivatives exchanges.
# Contribute
Feel free to share any ideas and issues you have.
# Open Source
The code is open source @ github.com and uses the commonpine library github.com

BTCUSD - 4H - Cyatophilum Golden X - RSI [BACKTEST]This indicator is a custom combo of Ema crosses, RSI divergences and Support/resistance , engineered to make the most profit possible.
ABOUT THE STRATEGY
The Net Profit (Gross profit - Gross loss) is calculated with a commission of 0.05% on each order.
Each trade is made with 1 BTC : The backtest buys 1 BTC and sells 1 BTC.
If you decided to Short or Long, profits can be higher, but trade at your own risk.
To use this strategy on a ALT/BTC market (for trading altcoins), change the default Order Size from 1 Contract to 100% of Equity.
There are two kind of buy signals : Green and Blue triangles, that are two great Buy/Long entries.
There are also two kind of sell signals: Red and Orange triangles, that are two great Sell/Short entries.
The indicator comes with automatic Alerts that trigger on Green and Blue triangles for a Buy Alert, or that trigger on Red and Orange triangles for a Sell Alert.
If you are interested in purchasing the indicator and want to try it, then please leave a comment.
An alert setup indicator version is available on my profile.
-----------------------------------------------------------------------------------------
I am also available for PineScript Development and Reverse Engineering.
Join my discord:
discord.gg

soham the scalperMultiple Ema you can use this is for scalp in any timeframe you want.
and also you can this ema with "laguerre based-rsi" so you can find clear buy and sell signals.
if you want beauty on chart then go with Guppy ema xD
if you guys need access just Dm me its free..
Dimdicator v1.0 - NO REPAINT - Result: %80.72(4h)Access
48H Trial Period By Request. Full Access is $50(LTC, ETH, BTC...)
No repaint!
Best time interval: 4 hour
"It works very good in BTC/USD"
Please use Heikin Ashi candles!!! Its important!!!

1min_&15min_Crypto_indicatorDear Crypto Community,
on
I set for my thesis a crypto indicator for 15 minutes mostly. It's work at 87 % on BTCUSD & BCH
easy to use:
Green to Short
Purpule to Buy
Autoview Bot BTC/USD Strategy(NO REPAINT)Access
48H Trial Period By Request. Full Access is $100(LTC, ETH, BTC...)
No repaint!
Best time interval: 270 minutes or 4 hour
"It works very good in BTC/USD"
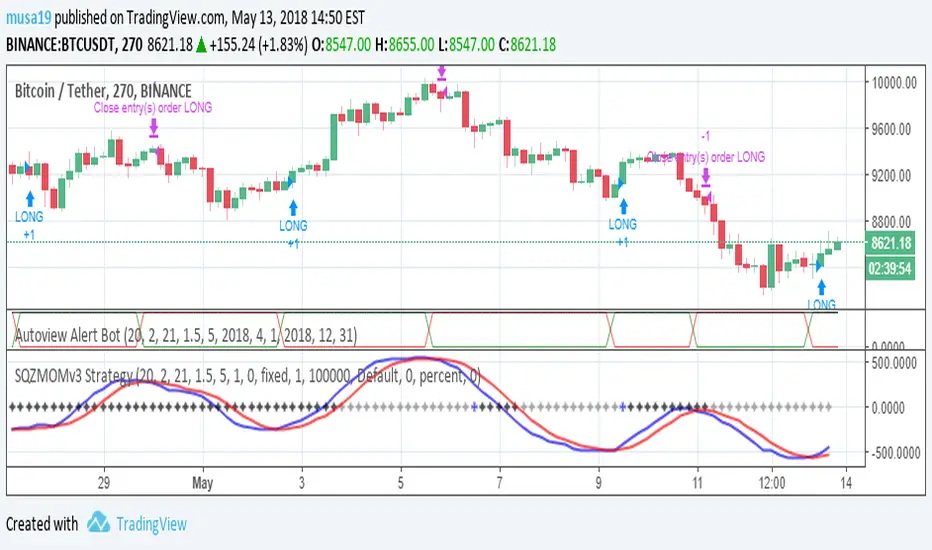
Squeeze Momentum Autoview Bot BTC/USD Strategy(NO REPAINT)Access
48H Trial Period By Request. Full Access is $100(LTC, ETH, BTC...)
No repaint!
Best time interval: 270 minutes or 4 hour
"It works very good in BTC/USD"
Crypto MoneyMagnet By Safdar Abbas LongStrategy works for 1h, 2h and 4hour , results are upto 80% success ratio
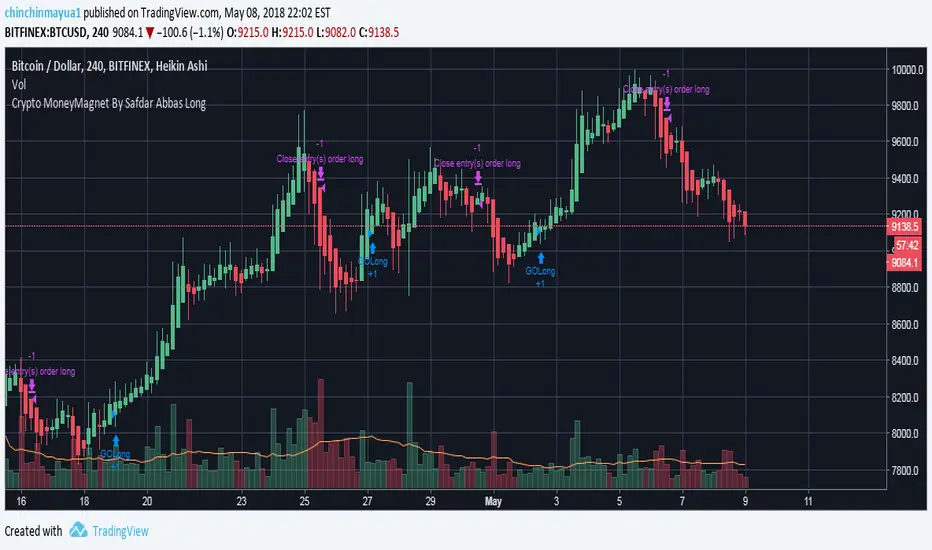
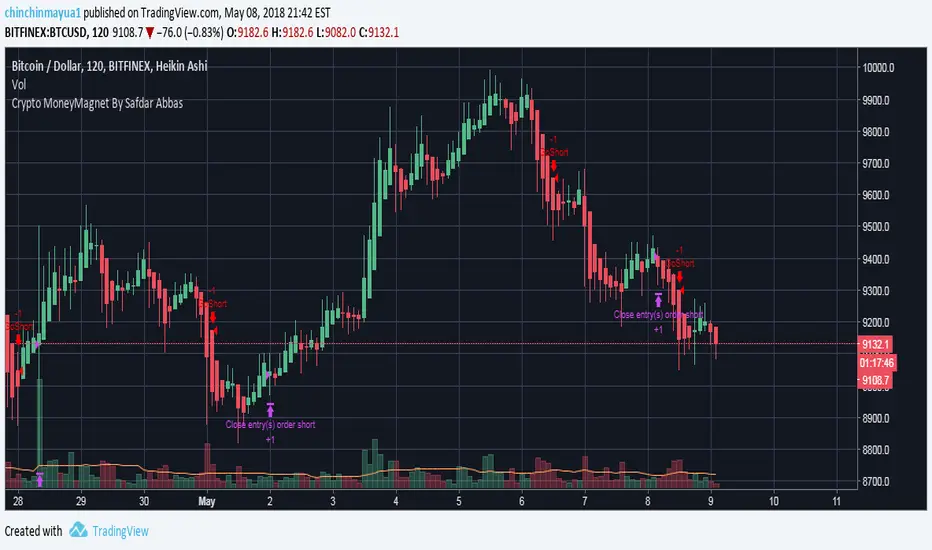
Crypto MoneyMagnet By Safdar Abbas For Short Trades 70% Success Strategy works good in 1h, 2h and 4h for btc , only for short trades .
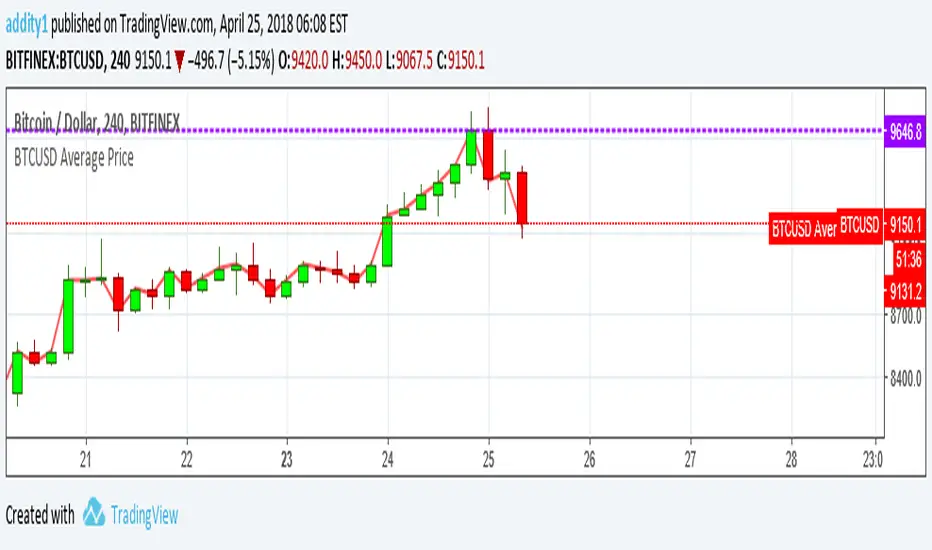
BTCUSD (Volume Based Average Price)This script shows volume based price of BTCUSD (Bitfinex %44, Binance %31, Bitstamp %13, Coinbase %8, Hitbtc %4)
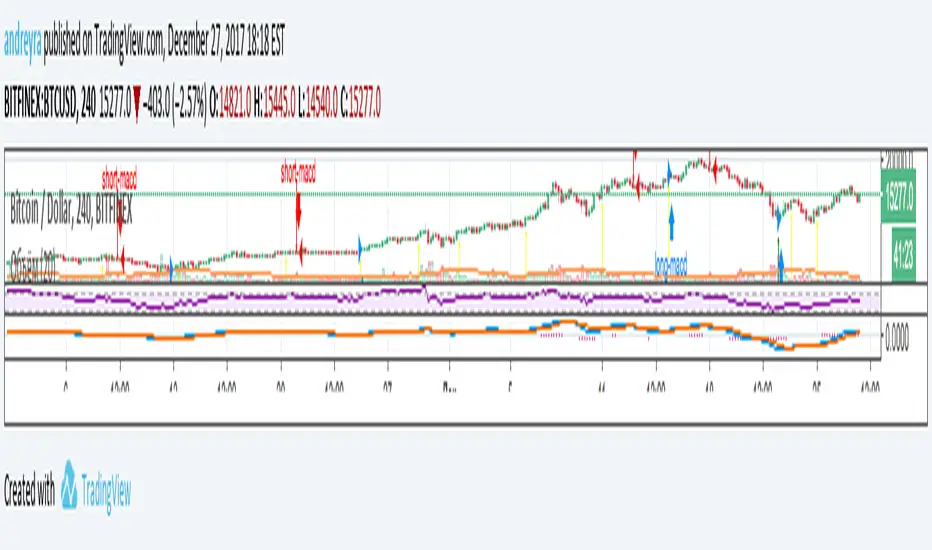
Andrey's Top/Bottom StrategyRecommended for BTCUSD -2.88% 4H.
-red arrow - sell (strong downtrend)
-purple arrow - week downtrend
-green arrow - buy (strong uptrend)
-blue arrow - week uptrend
-yellow - buy
DepthHouse - Moving Average ChannelsThe indicator Moving Average Channels was created for experimental purposes due to the parabolic moves BTC has made in the recent past.
How it works:
The basis, or center line, is a standard moving average that is set by the user.
The bands are then a customizable percentage of the basis.
Which based on the settings, could serve as possible support and resistance.
DepthHouse – Moving Average Channels has been published for you all to see and try for yourselves.
Maybe this indicator has uses elsewhere? If you find something feel free to post it in the comments below!
If you like this indicator, please drop a like or comment!
They are very much appreciated!
Be sure to go to my profile and check out my other indicators!
