Trend Friend - Swing Trade & Scalp Signals - Stocks Crypto ForexTREND FRIEND is a custom built, data driven algorithm that gives buy and sell signals when many different factors line up together on a single candle. It is designed to catch every move so you can expect early entries and exits across all of your favorite markets. Use scalp mode for early entries with lots of signals or swing mode for longer swings with fewer signals and long swing mode for really long swing trades with even less signals.
The best markets to use this indicator on are high volume tickers with a lot of price action as these markets have enough data to use to give the signals the algo needs to be able to detect highly probable moves in price. That being said, it works across all markets such as stocks, crypto, forex and futures and across all timeframes(on really long timeframes it may not give signals due to not having enough data to work with).
***MAJOR POINTS TO REMEMBER BEFORE USING THIS INDICATOR***
The algo is designed to catch major moves, so if a signal seems to come in late, it is highly likely the market is about to reverse so use caution when taking signals that seem late. This typically happens because the market is indecisive so always be careful in these situations and just wait for a better signal when markets are really decisive.
Always trade in the direction of the trend meaning the volume weighted moving average clouds. There is also a trend detection label and risk level label that you should follow to keep your trades as safe as possible. The safest way to do this is only trade short when the VWMA 100 is below the VWMA 500 and a Bear signal comes in very close to a VWMA line. Only trade long when the VWMA 100 is above the VWMA 500 and a Bull signal comes in very close to a VWMA line.
If price is between the moving averages, play the VWMA 100 and VWMA 500 as support and resistance and only take signals near one of the VWMAs with the plan of price returning to the other VWMA. If you are taking trades against the trend, like trying to buy the dips or sell the tops, wait for price to cross the VWMA 100 before following a signal.
If the VWMA 100 and VWMA 500 are close to each other and/or moving sideways, you can expect choppy price action and consolidation so use caution when taking trades during this time. It is better to wait for the price to hold above or below both VWMAs and stay supportive there before taking trades. Waiting for volume to increase is also a good way to avoid chop after the trend decides a direction.
This indicator will repaint sometimes before the candle has closed, so either wait for the candle to close with a signal before entering trades or only take signals before it closes on candles with good volume and technical analysis backing it.
***ALL THE FEATURES YOU NEED***
Trend Friend has multiple features designed to help you trade better and make decisions faster.
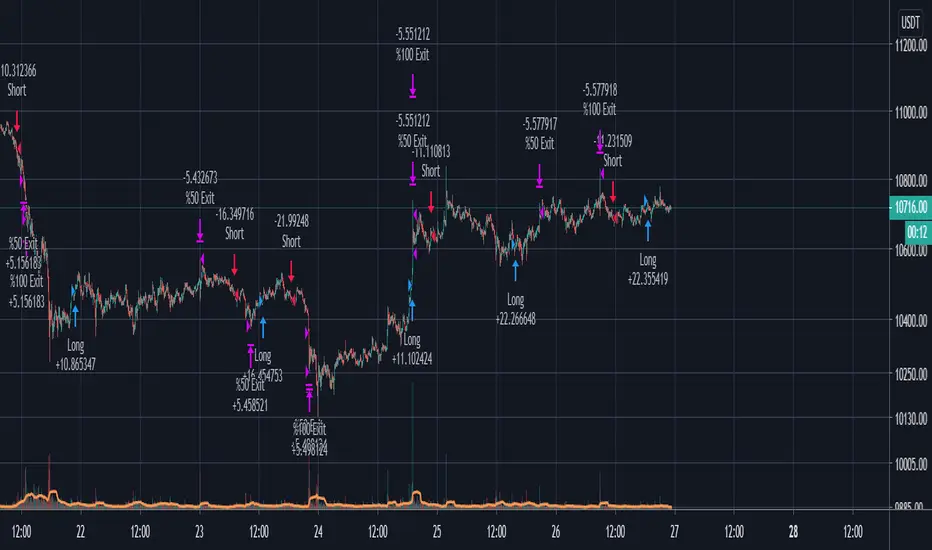
Buy & Sell Signals - When the algo detects all of our required parameters lining up on a single candle, Trend Friend will give Bull or Bear signals on the chart. Bull means upward price action is expected. Bear means downward price action is expected.
Take Profit Signals - When the price action makes a move that typically signals a reversal, a take profit signal will show up on the chart to help you get out of a trade before the next signal comes in.
Risk Levels For Signals
There is a risk detection system that tells you how risky each signal is as it comes in to help you stay out of dangerous trades. Wait for signals with low risk and you’ll be much safer than trying to take trades against the trend.
Alerts - There are options for alerts on buy signals, sell signals, take profit signals, price crossing the VWMA 100 and price crossing the VWMA 500. All of these can be controlled using tradingview alerts so you don't have to watch the charts and wait for things to happen. These alerts can also be used to send orders to trading bots if you choose.
Candles Painted Green Or Red According To Buy & Sell Pressure - By default, this indicator paints the candle sticks green, red or blue according to buy & sell pressure(DMI). You will need to turn off candle colors in your chart settings for this to appear correctly.
Percentage Updates - The table on the right has live percentage updates so you don’t have to measure out every move you are expecting. It will tell you the percentage from closest fibonacci levels, percentage away from the VWAP, percent gain or loss from the last signal entry and percentages from your own trades that can be configured in the settings. These help you always know how much more you can squeeze out of a trade and where your position stands without having to switch screens between Tradingview and your broker constantly.
Moving Average & VWAP Clouds - We included two color coded volume weighted moving averages(VWMA 100 and VWMA 500) and a color coded RMA 10 moving average. We also have a VWAP dotted line and cloud so you can easily see the trend direction on the chart at all times. The cloud and moving averages will turn green or red in real time depending on whether price is above or below each moving average or the VWAP respectively.
Trend Detection Label - The top label on the percentage update table tells you if the trend for this timeframe is Bullish or Bearish as well as when the trend is undecisive with choppy price action expected.
Chop & Low Volume Warning Labels - When price action is choppy or there is very low volume compared to historic candles, a warning label will appear at the top of the screen so you know to use caution and stay out of trades during these times.
Auto Fibonacci Levels - The chart will automatically populate fibonacci retracement and extension levels. The percentage update table will also give you real time updates on how far away the next fibonacci levels are from the current price.
Bounce Zone - We also included a very long term moving average cloud(EMA 1000 and EMA 2000) that shows as purple on the chart. When price enters that cloud, you can expect a reversal in that area. If price was trending above the cloud, expect that cloud to act as support. If price was trending below the cloud, expect that cloud to act as resistance. When price is trying to break through that cloud in either direction you can expect price action to be choppy and big moves to happen once price gets supportive in that zone and breaks out.
Margin Multiplier - If you are using margin to trade, our margin multiplier will multiply all of the percentage updates by the margin level you input in the settings tab so your percentages will reflect the percentages in your account.
***HOW TO USE***
Scalp, Swing And Long Swing Mode
You can choose from scalp mode, swing mode or long swing mode in the indicator settings. It is set to scalp mode by default. Scalpers will want to use the scalp mode as it provides early entries and exits and is designed to catch every move quickly. Swing mode is designed to catch almost every move and filter out some of the noise so it will have less signals than scalp mode. Long swing mode is designed to catch those lengthy moves and will hold positions the longest but give entries later than the other modes.
Try all three on a few charts and timeframes to see which setting matches your trading style the best. If you want more signals with any of the 3 modes, go to a lower timeframe. If you want less signals on any mode, go to a higher timeframe.
Bull & Bear Signals - When all of our algo parameters line up, a BULL or BEAR label will print on the chart. Bull labels will be colored green and bear labels will be colored red. Bull indicates a good place to enter a long trade because the algo is detecting patterns that indicate price should move upwards. Bear indicates a good place to enter a short trade because the algo is detecting patterns that indicate price should move downwards.
For best results using these signals, take trade signals that line up very closely with fibonacci levels or volume weighted moving averages or the vwap or any combination of them. It is also recommended to only take trades in the direction of the trend to avoid trading false reversals. Wait for low risk signals using our risk identifier and then enter the market. Waiting for good volume to come in will also help you avoid chop and catch those quick moves.
Also, make sure to check the percentage updates table to see if the expected move to the next fibonacci level is far enough away to make the risk to reward ratio worth taking the trade. Watch for signals when the VWMAs squeeze together after a wide gap and price breaks out with a corresponding signal as these can bring large, quick moves in price. Use caution when the VWMAs are close to each other and trending sideways as this usually brings choppy price action.
(The bull and bear signals can be turned on or off in the indicator settings input tab. Useful if you want to clean up the chart or only show bear or bull signals according to the trend.)
Take profit Signals - Take profit labels will show up on the chart when a reversal candle pattern or reversal indicator pattern is detected while a trade is still open. Use these signals as times that it may be a good point to exit the trade to avoid losses or reduced profits.
(The take profit signals can be turned on or off in the indicator settings input tab.)
Risk Level Label
Taking trades against the trend is dangerous because there are more false bottoms than there are actual bottoms. Our risk detection label is there to keep you from taking dangerous trades against the trend. The label will say Low Risk when the trend is in the same direction as the last signal given. The label will say Medium Risk when the trend is neutral because price likes to chop around during these times. The label will say High Risk when the trend is in the opposite direction as the last signal given.
Make sure you wait for the risk level detector to show Low Risk before taking trades or you may be buying a false bottom.
Candles Colored According To Buy & Sell Pressure - By default this indicator will paint the candlesticks green, red or blue depending on the buy & sell pressure for those candles using the Directional Movement Index or DMI. If buy pressure is higher than sell pressure, it will paint green. If Sell pressure is higher than buy pressure, it will paint red. If buy pressure is equal to sell pressure, it will paint blue. Use this to confirm which direction buying and selling is favoring and use a change in color trend to determine reversal points early. For this to work correctly you will need to go into chart settings(gear icon top right) and in the symbol tab turn off body, wicks and border.
(The buy & sell pressure candle coloring can be turned on or off in the indicator settings input tab.)
Auto Fibonacci - This indicator will automatically populate fibonacci retracement and extension levels for you. These levels are calculated using the previous high and low. You can switch the source between the previous day, week, month, quarter and year(the weekly setting is the default as it is great for day trading). The previous high and low levels will show as white(These are very important levels so watch for price to bounce off of the white lines). The percentage update table will also show the percentage gap from the current price and the next closest fibonacci level above and below, with labels telling you which fib levels they are.
(The fibonacci levels can be turned on or off in the indicator settings input tab.)
Volume Weighted Moving Averages With Clouds - The red or green moving averages should be treated as dynamic support and resistance as well as a visual way of telling current price trends. You can expect price to bounce off of these moving averages very often and quick moves usually happen when price breaks out of these moving averages.
The safest long trades you can take will be when the VWMA 100 is above the VWMA 500 and you get a BULL signal that is very close to the VWMA 100 or VWMA 500. The safest short trades you can take will be when the VWMA 100 is below the VWMA 500 and you get a BEAR signal that is very close to the VWMA 100 or VWMA 500.
When the moving averages squeeze together and price bounces between them, you can expect big moves in price when it breaks out. If price has been trending up and the moving averages squeeze together, expect the price to fall quickly once it breaks down from there. If price has been trending down and the moving averages squeeze together, expect the price to jump quickly once it breaks out from there.
These moving averages and the clouds associated with them will paint green when price is above them, indicating a bullish trend and they will change to red when price is below the moving averages, indicating a bearish trend.
You can also use the moving averages as support and resistance levels when markets are moving sideways. Since these are volume weighted moving averages, price tends to stick to them very well and paints a much clearer picture of what is going to happen than regular moving averages that don't take volume into account. Try it on a bunch of different timeframes and charts to see for yourself.
(The moving averages and clouds can be turned on or off in the indicator settings input tab.)
Bounce Zone - The bounce zone is a purple cloud that is made up of two very long term moving averages. When price is trending above this cloud and comes back down to it, you can expect the price to bounce back upwards in this zone. If the price is trending below this cloud and comes up to it, you can expect the price to bounce back downwards when it reaches this zone.
Sometimes price will break through this cloud and you will usually notice a lot of choppy price action and accumulation in this zone. When price does break out of it, you can expect fast, large moves. I also like to call this zone the safe zone because taking trades in this zone is typically a very safe place to enter trades depending on how the price is trending before it entered this zone. If you look at the cloud on any of your favorite charts, you will see that the cloud usually represents support and resistance areas quite well.
(The bounce zone can be turned on or off in the indicator settings input tab.)
Chop & Low Volume Warnings - When price is choppy, it can be a portfolio killer. When volume is low, it can give false signals or the market can reverse easily, so stay out of trades when these warning labels appear on your chart. If you were already in a trade when these warnings appear, keep a close eye on your trades and be ready to exit if things start to go the wrong way.
Long & Short Entry Calculator - Here you can enter your own entry price for short or long positions so that your actual P&L will be shown live on your chart. This eliminates the need to calculate percentages in your head or switch screens to your broker often or use the measuring tool to calculate your P&L. These will show as zero until a trade price is entered.
Margin Multiplier - If you use margin to trade, enter your margin multiplier in this input and all of the percentages in the percentage update table will reflect how far each level is based on your margin. So a 5x margin will multiply all percentages in the chart by 5 and so on. This way you don’t have to calculate everything in your head or switch between your chart and your broker constantly.
Customization - Go into the indicator settings and you can customize just about everything to suit your style. In the Input tab you can: turn the Bull or Bear labels off or on so you only get the signals that are going in the direction of the trend, turn on or off the moving average lines & clouds, turn on or off the vwap & clouds, set your fibonacci timeframe or turn them off completely and set your long or short entry price as well as your margin level for percentage updates according to your portfolio.
You can also easily customize: the moving average lines & clouds, the bounce zone lines and cloud, the vwap color and line style, the support and resistance line colors and thickness, the bull and bear label styles, the take profit label styles and more.
***MARKETS***
This indicator can be used as a signal on all markets, including stocks, crypto, futures and forex as long as Tradingview has enough data to support the calculations needed by the algo.
***TIMEFRAMES***
Trend Friend can be used on all timeframes.
***IMPORTANT NOTES***
For the buy & sell pressure colored candles to show up properly you will need to go to the chart settings(gear icon in top right corner) and in the symbol tab turn off body, wicks and border.
No indicator can be right 100% of the time and remember that past results do not guarantee future performance. You still need to make smart decisions when using this indicator to be successful. It is also important to note that markets with little volume and price action may not give very good signals due to many different parameters needing to line up on one candle for a signal to be given so use it on high volume tickers with lots of price action for best results.
***TIPS***
Try using numerous indicators of ours on your chart so you can instantly see the bullish or bearish trend of multiple indicators in real time without having to analyze the data. Some of our favorites are our Volume Spikes, Directional Movement Index + Fisher, Volume Profile with DMI, and MOM + MFI + RSI with Trend Friend. They all have real time Bullish and Bearish labels as well so you can immediately understand each indicator's trend.
Buysell

Unicorn Quant Strategy [Astride Unicorn]Deeply customizable trading algorithm with instant back-testing. Its position management and trading signals engines emulate every step of the trading process and display all the actions on the chart. For example, the algorithm shows when to enter or partially close a position, move stop-loss to breakeven, etc. The trader can use these signals in their decision-making and replicate these actions in their trading terminal. The script can also send real-time alerts to the user’s Email.
The trading signals feature calculates entry signals for momentum and trend trading. The calculation is based on trend filtering using our custom filter based on rolling historical volatility. The historical volatility is used to distinguish the market regime and determine the current trend direction. In its calculations, the algorithm uses linear regressions instead of averaging. As our practice shows, it helps to reduce signal lag while keeping the number of false signals low.
HOW TO USE
Set stop-loss and up to three take-profit levels, choose rules for moving the stop-loss level, adjust sensitivity of the entry signals and see the back-test result immediately. If the performance of the strategy satisfies you, proceed with the forward-testing or live-trading.
When using this script, please, keep in mind that past results do not necessarily reflect future results and that many factors influence trading results.
SETTINGS
Use Starting Date - when the flag is turned off, the algorithm uses all available pricing data to calculate back-tests; when turned on, back-tests start from a starting date the user can select in the setting below.
Starting Date - sets a starting date for back-testing.
Trading Signals
Trade Length - defines the length of the trades the algorithm tries to calculate entry signals for. Recommended values are from 1.0 to 6.0.
Sensitivity - controls the sensitivity of the trading signals algorithm. The sensitivity determines the density of trading signals and how close the trailing-stop levels follow the price. The higher the value of this parameter is, the less sensitive the algorithm is. High values of the Sensitivity parameters (100-500) can help to withstand large price swings to stay in longer price moves. Lower values (10-100) work well for short- and medium-term trades.
Signals Type - In the Signals Type dropdown list, there are two options: Market Timing and Market Bias. Market timing is a type of trading signaling when the algorithm tries to find a perfect moment to enter and exit a trade. Market Bias is the type of trading signaling when the algorithm tries to be in a position all the time. When a trade is closed, the algorithm determines a direction to which the market is currently “biased” and immediately opens a trade in this direction.
Position Management
SL - sets stop-loss level measured as a percentage of the trade entry price
TP1, TP2, TP3 - sets take-profit levels measured as a percentage of the trade entry price
Close % at TP1, Close % at TP2, Close % at TP3 - Sets portions of the open position(as a percentage of the initial order size) to close at each of the TP levels
At TP1 move SL to, At TP2 move SL to - Sets the rules for moving stop-loss level in an open trade to protect the floating profit
Dashboards
Active Position Information - turns on/off a dashboard that shows the current SL and TP levels for the active position.
Recommended SL,TP Settings - turns on/off a dashboard that shows recommended settings for the SL and TP levels.

TT Price/Trend IndicatorThe TT Price/Trend Indicator identifies potential trend changes and advises of safe places to set orders at retracements.
Main Signals:
When a "BUY" signal prints, it is suggested to set a buy order at the Blue trendline and wait until price retraces back.
When a "SELL" signal prints, it is suggested to set a short order at the Blue trendline and wait until price rises up.
Take Profit:
The Reactive Trendline (the thick line that switches from Green to Red, and Red to Green frequently) is good at finding local bottoms.
It is suggested to Take Profit on your Long once you see the first switch from Green to Red. If the Reactive Trendline is already Red when your LONG order is filled, wait until it goes from Red-Green-Red to Take Profit.
It is suggested to Take Profit on your Short once you see the first switch from Red to Green. If the Reactive Trendline is already Green when your SHORT order is filled, wait until it goes from Green-Red-Green to Take Profit.
Stop Loss Suggestions:
If you are LONG (BUY), set your Stop/Loss to slightly below the last Higher Low (HL)
If you are SHORT (SELL), set your Stop/Loss to slightly above the last Lower High (LH)
Alternatively, if you want to maximise your Risk:Reward ratio, you can CLOSE your order once a candle engulfs and closes over both the Blue Line AND the Grey Line. Once these levels are broken and you are underwater, the risk to hold that position is no longer worth it. However, this approach can shake you out of winning trades, so I advise you to use other strategies such as Volume, Fibonnaci and RSI etc to help you make a final decision.
Important: If you are taking this approach, don't panic sell - wait for the close of the current engulfing candle to make this decision, because quite often it will just be a wick up or down in your favour.
What are the best Strategies?
The best timeframes are as follows:
- 1 Hour
- 2 Hour
- 4 Hour
- 1 Day
- 1 Week
My Favourite is 1 Hour.
Scalping for advanced traders:
- 1 minute
- 5 minutes
If you are scalping, it is highly recommended to use the TT Volume Indicator as well, to confirm price with volume (see scripts under my profile). Price on its own will not be good enough.
I also recommend the RSI with a 14 SMA to identify Strength breakouts.
Other Features:
- VWAP (Dotted Red/Green line) - this is common liquidity and can be one of the most important Support/Resistance levels in Crypto, which is why it is included.
Can you FOMO order?
Unless you are using this with a combination of other indicators (such as the TT Volume Indicator), it is not recommended to FOMO orders at the "BUY" or "SELL" signal unless you have a clear volume breakout. Please see this explanation on FOMO ordering for further information:

customConfluenceSimplifiedThis indicator is intended to automatically search for confluence on a variety of indicators and conditions, highly customizable parameters, including Take profits, stop losses and classic indicator adjustments.
Best results in BTCUSDT 15m and 1H, but feel free to optimize it on any pair and timeframe. I don't recommend using it in non crypto assets.
Alerts are fully customizable too. You can put any alert() (buy/sell) to any pair.
I intended to maximize quality of signals over quantity. But anyway you can customize a lot of parameters to make it more frequent.
DM me for access.
Jerry J5 Dashboard & Buy Sell Strategy
----- Strategy
The strategy allows you to select from multiple moving averages and uses the concave function and the price being above or below a user defined EMA to provide buy and sell signals. You can select long trades, short trades, or both.
Concavity describes the direction of the curve and how it bends. And, just like a direction the concavity of curves can change and we call these changing points (technically they are inflection points). These changing points are used in conjunction with the stock price relationship to user defined EMAs and provide buy and sell signals when the trend is changing.
Moving Averages available in this strategy are the Exponential Moving Average (EMA), Simple Moving Average (SMA), Weighted Moving Average (WMA), Hull Moving Average (HMA), and Arnaud Legoux Moving Average (ALMA). Best results are typically with HMA and ALMA.
The indicator can be used for every type of market: indices, stocks, cryptocurrencies, currencies and others.
----- 27 Data Point Dashboard
Short Term Trend
Total Trades
Profit Factor
Win Rate %
Net Profit $, % & ROI
Buy & Hold Profit
Max Win $ & %
Max Loss $ & %
Avg Trade $, ROI%, & Bars
Avg Win $, ROI%, & Bars
Avg Loss $, ROI%, & Bars
Max Drawdown $ & %
Open Trade P&L $ & ROI%
For the dashboard you are able to set the target profit factor, win rate, net profit target ROI, winning trade target ROI, Strategy Start Date, and the Buy and Hold Start Date. The inputs are used to color dashboard labels making it easier to identify winning and losing trades based on your criteria.
Option Traders will likely appreciate the ROI% and number of bars being readily available. For example if the Average Winning Trade has a 5% ROI over 5 bars this can help you decide when to enter a trade and how long to stay in the trade.
Some of the label data is available in the TradingView Strategy Tester. However, I wanted a custom dashboard that was always visible on my chart and the J5 dashboard displays a total of 27 data points plus buy and sell signals .
Note: We calculate the ROI for Net Profit, Avg Trade, Avg Win, Avg Loss, and Open Trade based on the capital used for those trade(s). TradingView uses a different method and calculates the return percentage based on initial capital.
Indicators are not a magic pill and should be used to support trading decisions, not to make them for you. Past performance is not a guarantee of future returns. The results of individual stocks with any strategy do not constitute proof they will repeat in the future.
I hope you enjoy the J5.
DISCLAIMER: The information contained in our scripts/indicators/ideas does not constitute financial advice or a solicitation to buy or sell any securities of any type. Trading and investing in the stock market and cryptocurrencies involves substantial risk of loss and is not suitable for every investor. I’m NOT a financial adviser. All trading strategies are used at your own risk.
Please Use the link below for more information.

Wolf TradeWolf Trade indicator designed to help you develop your own trading strategy and give you that extra confirmation on your trade ideas. This indicator helps you to identify the right buying or selling opportunity. Examines several items to issue a buying or selling position. For example, it checks the status of the RSI , as well as the status of the MACD , as well as the status of the stochastic . Checks the order of placement of the EMA and the condition of their cross with ATR. And uses the ATR for stop loss.
Wolf Trade indicator commodities on all timeframes including 1m, 3m , 5m, 15m, 30m, 1H, 2H, 4H, 1D, 1W, etc. Definitely, the performance of this indicator is much better in 1, 2, 4 hours and daily timeframes, but that does not mean you can not use it in shorter time frames.
This indicator is does not repaint and works on any market internationally including crypto, stocks, forex, futures and currencies. You can utilize our indicator for scalping, swing trading, holding or even for trading options as well.
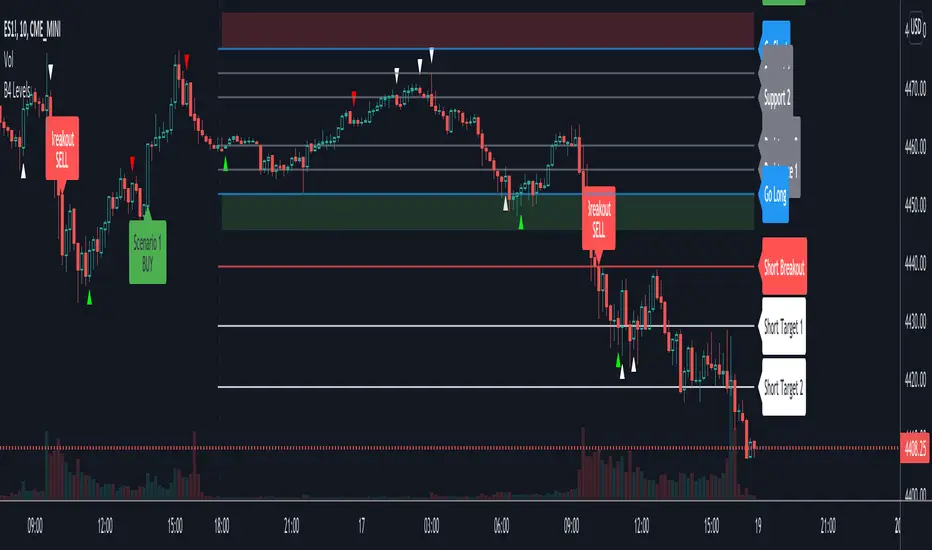
B4Signals Algo PremiumB4Signals Algo indicator is made up of more than 7+ innovative indicators carefully designed to generate high probability buy and sell signals while reducing risk. It derives its entries and exits from the B4Signals Indicator with added trend detection and volatility containment.
B4Signals Algo indicator detects the direction of trends for any asset and on any timeframe allowing traders to increase their confidence in positions, follow trends and stay in positions longer. Profit taking is up to the trader.
B4Signals Algo features:
Automatically generated buy and sell signals
Algo model selection in settings
Algo sensitivity selection in settings
Background chart shading for market hours
B4Signals Algo has two modes to choose from; each with an aggressive and a conservative approach to trading:
Algo 1 - Aggressive = Aims to detect very early trends, and is thus more reactive. Developed to catch both short term and long term trend reversal and provide clarity in the current trend direction. This setting attempts to make it easier to come in early in a new trend as well as to stay longer in that trend.
Algo 1 - Conservative = Aims to detect trend continuation where the stock price is likely to keep its current trend.
Algo 2 - Aggressive = Aims to detect very early confirmed trends, and is thus more reactive. Developed to catch both confirmed short term and confirmed long term trend reversals and provide confirmation in the current trend direction.
Algo 2 - Conservative = Aims to detect very early confirmed trends in conjunction with a filter to keep out false or choppy signals to leave the most accurate ones.
Disclaimer
Copyright by B4Signals.
The information contained in our scripts/indicators/ideas does not constitute financial advice or a solicitation to buy or sell any securities of any type. We will not accept liability for any loss or damage, including without limitation any loss of profit, which may arise directly or indirectly from the use of or reliance on such information.
All investments involve risk, and the past performance of a security, industry, sector, market, financial product, trading strategy, or individual’s trading does not guarantee future results or returns. Investors are fully responsible for any investment decisions they make. Such decisions should be based solely on an evaluation of their financial circumstances, investment objectives, risk tolerance, and liquidity needs.
SMART4TRADER-US STOCKSThe indicator is intended to evaluate the stock market , as it takes into account the data on the BUY and SELL of all US shares. In the indicator, you can select various methods for providing data.
Priority = (BUY - SELL) with a intraday cumulative effect.
Ratio = (BUY / SELL) with a intraday cumulative effect.
Delta = (BUY - SELL) on each candle.
Volume = (BUY + SELL) on each candle.
Cumulative = (BUY - SELL) with cumulative for all available history.
------------------------------
Индикатор предназначен для оценки фондового рынка , так как в себе учитывает данные о покупка и продажах всех акций США. В индикаторе можно выбрать различные методы предоставления данных.
PRIORITY = (BUY - SELL) с накопительным эффектом внутри дня.
RATIO= (BUY / SELL) с накопительным эффектом внутри дня.
DELTA= (BUY - SELL) на каждой свече.
VOLUME= (BUY + SELL) на каждой свече.
CUMULATIVE= (BUY - SELL) с накопительным за всю доступную историю на графике.

B4Signals Ichimoku PremiumB4Signals Ichimoku is an advanced version of the standard ichimoku indicator. It removed the complexity of understanding all parts of the ichimoku indicator and provides a consensus based status of the overall ichimoku system.
B4Signals Ichimoku indicator is a very powerful price forecasting tool. Trade entry points identified with B4Signals Ichimoku are highly accurate on their own but they become very powerful when integrated into the rest of the B4 suite of indicators. Each entry is confirmed and validated with the the B4Signals Trading System before opening a position.
B4Signals Brackets features:
Automatic interpretation of the current price trend
Automatic interpretation of the lagging line
Automatic interpretation of the crosses
Automatic interpretation of the cloud forecast
Resulting trend direction
Trade entry and exit points
Automatic calculation of risk for entries
Setup alerts and get notified:
Trade entries and exits are triggered
Disclaimer
Copyright by B4Signals.
The information contained in our scripts/indicators/ideas does not constitute financial advice or a solicitation to buy or sell any securities of any type. We will not accept liability for any loss or damage, including without limitation any loss of profit, which may arise directly or indirectly from the use of or reliance on such information.
All investments involve risk, and the past performance of a security, industry, sector, market, financial product, trading strategy, or individual’s trading does not guarantee future results or returns. Investors are fully responsible for any investment decisions they make. Such decisions should be based solely on an evaluation of their financial circumstances, investment objectives, risk tolerance, and liquidity needs.

B4Signals Brackets PremiumB4Signals Brackets is a geometrical indicator that quantifies the price action in a pivot zone. It uses historical pricing to identify time and price alignments in order to forecast price levels. Price levels identified by B4Signals Brackets are significant support/resistance points. A decisive price break of these points results in very profitable trade opportunities.
B4Signals Brackets indicator is a very powerful price forecasting tool. Trade entry points identified with B4Signals Brackets are highly accurate on their own but they become very powerful when integrated into the rest of the B4 suite of indicators. Each entry is confirmed and validated with the the B4Signals Trading System before opening a position.
B4Signals Brackets features:
Dynamically calculated price bands during the significant times in the market
Price breakouts and forecast of price targets
Significant support and resistance price points
Traders can enable and customize the following:
Select the dynamic update time blocks and update times (changing these settings are not recommended)
Customize the visibility of the background shading of brackets
Setup alerts and get notified:
Trade entries are triggered
Disclaimer
Copyright by B4Signals.
The information contained in our scripts/indicators/ideas does not constitute financial advice or a solicitation to buy or sell any securities of any type. We will not accept liability for any loss or damage, including without limitation any loss of profit, which may arise directly or indirectly from the use of or reliance on such information.
All investments involve risk, and the past performance of a security, industry, sector, market, financial product, trading strategy, or individual’s trading does not guarantee future results or returns. Investors are fully responsible for any investment decisions they make. Such decisions should be based solely on an evaluation of their financial circumstances, investment objectives, risk tolerance, and liquidity needs.

B4Signals Levels PremiumB4Signals Levels is a versatile indicator that allows traders to recognize key price levels, entry and exit points, and appropriate risk management.
B4Signals Levels indicator identifies trade entries for pivot points and breakouts. Trade entry points identified with B4Signals Levels are highly accurate on their own but they become very powerful when integrated into the rest of the B4 suite of indicators. Each entry is confirmed and validated with the the B4Signals Trading System before opening a position.
B4Signals Levels features:
10 clearly identified pivot points that provide traders with key support, resistance, trade entry and exit levels
Trade entry signals with profit target and stop loss levels
Breakout signals with profit target and stop loss levels
Trend reversal arrows for possible peak points of an existing trend
Trend exhaustion arrows for profit taking zones
Traders can enable and customize the following:
Select the aggregation to fit the trader's style of trading (intraday, swing trades, options, etc.)
Customize the visibility of the historical levels for backtesting
Customize the visibility of different types of trade entries
Setup alerts and get notified:
Trade entries are triggered
Price breakouts are triggered
Trend reversal has been identified
Trend exhaustion has been identified
Disclaimer
Copyright by B4Signals.
The information contained in our scripts/indicators/ideas does not constitute financial advice or a solicitation to buy or sell any securities of any type. We will not accept liability for any loss or damage, including without limitation any loss of profit, which may arise directly or indirectly from the use of or reliance on such information.
All investments involve risk, and the past performance of a security, industry, sector, market, financial product, trading strategy, or individual’s trading does not guarantee future results or returns. Investors are fully responsible for any investment decisions they make. Such decisions should be based solely on an evaluation of their financial circumstances, investment objectives, risk tolerance, and liquidity needs.
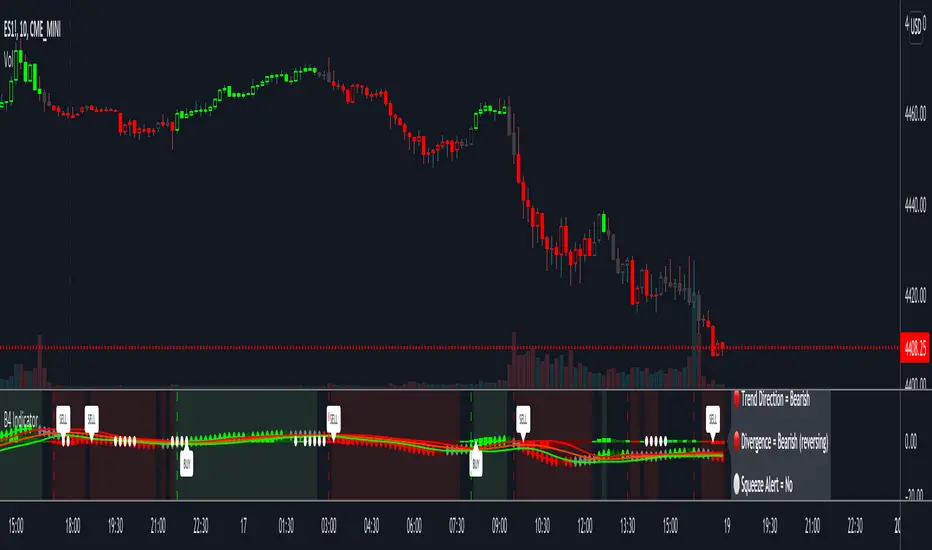
B4Signals IndicatorB4Signals Indicator is part of a suite of technical indicators that will help you target high value trading opportunities no matter what you trade. A successful trader understands the need to take advantage of opportunity when there is a trend that exhibits good momentum. Now, with B4Signals Indicator you can capture momentum while managing risks with our multi-featured indicator that is designed to identify breakouts or breakdowns in every market condition while providing clear trade entries and exists upon a single glance.
B4Signals Indicator is simple and easy to learn, yet robust enough to be reliable across all types of stocks, in all types of market environments. It provides high probability of reliable signals. It harnesses the power of confluence of indicators to confirm buy/sell conditions.
Virtually every day, B4Signals Indicator proves itself in the real world trading arena-rendering profits over a variety of markets and time frames. We combined highly successful trend following strategies to identify breakout or breakdown points as entry signals. B4Signals Indicator is an extremely accurate tool, and a vital and part of our B4 Trading System, a suite of technical indicators that provides amazingly accurate buy and sell entries, protective stops, trailing stops and profit targets. With every trade you will know the precise entry level and whether you are going long or short, how much you need to risk on the trade and when to exit.
Either As A Stand Alone Indicator or As a Part of Our Suite:
B4Signals Indicator can be used standalone or as a part of your current trading strategy.
Let the B4 Trading System show you when to get in a trade, how long to let your profits run, and when to exit. Virtually every possible market contingency is covered by the system rules so you always know exactly what to do. At the time of every entry, you always have a solid protective stop and precise target so you know exactly where to get in and where to get out and what to do in case things don’t go your way. This eliminates many stressful decisions associated with trading errors and unnecessary losses. B4Signals Indicator was designed for both new and seasoned traders.
B4Signals Indicator Features:
Trading Bands - These bands by themselves can be highly effective tools, but the potential for trading success is greatly increased when combined with B4 System
Confluence Conformation Cloud - A special combination of top performing, proven technical indicators that produces an incredibly easy and reliable way to identify the start and end of market trends
Bull Bear Lines - These fire either red or green to alert you to get ready to enter your position
Buy & Sell Signal Entries - When these signals are generated, they alert us to a market ready to possibly explode to new highs or lows
Trend Line - Identifies the prevailing direction of price. It shows the direction and speed of price, clearly and accurately identifying when bullish or bearish momentum is high
Squeeze Dots - Alerts you when markets may break out of a consolidation range
Squeeze Cloud - Changes colors in the bands when a squeeze is present getting you ready for an explosion in price action
Labels - Market Forecast, Trend, Divergence and Squeeze Alert. These labels are color coded to held you identify market turning points
Bar Coloring - Allows several options to color the candles according o strategies within the indicator
Our indicator is completely customizable and clearly identifies buy and short signals based on a combination of 12 unique metrics.
B4Signals Indicator Works In Any Market & Allows Users To:
Stay in positions longer, and catch entries/exits & reversals with crystal clear signals for precision
Designed for both trend following and contrarian traders
Timely filter out noise from the price in order to have clear pictures of the underlying market trend
Catch trends when they change bullish/bearish colors from green to red & vice versa
Improves chances of getting out of a winning position in profit
Disclaimer
Copyright by B4Signals.
The information contained in our scripts/indicators/ideas does not constitute financial advice or a solicitation to buy or sell any securities of any type. We will not accept liability for any loss or damage, including without limitation any loss of profit, which may arise directly or indirectly from the use of or reliance on such information.
All investments involve risk, and the past performance of a security, industry, sector, market, financial product, trading strategy, or individual’s trading does not guarantee future results or returns. Investors are fully responsible for any investment decisions they make. Such decisions should be based solely on an evaluation of their financial circumstances, investment objectives, risk tolerance, and liquidity needs.
3 Seas RSI Wave OscillatorTraditional Triple RSI Oscillator combining a Fast, Normal, and Slow RSI to achieve high accuracy entry and exit strategies. This indicator is UNIQUE because it uses a mathematical filter to trim false signals from the RSI, thus creating a reliable RSI driven entry and exit indicator represented by red and green arrows. For additional functionality divergences are identified and live plotted. UNIQUELY Alongside the 0 axis an OBV function is charted relative to the RSI to allow OBV and RSI divergences to be observed on equal mathematical scales, this is exceedingly useful to observe relative strength at pools of liquidity. The three main configured RSI's are also plotted for traditional usage case but can be removed.
Green arrow indicates a Buy opportunity optimized for standard Dollar Cost Averaging strategies.
Red arrow indicates a Sell opportunity optimized for standard Dollar Cost Averaging strategies.
Not Financial Advice.
Super Rev StudyThe super Rev Study is a buy sell indicator that uses a combination of 3 super trend lines , EMA, Williams %R and the squeeze momentum indicator.
The super trend lines and ema are utilised to locate the trend.
The williams %R has been incorporated to determine overbought/oversold conditions.
The buy and sell flags are generated based on the following conditions:
The location of the price in relation to the super trend lines
if the price is above or below the EMA.
If the Williams %R is oversold/overbought
The squeeze momentum indicator can be added as a filter to only allows trade in certain conditions i.e bullish and above the 0 line or avoid trades if bearish and above the 0 line for example.
All the indicators involved can be customised to created a unique indicator
Created by manomanomano, Developed by @badshah_e_alam
Mesa Advanced TriggersThis indicator is based on the indicator 'MESA Phase ' by shayankm (so shoutouts to him for the open source code)
MESA Phase :
sayankm: www.tradingview.com
In this advanced version of the indicator, green/red dots will be printed on the pivot points & alerts can be triggered on these. There is also a zone (which you can adjust) that dot's will not be printed in, you want to adjust this to try and avoid dots being printed during sideways movement.

Weis Wave Volume Bar Colours AdvancedIn this advanced version of the Weis Wave Volume Bar Colour indicator, you can change the trend length for the green & red bars individually. Alerts can also be triggered at the start of a new trend easily, by the green/red dots.

72s Strat: Backtesting Adaptive HMA+ pt.1This is a follow up to my previous publication of Adaptive HMA+ few months ago, as a mean to provide some kind of initial backtesting tools. Which can be use to explore many possible strategies, optimise its settings to better conform user's pair/tf, and hopefully able to help tweaking your general strategy.
If you haven't read the study or use the indicator, kindly go here first to get the overall idea.
The first strategy introduce in this backtest is one most basic already described in the study; buy/sell is when movement is there and everything is on the right side; When RSI has turned to other side, we can use it as exit point (if in profit of course, else just let it hit our TP/SL, why would we exit before profit). Also, base on RSI when we make entry, we can further differentiate type of signals. --Please check all comments in code directly where the signals , entries , and exits section are.
Second additional strategy to check; is when we also use second faster Adaptive HMA+ for exit. So this is like a double orders on a signal but with different exit-rule (/more on this on snapshots below). Alternatively, you can also work the code so to only use this type of exit.
There's also an additional feature which you can enable its visuals, the Distance Zone , is to help measuring price distance to our xHMA+. It's just a simple atr based envelope really, I already put the sample code in study's comment section, but better gonna update it there directly for non-coder too, after this.
In this sample I use Lot for order quantity size just because that's what I use on my broker. Also what few friends use while we forward-testing it since the study is published, so we also checked/compared each profit/loss report by real number. To use default or other unit of measurement, change the entry code accordingly.
If you change your order size, you should also change the commission in Properties Tab. My broker commission is 5 USD per order/lot, so in there with example order size 0.1 lot I put commission 0.5$ per order (I'll put 2.5$ for 0.5 lot, 10$ for 2 lot, and so on). Crypto usually has higher charge. --It is important that you should fill it base on your broker.
SETTINGS
I'm trying to keep it short. Please explore it further again. (Beginner should also first get acquaintance with terms use here.)
ORDERS:
Base Minimum Profit Before Exit:
The number is multiplier of ongoing ATR. Means that when basic exit condition is met, algo will check whether you're already in minimum profit or not, if not, let it still run to TP or SL, or until it meets subsequent exit condition, then it will check again.
Default Target Profit:
Multiplier of ATR at signal. If reached before any eligible exit condition is met, exit TP.
Base StopLoss Point:
You can change directly in code to use other like ATR Trailing SL, fix percent SL, or whatever. In the sample, 4 options provided.
Maximum StopLoss:
This is like a safety-net, that if at some point your chosen SL point from input above happens to be exceeding this maximum input that you can tolerate, then this max point is the one will be use as SL.
Activate 2nd order...:
The additional doubling of certain buy/sell with different exits as described above. If enable, you should also set pyramiding to at least: 2. If not, it does nothing.
ADAPTIVE HMA+ PERIOD
Many users already have their own settings for these. So in here I only sample the default as first presented in the study. Make it to your adaptive.
MARKET MOVEMENT
(1) Now you can check in realtime how much slope degree is best to define your specific pair/tf is out of congestion (yellow) area. And (2) also able to check directly what ATR lengths are more suitable defining your pair's volatility.
DISTANCE ZONE
Distance Multiplier. Each pair/tf has its own best distance zone (in xHMA+ perspective). The zone also determine whether a signal should appear or not. (Or what type of signal, if you wanna go more detail in constructing your strategy)
USAGE
(Provided you already have your own comfortable settings for minimum-maximum period of Adaptive HMA+. Best if you already have backtested it manually too and/or apply as an add-on to your working strategy)
1. In our experiences, first most important to define is both elements in the Market Movement Settings . These also tend to be persistent for whole season since it's kinda describing that pair/tf overall behaviour. Don't worry if you still get a low Profit Factor here, but by tweaking you should start to see positive changes in one of Max Drawdown and Net Profit, or Percent Profitable.
2. Afterwards, find your pair/tf Distance Zone . When optimising this, what we seek is just a "not to bad" equity curves to start forming. At least Max Drawdown should lessen more. Doesn't have to be great already, but should be better, no red in Net Profit.
3. Then go manage the "Trailing Minimum Profit", TP, SL, and max SL.
4. Repeat 1,2,3. 👻
5. Manage order size, commission, and/or enable double-order (need pyramiding) if you like. Check if your equity can handle max drawdown before margin call.
6. After getting an acceptable backtest result, go to List of Trades tab and find the biggest loss or when many sequencing loss in a row happened. Click on it to go to exact point on chart, observe why the signal failed and get at least general idea how it can be prevented . The rest is yours, you should know your pair/tf more than other.
You can also re-explore your minimum-maximum period for both Major and minor xHMA+.
Keep in mind that all numbers in Setting are conceptually in a form of range . You don't want to get superb equity curves but actually a "fragile" , means one can easily turn it to disaster just by changing only a fraction in one/two of the setting.
---
If you just wanna test the strength of the indicator alone, you can disable "Use StopLoss" temporarily while optimising settings.
Using no SL might be tempting in overall result data in some cases, but NOTE: It is not recommended to not using SL, don't forget that we deliberately enter when it's in high volatility. If want to add flexibility or trading for long-term, just maximise your SL. ie.: chose SL Point>ATR only and set it maximum. (Check your max drawdown after this).
I think this is quite important specially for beginners, so here's an example; Hypothetically in below scenario, because of some settings, the buy order after the loss sell signal didn't appear. Let's say if our initial capital only 1000$ using leverage and order size 0,5 lot (risky position sizing already), moreover if this happens at the beginning of your trading season, that's half of account gone already in one trade . Your max SL should've made you exit after that pumping bar.
The Trailing Minimum Profit is actually look like this. Search in the code if you want to plot it. I just don't like too many lines on chart.
To maximise profit we can try enabling double-order. The only added rule coded is: RSI should rising when buy and falling when sell. 2nd signal will appears above or below default buy/sell signal. (Of course it's also prone to double-loss, re-check your max drawdown after. Profit factor play its part in here for a long run). Snapshot in comparison:
Two default sell signals on left closed at RSI exit, the additional sell signal closed later on when price crossover minor xHMA+. On buy side, price haven't met our minimum profit when first crossunder minor xHMA+. If later on we hit SL on this "+buy" signal, at least we already profited from default buy signal. You can also consider/treat this as multiple TP points.
For longer-term trading, what you need to maximise is the Minimum Profit , so it won't exit whenever an exit condition happened, it can happen several times before reaching minimum profit. Hopefully this snapshot can explain:
Notice in comparison default sell and buy signal now close in average after 3 days. What's best is when we also have confirmation from higher TF. It's like targeting higher TF by entering from smaller TF.
As also mention in the study, we can still experiment via original HMA by putting same value for minimum-maximum period setting. This is experimental EU 1H with Major xHMA+: 144-144, Flat market 13, Distance multiplier 3.6, with 2nd order activated.
Kiwi was a bit surprising for me. It's flat market is effectively below 6, with quite far distance zone of 3.5. Probably because I'm using big numbers in adaptive period.
---
The result you see in strategy tester report below for EURUSD 15m is using just default settings you see in code, as follow:
0,1 lot for each order (which is the smallest allowed by my broker).
No pyramiding. Commission: 0.5 usd per order. Slippage: 3
Opening position is only using basic strategy #1 (RSI exit). Additional exit not activated.
Minimum Profit: 1. TP: 3.
SL use: Half-distance zone. Max SL: 4.5.
Major xHMA+: 172-233. minor xHMA+: 89-121
Distance Zone Multiplier: 2.7
RSI: Standard 14.
(From our forward-testing, the difference we get from net profit is because of the spread, our entry isn't exactly at the close/open price. Not so much though, but not the same. If somebody can direct me to any example where we can code our entry via current bid/ask price, that would be awesome!)
It's already a long post (sorry), think I'm gonna pause here. Check out the code :)
---
DISCLAIMER: Past performance is no guarantee of future results , and so on.. you know the drill ;)
Please read whole description first before using, don't take 1-2 paragraph and claim it's the whole logic, you are responsible of your own actions and understanding.

MTF SwingSwiss - Premium@panthair9, a SwingSwiss user, asked me to develop this script based on the two SwingSwiss crosses.
The indicator shows in real-time how the other timeframes are trading the asset.
It's pretty useful to know that the higher timeframes are also trading your way as it limits your risk (because you are trading the right trend)
You can choose up to five timeframes and style the lines and colored blocks 😃
There is one line per timeframe and whenever the green cross appears on the timeframe, it will get updated into the line as well !! I love the thing, thanks again @panthair9 ❤️
PS:
Dear SwingSwiss community, I am really trying to build the best indicator out there!
If you feel like I could improve the indicator in any way, just ask!
I'll do my best to make your dream indicator come true 🙌
Have A Great Day
Dan

NeverBot Basic Momentum ShiftNeverBots Basic Momentum Shift Script
This script is a basic up/down indicator to tell you which way momentum has shifted, this should be used as part of another system to add confluence to your already existing long or short thesis. Uses a simple algebraic equation to define the momentum and when up or down has shifted above/below the other.
Combine this with an MA strategy to get entries for a good hit rate. Typically used for intraday but you can still use this as an indicator for higher time frames.
Crypto is very volatile and momentum can shift within a few minutes which is why you will see some failed signals, but typically it works very well for catching the big moves in crypto as momentum becomes very strong due to FOMO etc..

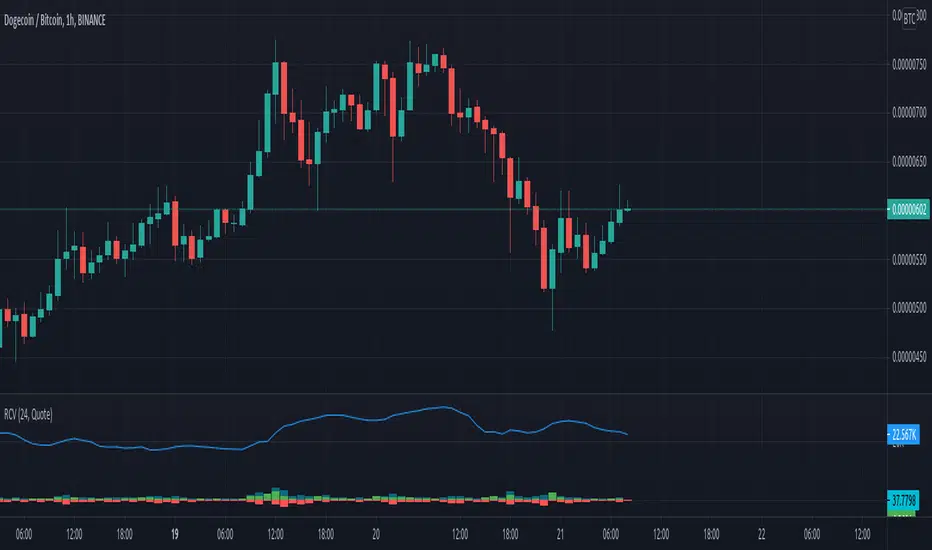
Rolling Cumulative VolumeThis indicator show a simple rolling cumulative volume. A field is specified. Then all last volume indicators are summed.
For example it could calculate last 24h Volume if you use the 1h bars and set the length for 24.
© 2021 - SwingSwiss - BUY/SELL© 2021 - Dan Chetrit - BUY/SELL"
Product Description:
The Indicator combines the Relative Strength Index, Moving Average Convergence Divergence as well as Volume and Stochastic.
The idea is to cross multiple data and signals from these indicators in order to trigger buy when crossing above and sell when crossing below the signal line.
The idea was also to find a mathematical function that will trade the convergence of these lines trying to predict the market.
This indicator works better on a daily chart.
The indicator works long and short but is better for long positions.
The script also includes an EMA 50 line as well as an overbought/oversold RSI background.
The indicator can be used on every type of market: indices, stocks, cryptocurrencies, currencies, and others but, according to backtesting, it works better for the US stock market.
This study is not a guaranteed profit. You should backtest or trade virtual money before using this study on your real portfolio, as it is intended to be a tool. Do your research and learn about the company you are investing in.
Disclaimer:
Trading and investing in the financial markets involves substantial risk of loss and is not suitable for every investor.
All trading strategies are used at your own risk.
Please send me a private message or comment on TradingView to gain access to the script.

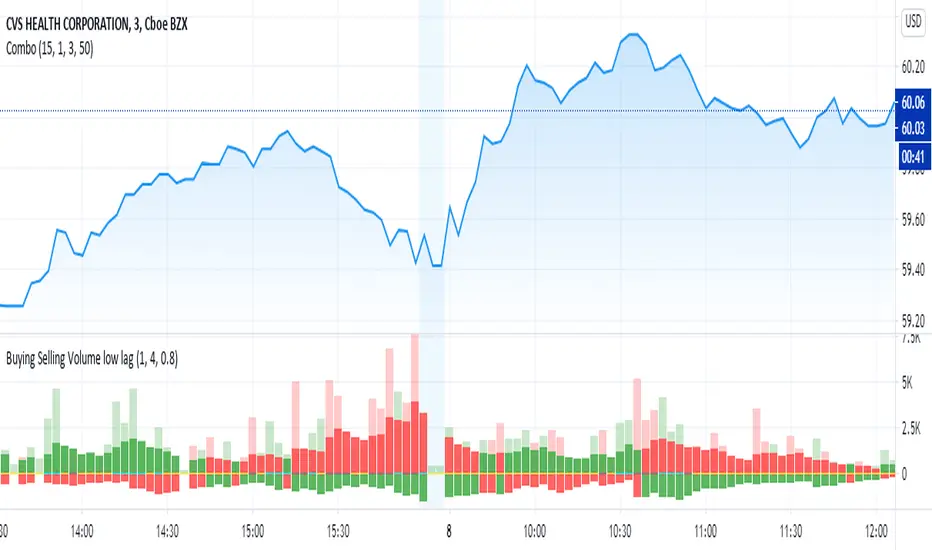
Buying Selling Volume low lagOriginally written by @ceyhun
I added a low lag filter to key components to smooth the bars. The user can adjust the parameters 'fast' and 'slow' to tune.
capam
The original comments of ceyhun are below repeated:
Buying Selling Volume
-Buy Volume
-Sell Volume
-Buy Volume Percent %
-Sell Volume Percent %
-Volume Index
-Buy Sell Volume-
BuyVolume>SellVolume=Blue barcolor
SellVolume>BuyVolume=Purple barcolor
-Volume Index-
VolumeIndex>length and close > open =Cyan barcolor
VolumeIndex>length and close < open =Gray barcolor
VolumeIndex<=length = Yellow barcolor
MOSTIFWhat is MOSTIF ?
MOSTIF is a combined trading strategies. There are indicators according to 3 different trading strategies and 7 different indicators are included. Trailing Stop and Partial Profits options are included.
Indicators
1-) Improved MOST. Values can be changed according to your wishes any market but settings may vary by market.
2-) Tillson T3 Indicator. Values can be changed according to your wishes any market and activating T3 Line for confirmation.
3-) 5 Different Oscillator Types. ("CCI", "RSI", "STOCH", "MFI" and "AVERAGE") are created with special algo types.