Max RR CalculatorAutomatically calculates the maximum RR reached during trade. Entry is at the candle close. There is an option available that takes another trade after getting stopped out on the next candle that is in same bias as first trade.
(If the first trade is a long and gets stopped out, then the second trade will wait until the next up candle to enter long again)
Calculator

BB Sidecar CalculatorBB Sidecar Calculator
Visual trade planner and dynamic risk-to-reward tool
Overview
The BB Sidecar Calculator is a precision planning tool designed to help traders visualize risk, reward, and position sizing directly on their charts. By inputting basic trade parameters, the indicator calculates stop-loss distance, potential profit targets in R multiples, and total dollar risk or gain based on the instrument type and lot size. It supports a wide range of assets including futures, forex, and equities.
Features
• Manually input or click-to-place entry and stop levels directly on the chart
• Drag and adjust levels dynamically with real-time updates to targets and risk values
• Automatic detection of long or short direction based on entry vs. stop placement
• Supports optional Max Dollar Risk setting to cap trade risk based on your account limits
• Configurable number of R-multiple targets (1R to 10R)
• Instrument-aware calculations with pip support for forex and point-based logic for stocks and futures
• Adjustable label display with configurable text size, color, and price precision
• Customizable currency symbol to match your account denomination
How to Use
1. When you first add the indicator, click on the chart to place your Entry and Stop levels.
2. The indicator will automatically determine whether the trade is Long or Short.
3. Drag either level up or down to adjust your setup visually.
4. Set your Lot Size and optionally define a Max $ Risk value.
5. The indicator will display:
• Entry line with lot size label
• Stop line with dollar risk and distance
• Up to 10 risk-multiple profit targets (1R, 2R, etc.)
Max Risk Logic
When a value is entered for Max $ Risk, the indicator calculates the maximum price difference you can afford based on your lot size and instrument type. It will then:
• Calculate a stop-loss price that aligns with your risk cap
• Compare this with the user-defined stop price
• Select the more conservative stop (the one with less dollar risk)
• Display updated profit targets based on the selected stop level
For forex pairs, pip value and pip size are accounted for in risk calculations. For stocks and futures, point value is used.
If Max $ Risk is set to 0, the indicator uses your manually defined stop price exclusively.
Notes
• Labels and visuals are rendered only on the latest bar for clarity
• Supports various decimal precision levels for accurate price formatting
• Designed for use in planning, not live trade execution
• Works across multiple timeframes and instrument types

Asset Allocation CalculatorOverview
This script is a tool that automatically calculates asset allocation for your investment portfolio. Users can set the weight of multiple assets and monitor the portfolio value in real time based on price fluctuations.
Key Features
Supports input of asset allocation percentages
Dynamic allocation calculation based on real-time price data
Automatically calculates allocated amounts for each asset based on the total investment amount
User-friendly interface with intuitive visual feedback
Settings
Total Capital : Enter the total capital, including the value of assets.
Quantity rounding : Using the rounding function may cause the target allocation to exceed 100%.
Tickers, Weight, Holdings :
To retrieve accurate asset prices, specify both the exchange and the ticker.
If you want to include cash in your portfolio, use $.
Ensure that the total allocation sums to 100%.
Refer to the pre-filled example for the correct format.
Table Settings : You can adjust the table's position, height, font size, and background color.
How to Use
By buying or selling the quantity shown in the Buy column, you can continuously maintain your target allocation.
Hold - Current holdings
Buy - Quantity to buy or sell to reach the target allocation
Target - Quantity aimed for after buying or selling
Caution
It can only calculate for a single currency, so do not mix multiple currency markets.
자산 배분 계산기
소개
이 스크립트는 투자 포트폴리오의 자산 배분을 자동으로 계산해주는 도구입니다. 사용자는 여러 자산의 비중을 설정할 수 있으며, 가격 변동에 따라 포트폴리오 가치를 실시간으로 모니터링할 수 있습니다.
주요 기능
자산 배분 비율 입력 지원
실시간 가격 데이터를 기반으로 한 동적 배분 계산
총 투자 금액을 기준으로 각 자산에 할당된 금액 자동 계산
직관적인 시각적 피드백을 제공하는 사용자 친화적인 인터페이스
설정
Total Capital : 자산 가치를 포함한 총 자본금을 입력하세요.
Quantity rounding : 반올림 기능을 사용하면 목표 비중이 100%를 초과할 수 있습니다.
Tickers, Weight, Holdings :
정확한 자산 가격을 불러오기 위해 거래소와 티커를 함께 입력하세요.
포트폴리오에 현금을 포함하려면 '$'를 사용하세요.
비중 합계가 반드시 100%가 되도록 설정하세요.
예제 형식을 참고하여 올바르게 입력하세요.
한국(원화) 시장을 위한 입력 예시입니다.
KRX:360750, 17.5, 100
KRX:310960, 17.5, 120
KRX:148070, 25, 20
KRX:305080, 25, 10
KRX:139320, 10, 150
UPBIT:BTCKRW, 5, 0.002
$,0,5000000
Table Settings : 테이블의 위치, 높이, 글자 크기 및 배경색을 조정할 수 있습니다.
사용 방법
Buy 열에 표시된 수량만큼 매수 또는 매도하면 목표 비중을 지속적으로 유지할 수 있습니다.
Hold - 현재 보유 수량
Buy - 목표 비중을 맞추기 위해 매수 또는 매도해야 하는 수량
Target - 매수, 매도 후 목표로 하는 수량
주의
한 가지 통화로만 계산할 수 있으니 여러 통화 시장을 혼용하지 마세요.

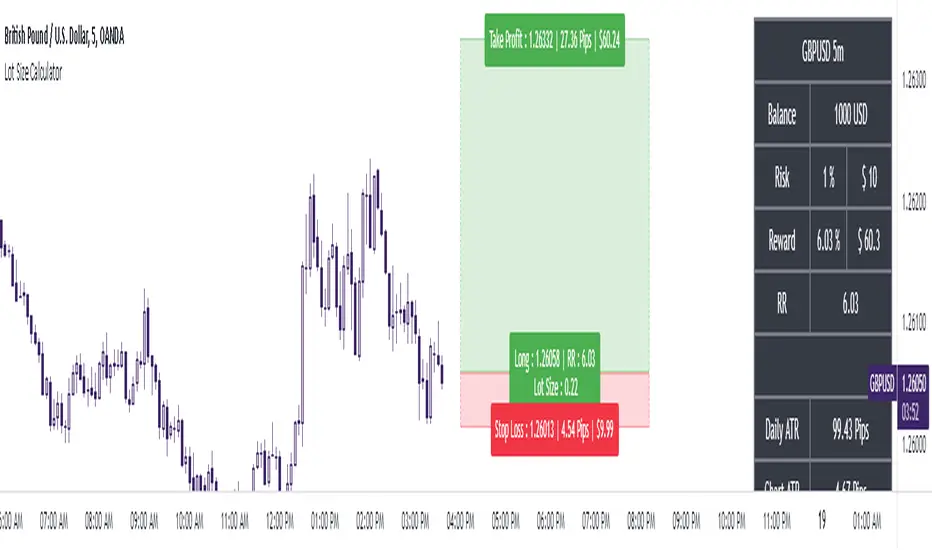
The Ultimate Lot Size Calculator Backstory
I created this Pine Script tool to calculate lot sizes with precision. While there are many lot size calculators available on TradingView, I found that most had significant flaws. I started teaching myself Pine Script over three and a half years ago with the sole purpose of building this tool. My first version was messy and lacked accuracy, so I never published it. I wanted it to be better than any other available tool, but my limited knowledge back then held me back.
Recently, I received a request to create a similar tool, as the current options still fail to deliver the precision and reliability traders need. This inspired me to revisit my original idea. With improved skills and a better understanding of Pine Script, I redesigned the tool from scratch, making it as precise, reliable, and efficient as possible.
This tool features built-in error detection to minimize mistakes and ensure accuracy in lot size calculations. I've spent more time on this project than on any other, focusing on delivering a solution that stands out on TradingView. While I plan to add more features based on user feedback, the current version is already a powerful, dependable, and easy-to-use tool for traders who value precision and efficiency in their lot size calculations.
How to use the tool ?
At first it might seem complicated, but it is quite easy to use the tool. There are two modes: auto and manual. By default, the tool is set on manual mode. When you apply the tool on the chart, it will ask you to choose the entry price, then the stop-loss price, and at last the take-profit price. Select all of them one by one. These values can be changed later.
Settings
There are various setting given for making the tool as flexible as possible. Here is the explanation for some of most important settings. Play with them and make yourself comfortable.
General settings
Auto mode : Use this mode if you want the the risk reward to be fixed and stop loss to be based on ATR. However the stop loss can be changed to be based on user input.
Manual mode : Use this mode if you want full control over entry, stop loss and take profit.
Contract Size : The tool works perfectly for all forex pairs including gold and silver but as the contract size is different for different assets it is difficult to add every single asset into the script manually so i have provided this option. In case you want to calculate lot size for a asset other then forex, gold or silver make sure to change this. Contract size = Quantity of the asset in 1 standerd lot.
Account settings
Automatic mode settings and ATR stop settings
Manual mode settings
Table and risk-reward box settings are pretty much self-explanatory i guess.
Error handling
A lot size calculator is a complex program. There are numerous points where it may fail and produce incorrect results. To make it robust and accurate, these issues must be addressed and managed properly, which practically all existing lot size calculator scripts fail to do.
Golden tip
When the symbol is changed it will display a symbol change warning as the entry, stop loss and take profit price won't change.
There are 2 ways to get fix this. Either manually enter all three values which i hate the most or remove the script from the chart and re-apply the script on chart again.
So to re-apply the indicator in most easy way follow the following instructions:
Note : If you encounter any other error then read the instruction to fix it and if it is an unknow error pleas report it to me in comments or DM.
Percentage Calculator by Akshay GaurThis indicator calculates and displays percentage levels above and below the current price. It allows you to easily identify any percentage levels which can be used in many things like creating strangles and straddles and make informed trading decisions. The indicator automatically adjusts and redraws the lines and labels on the latest bar to reflect real-time market conditions.
Key Features:
• Calculates percentage levels above and below the current price
• Displays percentage levels on big labels with the horizontal lines on the chart
• Allows you to adjust the percentage value and every details.
• Allows you to see Fluctuation line on the chart.
How to Use:
1. Set the percentage value to the desired level (e.g. 1%, 2%, etc.)
2. If you want to see Fluctuation lines also then turn on it from Input settings.
3. Use the displayed levels to identify desired percentage levels.
4. Make informed trading decisions based on the calculated levels

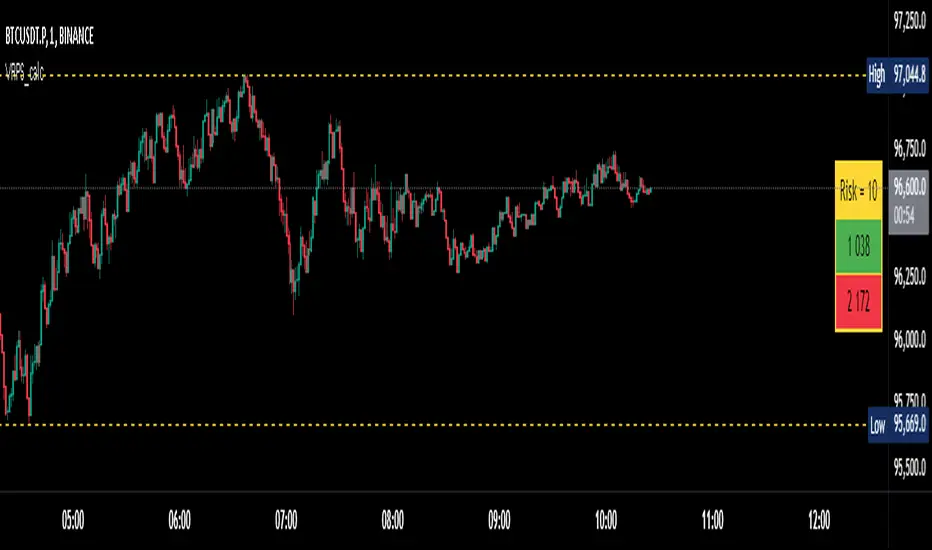
Visual Range Position Size CalculatorVisual Range Position Size Calculator
The "VR Position Size Calculator" helps traders determine the appropriate position size based on their risk tolerance and the current market conditions. Below is a detailed description of the script, its functionality, and how to use it effectively.
---
Key Features
1. Risk Calculation: The script allows users to input their desired risk in monetary terms (in the currency of the ticker). It then calculates the position sizes for both long and short trades based on this risk.
2. Dynamic High and Low Tracking: The script dynamically tracks the highest and lowest prices within the visible range of the chart, allowing for more accurate position sizing.
3. Formatted Output: The calculated values are displayed in a user-friendly table format with thousands separators for better readability.
4. Visual Indicators: Dashed lines are drawn on the chart at the high and low points of the visible range, providing a clear visual reference for traders.
5. If the risk in security price is 1% or less, the background of the cells displaying position sizes will be green for long positions and red for short positions. If the risk is between 1% and 5%, the background changes to gray, indicating that the risk may be too high for an effective trade. If the risk exceeds 5% of the price, the text also turns gray, rendering it invisible, which signifies that there is no justification for such a trade.
---
Code Explanation
The script identifies the start and end times of the visible range on the chart, ensuring calculations are based only on the data currently in view. It updates and stores the highest (hh) and lowest (ll) prices within this visible range. At the end of the range, dashed lines are drawn at the high and low prices, providing a visual cue for traders.
Users can input their risk amount, which is then used to calculate potential position sizes for both long and short trades based on the current price relative to the tracked high and low. The calculated risk values and position sizes are displayed in a table on the right side of the chart, with color coding to indicate whether the calculated position size meets specific criteria.
---
Usage Instructions
1. Add the Indicator: To use this script, copy and paste it into Pine Script editor, then add it to your chart.
2. Input Your Risk: Adjust the 'Risk in money' input to reflect your desired risk amount for trading.
3. Analyze Position Sizes: Observe the calculated position sizes for both long and short trades displayed in the table. Use this information to guide your trading decisions.
4. Visual Cues: Utilize the dashed lines on the chart to understand recent price extremes within your visible range.
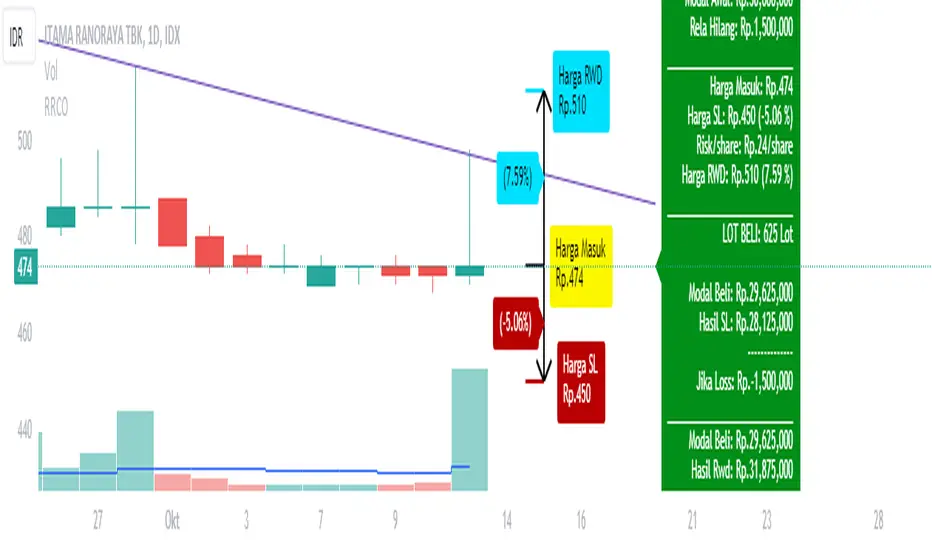
Risk Reward CalculatorPlanning your trading is an important step that you must do before buying the stock.
Risk and Reward Calculator is an important tool for the trader.
With this calculator, you only need to put the capital for one trade and it will automaticaly put the plan for you. But if you want to enter your plan for buy and sell, you just need to check the button and enter the number. the risk and reward calculator will suggest position size based on the information.
The Steps to use Risk Reward Calculator
1. enter how many percentage you can accept if your analysis is wrong.
2. enter how much money you want to trade
3. it will automaticaly calculate the plan for you
4. you can change the reward
5. but if you want to enter your own number, you can check the box. After that enter the number you want for your new plan.
Futures Risk CalculatorFutures Risk Calculator Script - Description
The Futures Risk Calculator (FRC) is a comprehensive tool designed to help traders effectively manage risk when trading futures contracts. This script allows users to calculate risk/reward ratios directly on the chart by specifying their entry price and stop loss. It's an ideal tool for futures traders who want to quantify their potential losses and gains with precision, based on their trading account size and the number of contracts they trade.
What the Script Does:
1. Risk and Reward Calculation:
The script calculates your total risk in dollars and as a percentage of your account size based on the entry and stop-loss prices you input.
It also calculates two key levels where potential reward (Take Profit 1 and Take Profit 2) can be expected, helping you assess the reward-to-risk ratio for any trade.
2. Customizable Settings:
You can specify the size of your trading account (available $ for Futures trading) and the number of futures contracts you're trading. This allows for tailored risk management that reflects your exact trading conditions.
3. Live Chart Integration:
You add the script to your chart after opening a futures chart in TradingView. Simply click on the chart to set your Entry Price and Stop Loss. The script will instantly calculate and display the risk and reward levels based on the points you set.
Adjusting the entry and stop-loss points later is just as easy: drag and drop the levels directly on the chart, and the risk and reward calculations update automatically.
4. Futures Contract Support:
The script is pre-configured with a list of popular futures symbols (like ES, NQ, CL, GC, and more). If your preferred futures contract isn’t in the list, you can easily add it by modifying the script.
The script uses each symbol’s point value to ensure precise risk calculations, providing you with an accurate dollar risk and potential reward based on the specific contract you're trading.
How to Use the Script:
1. Apply the Script to a Futures Chart:
Open a futures contract chart in TradingView.
Add the Futures Risk Calculator (FRC) script as an indicator.
2. Set Entry and Stop Loss:
Upon applying the script, it will prompt you to select your entry price by clicking the chart where you plan to enter the market.
Next, click on the chart to set your stop-loss level.
The script will then calculate your total risk in dollars and as a percentage of your account size.
3. View Risk, Reward, and (Take Profit):
You can immediately see visual lines representing your entry, stop loss, and the calculated reward-to-risk ratio levels (Take Profit 1 and Take Profit 2).
If you want to adjust the entry or stop loss after plotting them, simply move the points on
the chart, and the script will recalculate everything for you.
4. Configure Account and Contracts:
In the script settings, you can enter your account size and adjust the number of contracts you are trading. These inputs allow the script to calculate risk in monetary terms and as a percentage, making it easier to manage your risk effectively.
5. Understand the Information in the Table:
Once you apply the script, a table will appear in the top-right corner of your chart, providing you with key information about your futures contract and the trade setup. Here's what each field represents:
Account Size: Displays your total account value, which you can set in the script's settings.
Future: Shows the selected futures symbol, along with key details such as its tick size and point value. This gives you a clear understanding of how much one point or tick is worth in dollar terms.
Entry Price: The exact price at which you plan to enter the trade, displayed in green.
Stop Loss Price: The price level where you plan to exit the trade if the market moves against you, shown in red.
Contracts: The number of futures contracts you are trading, which you can adjust in the settings.
Risk: Highlighted in orange, this field shows your total risk in dollars, as well as the percentage risk based on your account size. This is a crucial value to help you stay within your risk tolerance and manage your trades effectively.

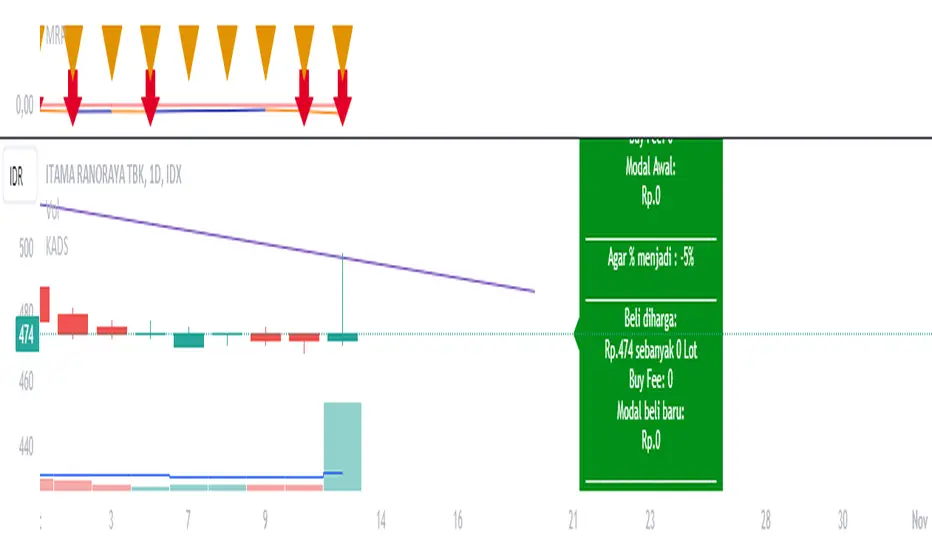
Average Down CalculatorAverage Down Calculator is an indicator for investors looking to manage their portfolio. It aids in calculating the average share price, providing insights into optimizing investment strategies. Averaging down is a strategy investors use when the price of a security they own goes down. Instead of selling at a loss, they buy more shares at the lower price to reduce the average cost per share.
There are situations where a stock's price moves contrary to your expectations. The market moves downward. Despite this, your faith in the stock persists. This indicator allowing you to strategically add more stocks to lower the average price. But You must remember, it’s not without risks, as it involves investing more money in a losing position.
This Indicator allowing you to quickly understand your new position and make informed decisions. It’s designed for easy use, regardless of your experience level with investing.
Steps to use it:
1.put buy fee from your securitas
2.next put the price of the emiten from your portofolio
3.and how many lot you have
4.next is the the taget of percentage you want it become.
5 the last you can choose, the price that you want to buy for average.
this calculator is designed to help you navigate your investment better, choose it wisely.Be aware of the risks of investing more in a declining asset and consider diversification to manage potential losses.
Total Bars CalculatorThis indicator simply plots how much bars are available to the user in the respective chart.
For Example if plot shows 5000 , therefore you have total 5000 bars of OHLC available.

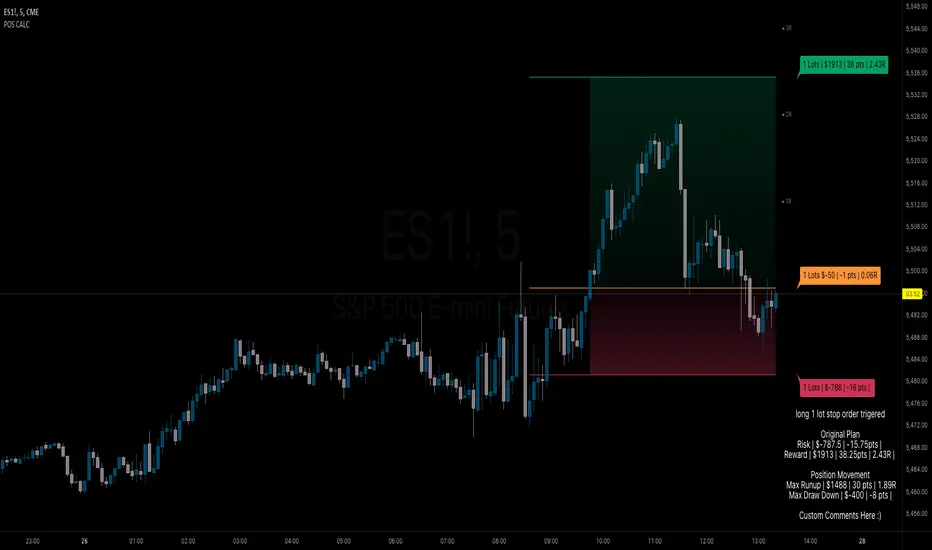
BB Position CalculatorPosition Size Calculator Instructions
Overview
The Position Size Calculator is designed to help traders automatically determine the appropriate lot size based on the dollar amount they are willing to risk. It includes features for automatic lot sizing, fixed lot risk calculations, take profit calculations (both automatic and fixed), max run-up, and max drawdown. Calculated values are displayed in ticks, points, and USD.
Key Features
• Automatic Lot Sizing: Automatically calculates lot size based on the amount of money you are willing to risk.
• Fixed Lot Risk Calculations: Provides risk calculations for fixed lot sizes.
• Take Profit Calculations: Offers both automatic and fixed take profit calculations.
• Max Run-Up and Max Drawdown: Monitors and displays the maximum run-up and drawdown of your trade.
• Detailed Metrics: Displays all calculated values in ticks, points, and USD.
Setup Instructions
1. Add and Remove for Each Position: The calculator is designed to be added to your chart for each new position. Once your preferences are set the first time, save them as your default to retain your settings for future use.
2. Adding the Indicator to Favorites:
• Use the TradingView keyboard shortcut “/” then type “pos.”
• Use the arrow key to select the Position Size Calculator and press enter.
• Close the indicator selection pop-up.
3. Setting the Trigger Price:
• A blue pop-up labeled “SET TRIGGER PRICE” will appear at the bottom of the chart.
• Click on the chart at the price level where you want to enter the trade.
4. Setting the Stop Loss:
• The pop-up will change to “SET STOP LOSS.”
• Click on the chart at the price level where your stop loss will be set.
5. Setting the Take Profit:
• The pop-up will change to “SET TAKE PROFIT.”
• Click on the chart at the price level where you want to take profit. If you have selected the option to overwrite with a set risk/reward ratio (R:R), the calculation will use this price level.
6. Setting the Trade Window Start:
• The pop-up will change to “SET TRADE WINDOW START.”
• Click on the bar in time where you want the indicator to start monitoring for price to trigger the position.
7. Adjusting the Position:
• Clicking on any part of the indicator will display draggable lines, allowing you to fine-tune the position that was previously plotted by the first four chart clicks.
Additional Notes
• Compatibility: This calculator has only been tested with futures trading.
• Customization: Once your preferences are set, save them as your default to make setup quicker for future trades.
• Support: If you have any questions or feature requests, please feel free to reach out.
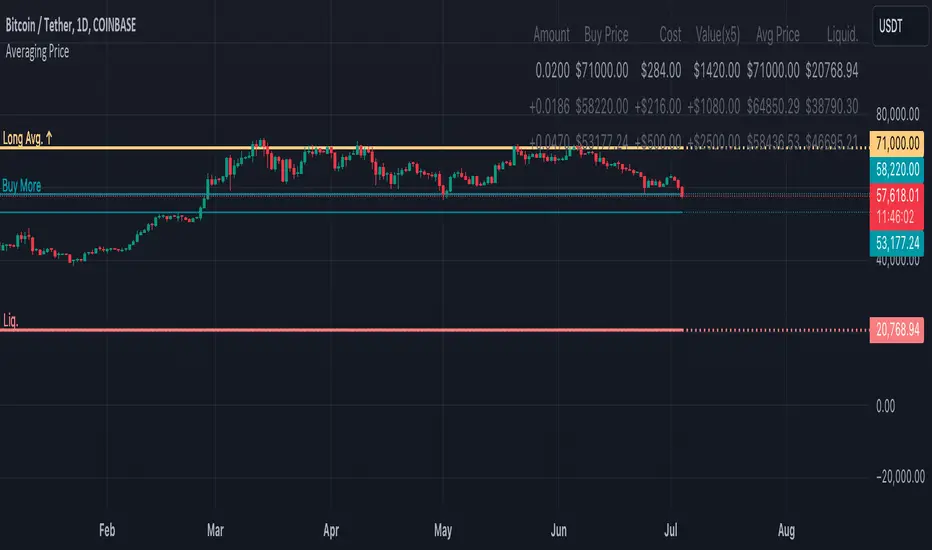
Averaging PriceA calculator that will help to survive in market storms and even to increase your deposit. This script will not help you to find the perfect price to buy, but will allow to buy more and more when the market will go down. But please, don't forget to sell some parts when position will be profitable (or close to that), so you will be able to buy more and more even on a bear market. Please, take a look at the market stress situations to correctly plan your strategy there.
How to use?
1. Define amount to want to gain to position (e.g. $1000), this amount of money you will lose in case of liquidation (for isolation mode) or entire futures deposit in case of cross mode.
2. Configure existing position (price where you entered and amount of coins you already in), if no any - it's even better. Calculator will help with the right amount for a first purchase.
3. Configure futures, closs/isolation margin mode and other things. By default it will use liquidations for isolation margin mode to buy more a slightly above. You can use these levels even for cross mode (buy by calculations for isolation mode, but really have cross configured). If you want to use other levels to buy – please use Concrete Prices field to enter them split by comma, and the script will use it for calculations.
4. A table and lines will help to see more details of how to deal with market. Play around and find a best strategy for you. But please, don't forget to CHECK THE ACCURACY OF CALCULATIONS. This script gives only preliminary number and will never be able to show exact numbers, the REAL LIQUIDATIONS MAY BE MUCH HIGHER then it shows!!!
P.S. I, as an author, do not have any responsibility on your possible losses due to following these ideas. I am using it just like idea and recheck every number. There might be any issues, and you will pay for it with your own money. So please, be mindful while using it.
Hope it will help to make your trading better and way more comfort.
Take care and good luck!
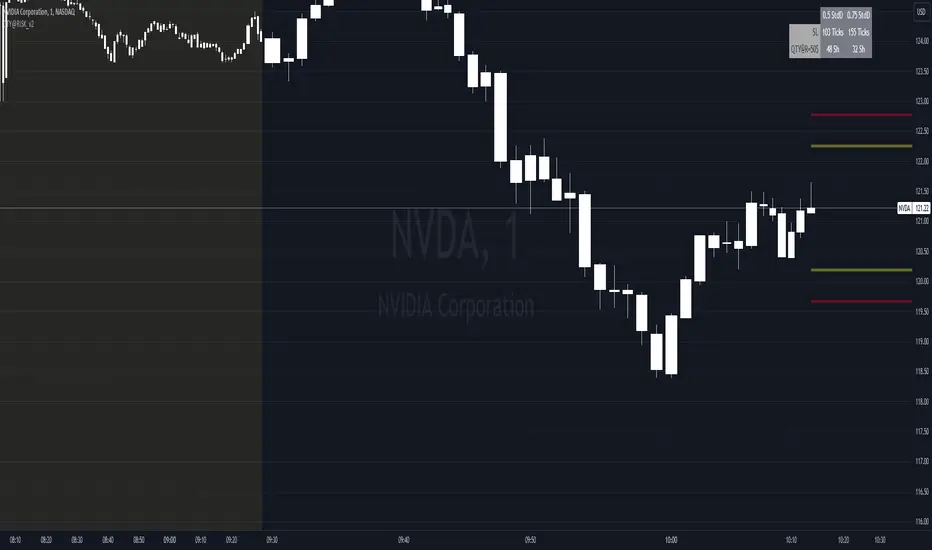
QTY@RISK VWAP based calculationVWAP Volatility-Based Risk Management Calculator for Intraday Trading
Overview
This script is an innovative tool designed to help traders manage risk effectively by calculating position sizes and stop-loss levels using the Volume Weighted Average Price (VWAP) and its standard deviation (StdDev). Unlike traditional methods that rely on time-based calculations, this approach is time-independent within the intraday timeframe, making it particularly useful for traders seeking precision and efficiency.
Key Concepts
VWAP (Volume Weighted Average Price): VWAP is a trading benchmark that represents the average price a security has traded at throughout the day, based on both volume and price. It provides insight into the average price level over a specific period, helping traders understand the market trend.
StdDev (Standard Deviation): In the context of VWAP, the standard deviation measures the volatility around the VWAP. It provides a quantifiable range that traders can use to set stop-loss levels, ensuring they are neither too tight nor too loose.
How the Script Works
1. VWAP Calculation: The script calculates the VWAP continuously as the market trades, integrating both price and volume data.
2. Volatility Measurement: It then computes the standard deviation of the VWAP, giving a measure of market volatility.
3. Stop-Loss Calculation: Using user-defined StdDev factors, the script calculates two stop-loss levels. These levels adjust dynamically based on market conditions, ensuring they remain relevant throughout the trading session.
4. Position Sizing: By incorporating your risk tolerance, the script determines the appropriate position size. This ensures that your maximum loss per trade does not exceed your predefined risk value.
How to Use the Calculator
1. Select Two VWAP StdDev Factors: Choose two standard deviation factors for calculating stop-loss levels. For example, you might choose 0.5 and 0.75 to set conservative and aggressive stop-losses respectively.
2. Set Your Trading Account Size: Enter your total trading capital. For example, $50,000.
3. Maximum Lot Size: Define the maximum number of shares you are willing to trade in a single position. For instance, 200 shares.
4. Risk Value per Trade: Input the maximum amount of money you are willing to risk on a single trade. For instance, $50.
5. Plotting Options: If you wish to visualize the stop-loss levels, enable the plot option and choose the price base for the plot, such as the closing price or the average of the high and low prices (hl2).
Example of Use
1. Initial Setup: After the market opens, wait for at least 15 minutes to ensure the VWAP has stabilized with sufficient volume data.
2. Parameter Configuration: Input your desired parameters into the calculator. For instance:
- VWAP StdDev Factors: 0.5 and 0.75
- Trading Account Size: $50,000
- Maximum Lot Size: 200 shares
- Risk Value per Trade: $50
- Plot Option: On, using "hl2" or "close" as the price base
3. Execution: Based on the inputs, the script calculates the position size and stop-loss levels. If the calculated stop-loss falls within the selected VWAP StdDev range, it will provide you with precise stop-loss prices.
4. Trading: Use the calculated position size and stop-loss levels to execute your trades confidently, knowing that your risk is managed effectively.
Advantages for Traders
- Time Independence: By relying on VWAP and its StdDev, the calculations are not dependent on specific time intervals, making them more adaptable to real-time trading conditions.
- Focus on Strategy: Novice traders can focus more on their trading strategies rather than getting bogged down with complex calculations.
- Dynamic Adjustments: The script adjusts stop-loss levels dynamically based on evolving market conditions, providing more accurate and relevant risk management.
- Flexibility: Traders can tailor the calculator to their risk preferences and trading style by adjusting the StdDev factors and risk parameters.
By incorporating these concepts and using this risk management calculator, traders can enhance their trading efficiency, improve their risk management, and ultimately make more informed trading decisions.
Average SL% Calculator with TP Levels by GorkiAverage Stop Loss And Take Profit Calculator For Futures Trading by Gorki
Description
The "Average SL% Calculator with TP Levels" script, is a simple tool for traders to plan the trades and check how much loss they are going to receive if they run this strategy. This script calculates the average price of up to four entry points, determines the percentage distance to the stop-loss level, and provides potential loss information based on margin and leverage. Additionally, it includes multiple take-profit levels to help traders systematically capture profits. Visual elements such as horizontal lines and labels make it easy to monitor key levels directly on the chart.
Why To Use This Indicator?
Risk Management: Automatically calculates the percentage distance to the stop-loss level, helping you to understand potential losses.
Profit Optimization: Supports up to four take-profit levels, enabling a structured approach to capturing gains.
Visual Clarity: Displays key levels and important information directly on the chart for easy monitoring.
Alerts: Generates alerts when the price crosses specified levels, ensuring you never miss critical trading signals.
How to Use the Script
Add the Script to Your Chart: Apply the script to your TradingView chart.
Set Input Values: Entry Points: Define up to four limit prices (LIMIT 1, LIMIT 2, LIMIT 3, LIMIT 4).
Stop-Loss: Set your stop-loss price (STOP LOSS).
Take Profits: Specify up to four take-profit levels (Take Profit 1, Take Profit 2, Take Profit 3, Take Profit 4).
Leverage: Input your leverage factor.
Margin: Enter the total margin amount for the trade.
View Calculations: The script will calculate the average entry price, the percentage distance to the stop-loss, and the potential loss based on margin and leverage.
Monitor Levels: Horizontal lines and labels will appear on the chart, showing entry points, stop-loss, and take-profit levels.
Set Alerts: Alerts will trigger when the price crosses your defined levels, helping you to take timely action.
Calculation Details
Average Price: Calculated as the mean of the specified limit prices.
Distance to Stop-Loss: Determined as the percentage difference between the average price and the stop-loss level.
Leveraged Distance: The stop-loss distance percentage multiplied by the leverage factor.
Potential Loss: Calculated by applying the leveraged distance percentage to the margin amount.
Take Profit Percentages: The percentage difference between the average price and each take-profit level.
This comprehensive indicator is a must-have for any trader looking to manage risks effectively while maximizing potential profits. Happy trading!

Trading TP SL Risk Commission Calculator🎉 Introducing Your Trading TP SL Risk Commission Calculator! 🎉
Hey there, savvy trader! 🚀 Are you looking to enhance your trading game? Meet the Trading TP SL Risk Commission Calculator! This handy tool is here to guide you through the complexities of trading, providing insights into your potential risks and rewards. Let's walk through how you can leverage it for smarter trading decisions!
Setting Up 🛠
Let's get your calculator ready for action:
Lines and Labels Visibility: Flip this switch on to see your Entry, Take Profit (TP), Stop Loss (SL), and Liquidation points displayed on your chart. It's a great way to get a visual summary of your strategy.
Input Your Trade Details: Enter your Entry Price, Take Profit Price, and Stop Loss Price. These figures are crucial for mapping out your trade.
Order Info: Specify your Order Size in USD, the amount of Leverage you're using, and your platform's Commission Rate. This customizes the calculator to fit your unique trading setup.
Customizing Your View 🎨
Table Placement & Size: Pick the location and size for your results table to appear on your screen. Tailor it to your liking, whether you prefer it out of the way or front and center.
Deciphering Your Results 📊
With your inputs in place, the calculator springs into action. Here's what you'll find:
Risk Assessment (with Emojis!): Quickly gauge your risk level with our intuitive emoji system, ranging from "⛔️⛔️⛔️" (very high risk) to "✅✅✅" (very low risk).
Profit and Loss Insights: Understand your potential take-profit gains and stop-loss implications, both as percentages and in USD. We also factor in fees to give you a clear picture.
Liquidation Alert: For those using leverage, the liquidation price calculation is crucial to avoid unpleasant surprises.
Expert Tips 💡
Stay Flexible: Market conditions evolve, so should your strategy. Revisit and adjust your inputs regularly to stay aligned with your trading goals.
Risk Emoji Check: Keep an eye on your risk level emojis. A sea of "⛔️" might signal it's time to reassess your approach.
Use Visual Guides: The on-chart lines and labels offer a quick visual reference to how your current trade measures up against your TP, SL, and liquidation thresholds.
Dive In and Trade Smart! 🚦
This calculator isn't just about making calculations; it's about empowering you to make informed trading decisions. With this tool in your arsenal, you're equipped to navigate the trading waters with confidence and clarity.

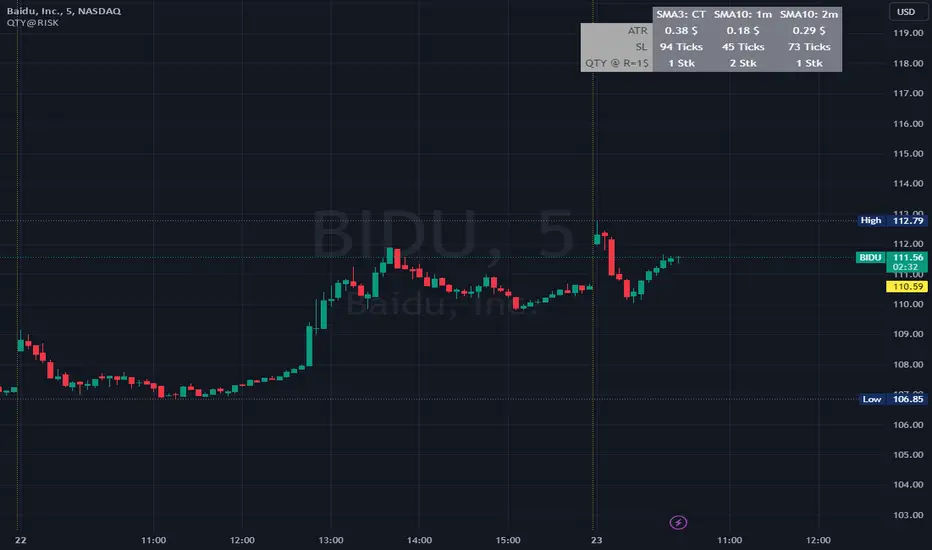
QTY@RISKWhat it does:
This indicator calculates the amount of shares to take at a predefined risk according to market volatility based on ATR.
This should help novice traders focus more on their trades and strategies instead of spending too much time calculating parameters.
How it works:
You have some configuration parameters
1. Number of candles used to calculate the ATR
2. ATR calculation method (SMA, RMA, EMA, WMA)
3. How much you want to risk in $.
4. Safety factor on ATR, to get a buffer
5. Size of your capital to be able to calculate the maximum amount of shares
6. Shares limit, if you have a certain limit of shares to take
The formula is simple:
Is the RISK/ATR * price > Equity ? then take the Equity/price
otherwise: SHARES = RISK/(ATR * safety_factor)
How to use it:
This indicator is most useful for intraday timeframe. If you trade on 1m, then use it in this timeframe
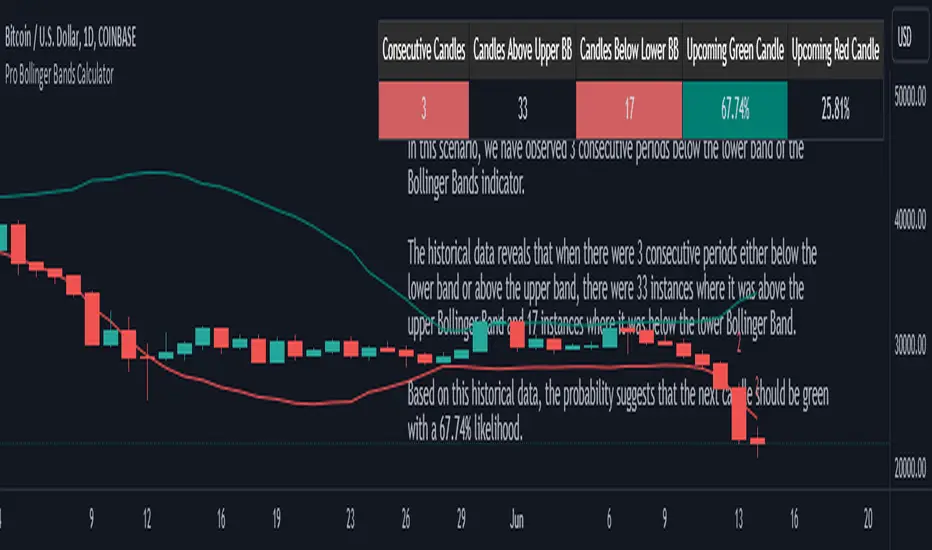
Pro Bollinger Bands CalculatorThe "Pro Bollinger Bands Calculator" indicator joins our suite of custom trading tools, which includes the "Pro Supertrend Calculator", the "Pro RSI Calculator" and the "Pro Momentum Calculator."
Expanding on this series, the "Pro Bollinger Bands Calculator" is tailored to offer traders deeper insights into market dynamics by harnessing the power of the Bollinger Bands indicator.
Its core mission remains unchanged: to scrutinize historical price data and provide informed predictions about future price movements, with a specific focus on detecting potential bullish (green) or bearish (red) candlestick patterns.
1. Bollinger Bands Calculation:
The indicator kicks off by computing the Bollinger Bands, a well-known volatility indicator. It calculates two pivotal Bollinger Bands parameters:
- Bollinger Bands Length: This parameter sets the lookback period for Bollinger Bands calculations.
- Bollinger Bands Deviation: It determines the deviation multiplier for the upper and lower bands, typically set at 2.0.
2. Visualizing Bollinger Bands:
The Bollinger Bands derived from the calculations are skillfully plotted on the price chart:
- Red Line: Represents the upper Bollinger Band during bearish trends, suggesting potential price declines.
- Teal Line: Represents the lower Bollinger Band in bullish market conditions, signaling the possibility of price increases.
3.Analyzing Consecutive Candlesticks:
The indicator's core functionality revolves around tracking consecutive candlestick patterns based on their relationship with the Bollinger Bands lines. To be considered for analysis, a candlestick must consistently close either above (green candles) or below (red candles) the Bollinger Bands lines for multiple consecutive periods.
4. Labeling and Enumeration:
To convey the count of consecutive candles displaying consistent trend behavior, the indicator meticulously assigns labels to the price chart. The position of these labels varies depending on the direction of the trend, appearing either below (for bullish patterns) or above (for bearish patterns) the candlesticks. The label colors match the candle colors: green labels for bullish candles and red labels for bearish ones.
5. Tabular Data Presentation:
The indicator complements its graphical analysis with a customizable table that prominently displays comprehensive statistical insights. Key data points within the table encompass:
- Consecutive Candles: The count of consecutive candles displaying consistent trend characteristics.
- Candles Above Upper BB: The number of candles closing above the upper Bollinger Band during the consecutive period.
- Candles Below Lower BB: The number of candles closing below the lower Bollinger Band during the consecutive period.
- Upcoming Green Candle: An estimated probability of the next candlestick being bullish, derived from historical data.
- Upcoming Red Candle: An estimated probability of the next candlestick being bearish, also based on historical data.
6. Custom Configuration:
To cater to diverse trading strategies and preferences, the indicator offers extensive customization options. Traders can fine-tune parameters such as Bollinger Bands length, upper and lower band deviations, label and table placement, and table size to align with their unique trading approaches.
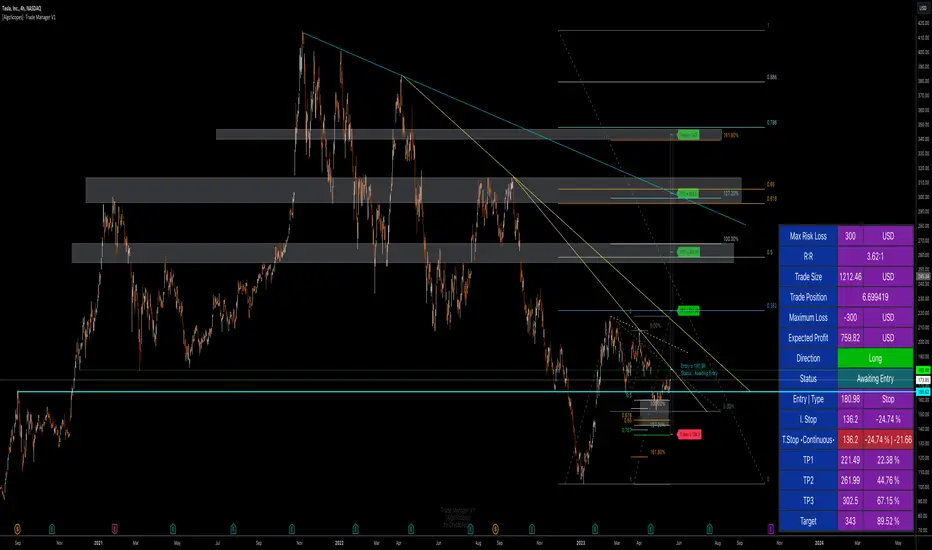
Trade Manager & Position Size Tool & PnL Tracker [AlgoScopes] V1Position size tool, leverage calculator, trade tracker, money management, trade presentation, risk reward management, margin position, live profit and loss, that's all in this one Trade Manager indicator.
The idea for this indicator comes from two years ago when I was helping a friend who, at the request of 15-20 members from our telegram group, wanted to create a paid group and share our ideas for trade with them (it started as an experiment for just a month or two and ended with 15 months with over 500 trading ideas and signals, with a complete TA chart). If I had time to create this indicator back then for members, it would have been much easier for them to be able to understand and follow the trade idea that was presented through a classic chart, with all the things that a TA must have:
Entry (as well as the reason for entry),
Stop (where the idea for the trade is no longer valid),
Target (with the reason why it is the target for that trade),
Take profits (taking part of the profit on the way to the target).
The majority of members still did not understand how much position to trade, what is the possible profit or loss, if the margin trade is how much leverage to use, in one word “money management”. The most important rule that every trader must follow is "Plan your trade and trade your plan". Learn money management and you are halfway there to becoming a successful trader. It is only after all that, you learn to use some of the "holy grail" indicators. When you have mastered those first two rules, find and master your favorite indicator or trading style (the most important thing is to stick to those two rules). The margin | leverage is also included in the script, for which there are so many dilemmas, arguments and discussions. (that many who still do not understand margin, would trade that it is not passionate if it is controlled). Too much for an introduction, especially since this indicator has so much to explain.
Most importantly, this is an invite-only indicator, and there are so many free indicators on tradingview that can also serve you very well. As far as I know, all exchanges have a calculator tool to calculate the possible profit and loss for each trade you plan to take.
*This indicator is not recommended for scalping on a 1min chart because the script, as you will see, is very complex, so the loading time is longer than with simpler indicators.
💠 ABOUT THE SCRIPT
This script is made to help manage trade. In this one indicator you have the possibility to do technical analysis, calculation for trade (four types: account size risk, trade investment, maximum to lose or position size), monitor 'PnL' (profit and loss in real time) do the calculation in the second, maybe local currency, and set an alert (from entry to any other change in trade). As the script is made for general use, some slight differences are possible for real time 'PnL' or 'ROI'. Always do a test before you start trading with larger amounts. The script is recommended for intra day trading and above. The script is not recommended for scalping on the 1min chart
💎 PROCESS TO ADD SCRIPT TO CHART
Possible trade on break example trade
As this script is invite-only, to add it to the chart you need to click on Indicators and find it under the 'Invite-Only' section. When you add the script to the chart (as it is interactive), you will be asked to do 4 steps.
🔸 'SET TRADE TIME'
Click on the chart where the last vertical bar is.
If you are already in the trade, then find the bar|time where the trade started
(you want to follow trade or trade presentation)
🔸 1) 'SET ENTRY'
Click on the horizontal level where you want to place the Entry
🔸 2) 'SET STOP'
Click on the horizontal level where you want to set the Stop
🔸 3) 'SET TARGET
Click on the horizontal level where you want to place the Target
💎 CONFIRM INPUTS
After you have done those 4 steps, a popup will appear with the relevant inputs for the trade.
You will see that some inputs are already filled (done in those 4 steps before, Entry, Stop and Target). You can correct them if you want (you will sometimes notice a longer 'space decimal' for the trade ticker, but this will not affect the calculator or other parts of the script). You can do the rest of the inputs for trade or finish it later when the script is loaded on the chart (it is recommended to fill in 'Trade Type' and 'Amount'. Don't forget to click on the "Apply" button to load the script on the chart.
💎 INDICATOR LOADED ON CHART
• When the indicator is loaded on the chart (regardless of whether it is a new trade or a trade that has already started), the following items are displayed by default:
🔸 ' Trade Table ' shows all relevant information for the trade
🔸 ' Trade Box ' with lines for Entry, Stop and Target (Take Profits if enabled)
🔸 ' Trade Box Labels ' with relevant data
• The Entry label is also the trade status label, and if the trade is not active, by default it is the Entry color
If the trade is active or when a new trade reached Entry, several new things are noticeable:
• Entry|Status label as well as status row in table will change color as well as 'Entry Reached' text
• Several extra columns relative to trade will be added to the Entry|Status label
• 3 new columns will also appear on the Trade Table (Live PnL, Live min PnL and Live ROI)
• If Trail Stop is enabled, the label will change the text to T.Stop and change color depending on whether it is in loss or profit.
• If Trail Stop is enabled, inside Trade Box trail line it will follow price action inside the box, while the label will always be fixed at the initial level
• A vertical colored line will appear on the right side of the Trade Box (depending on whether the trade is in profit or loss) which shows as in the Trade Table like Live PnL
⚪ SETTINGS
💎 Trade Account Setup
🔸 ‘Trade Type’
• 'Account Capital' or portfolio (with combination '% Capital Risk')
• 'Investment' (how much you want to invest in the trade)
• 'Risk To Lose' (how much you want to risk losing)
• 'Position Size' (exact position size, units|share for trade)
🔸 ‘Account Type’
• If the account is in another currency or you want to see possible profit | loss in local currency
• Around 150 world and local currencies supported by ICE exchange
🔸 ‘Amount’
• Amount for ‘Trade Type’
🔸 ‘% Capital Risk’
• Only for ‘Account Capital’ trade type
(i.e. 10.000 account capital with ‘% Capital Risk’ 4 is 10.000 x 4% = maximum loss 400)
🔸 ‘Leverage’
• Enable|Disable for margin trade i size of leverage (maximum 125x)
(be sure to study how and when to use margin trade through the tutorial, because margin trade can be very dangerous. If you have not perfected margin trade, there is a great possibility of losing most or even all of your account capital).
💎 TRADE ENTRY & TARGET & STOP & T.STOP & DATE | TIME
🔸 ‘Trade Date & Time’
🔸 ‘Entry’
🔸 ‘Stop’
🔸 ‘Target’
• (all was set in the previous step but can be correct/adjusted if needed)
🔸 ‘Market Entry’
• Enabled will move Entry on that bar close
🔸 ‘Liquidation’ (enabled by default)
• Show ‘Warning’ if trade Stop is close or invalid (trade will hit liquidation before reached Stop level)
🔸 ‘Trailing Type’ (4 trailing stop type)
• ‘Disabled’ (Stop will stay the entire time at the initial stop level)
• ‘Continuous’ (I.Stop follow price by distance or percent when price reached Trail start level)
• ‘Stepped’ (I.Stop moves to previous level when price reached Trail start level)
• ‘Breakeven’ (I.Stop moves to Entry when price reached Trail start level)*
* (least one Take Profit enabled)
🔸 ‘Trailing Active’ (Entry, TP1, TP2 and TP3)
• Trailing stop starts level if ‘Trailing Type’ is enabled
🔸 ‘Trailing by’ (distance or percent)
• ‘Distance’ (T.Stop will follow price action by distance)
• ‘Percent’ (T.Stop will follow price action by percent)
(this is a good example to see the difference between trailing by initial distance and initial percentage)
🔸 ‘T.Stop Distance & Percent’ (initial distance and percent for table trade only)
• Useful for bot or exchange
🔸 ‘Stop, T.Stop, Target and TP’s in PIP’s’
• Distance in PIP’s
💎 TAKE PROFIT
🔸 ‘Split Target’ (enabled by default to three take profits (TP) with auto split)
🔸 ‘Number of Take Profits’ (up to three take profits)
🔸 ‘Type’ (auto or manual)
• For manual type fill all prices to preferred level. TP percent (TP1%, TP2% and TP3% ) and Target% is how much profit you want to take on a specific level.
• PLEASE NOTE sum of all enabled ‘TP’ and targets = 100 (e.g. two TP and sets TP1% to 25 and TP2% to 35, then Target% should be 40% i.e. 25 + 35 + 40 = 100)
💎 TRADE BOX & LINES
🔸 ‘Target Line’ (color for target line and trade table ‘direction’)
🔸 ‘Stop Line’ (color for initial line and trail line)
🔸 ‘Entry Line’ (color for entry line and label & table status)
🔸 ‘To Trade Time’ (‘trade box’ left vertical line)
• By default is set to trade date and time
• Unchecked will be moved to the last bar (live time)
🔸 ‘Extended Left’ (extend Entry, Stop, Target and TP’s lines to left)
• To check for possible support|resistance
🔸 ‘Size’ (Entry, Stop, Target and TP’s lines size)
🔸 ‘PnL Box Size’ (line size for vertical box lines)
🔸 ‘Offset’ (right vertical line offset from last bar)
🔸 ‘PnL Box Color’ (right vertical line and trail fill color)
• Color changes for profit & loss
🔸 ‘Box Line Color’ (box base color)
💎 LABELS
🔸 ‘Stop & Target Labels’ (enable|disable stop and target labels)
• By default is set to small (tiny, small, normal, large, huge and auto option)
• Disabled will move all information on Entry|Status label
🔸 ‘Offset’ (label offset from trade box)
🔸 ‘Target Label’ (label color for target and all enabled tp’s)
🔸 ‘Stop Label’ (label color for initial stop and enabled trailing stop)
🔸 ‘Label Text’ (color for label text)
🔸 ‘Status Label Color’ (label table entry|status color when trade is not active)
🔸 ‘PnL’ (entry|status color for profit and loss)
🔸 ‘Size’ (by default set to normal, option tiny, small, normal, large, huge and auto)
🔸 ‘Risk to Reward’ (show risk to reward on labels)
🔸 ‘Extra Info’ (by default disabled, show extra related info for trade on labels)
• Useful if Trade Table disabled
🔸 ‘Close Trade Stats’ (by default disabled, show all info when trade is closed)
• By default is white text color for close trade stats label
💎 ALERTS
🔸 ‘Failed Trade’ (alert if price reached Stop before is active, reached Entry)
• Useful if trade need adjustment but it can also be left as it is
and alert is just warning
🔸 ‘New & Update Alert’ (alert when price reached Entry or change status to enabled Take Profits)
🔸 ‘Trade Closure Alert’ (alert when trade closed, reached Stop, Target or enabled Trail Stop)
• Alert can be in modified or default preset jSon format as well as in plain text format
• Place holders for creating alerts are :
{type}, {symbol}, {exchange}, {ticker}, {base}, {quote}, {timeframe}, {price}, {direction}, {entry}, {stop}, {tstop}, {tp1}, {tp2}, {tp3}, {target}, {tstopstatus}, {status}, {result}
* {type} placeholder is set to ‘Trade Active’, ‘Trade Update’ and ‘Trade Closed’
💎 TABLE DISPLAY
🔸 ‘Trade Table’ (enable|disable trade table)
🔸 ‘Position’ (by default set to bottom right with option bottom, middle and top with left, center and right)
🔸 ‘Size’ (by default set to normal, option tiny, small, normal, large, huge and auto)
🔸 ‘Full Table’ (by default enabled, disabled show small table without some info*)
* check picture for reference
🔸 ‘Presentation’ (by default disabled, hide all info related to PnL in trade currency)
• Useful if trade shared for presentation, hidden trade fiat|currency info)
🔸 ‘Header’ (color for trade table first row)
🔸 ‘Stats’ (color for trade table statistics row)
🔸 ‘Text’ (color for trade table text)
🔸 ‘Error’ (color for all errors if is made when trade is setup)
• Color for errors is for trade table and trade labels
🔸 ‘Fiat Price’ (by default enabled, show info for second fiat*
* if trade is in crypto and ‘quoted’ currency is not stable coin, like ETHBTC, or ‘Account Type’ is set to different currency
🔸 ‘Live Fiat Price’ (if ‘quoted’ currency enabled will show live exchange conversion)
🔸 ‘All Errors’ (enabled by default, show all error if trade setup is wrong)
• When error shows on trade, disabled this to see what|where is error
• Check below for more details
🔸 ‘Tool Tip (chart)’ (enabled show all tooltip on chart)
• Check below for more details
• When you are familiar with indicator, disable popup tooltip
💎 TOOLTIP
All possible tooltips have been added for easier understanding, especially for traders who are just learning how to place a trade. (when you perfect this indicator, you can turn off the tooltip in settings, and you can also normally use the lite version of this indicator, which does not contain all these futures)
🔸 ' Settings Tooltips’
🔸 ‘Chart Tooltips’
🔸 ‘Table Tooltips’
🔴 ERRORS
When you setup trade, not only a novice in trading, but also experienced traders can make a mistake and for this reason all possible errors are included in the indicator which will be shown on the chart by changing the color of the labels as well as on the trade table and in most of the cases and error text.
If the tooltip is enabled in the settings, you can see the reason for the error as well as the solution.
Here are some examples of possible errors.
Stay safe
PLAN YOUR TRADE AND TRADE YOUR PLAN
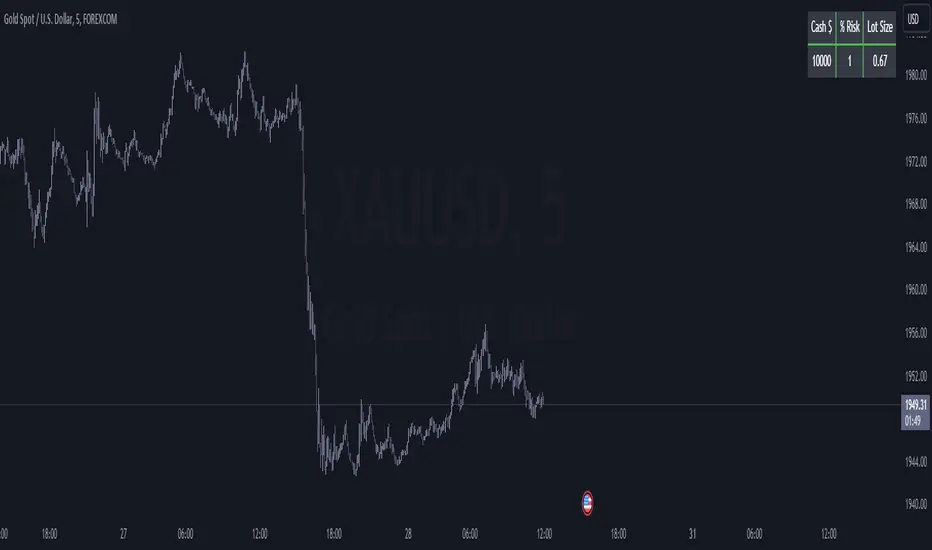
XAUUSD & XAGUSD LOT SIZE CALCUALTOR - BY ADRIANFX94This calculator is a tool designed for traders who trade on the financial markets with instruments like gold (XAUUSD) and silver (XAGUSD). It helps you determine the appropriate lot size to trade based on your account balance, desired risk percentage, and stop-loss size in pips.
Here's how it works:
Account Balance: You input your account balance in US dollars (USD). This is the amount of money you have available to trade.
Risk Percentage: You specify the percentage of your account balance that you are willing to risk on each trade. For example, if you set it to 1%, you are willing to risk 1% of your account balance on a single trade.
Stop Loss Pip Size: You set the size of your stop loss in pips. A stop loss is a risk management tool that defines the maximum amount you are willing to lose on a trade.
The calculator then uses this information along with contract sizes and pip sizes for gold and silver to calculate the appropriate lot size for each instrument. Lot size refers to the number of units or contracts you will trade.
The results are displayed in a table on the top-right corner of your trading chart. The table shows your account balance, the risk percentage you set, and the calculated lot size for gold and silver. The lot size represents the number of contracts you should trade for each instrument to align with your risk management strategy.
By using this calculator, traders can make informed decisions about their trade sizes, ensuring they manage their risk effectively and trade in a way that aligns with their account balance and risk tolerance. It helps traders avoid overexposing their accounts to risk and helps maintain a disciplined trading approach.
DCA Liquidation Calculation [ChartPrime]The DCA Liquidation Calculator is a powerful table indicator designed for both manual and bot-assisted traders who practice Dollar Cost Averaging (DCA). Its primary objective is to help traders avoid getting liquidated and make informed decisions when managing their positions. This comprehensive table indicator provides essential information to DCA traders, enabling them to plan their trades effectively and mitigate potential risks of liquidation.
Key Features:
Liquidation Price Awareness: The DCA Liquidation Calculator calculates and displays the liquidation price for each trade within your position. This critical information empowers traders to set appropriate stop-loss levels and avoid being liquidated in adverse market conditions, especially in leveraged trading scenarios.
DCA Recommendations: Whether you are executing DCA manually or using a trading bot, the DCA Liquidation Calculator offers valuable guidance. It suggests optimal entry prices and provides insights into the percentage deviation from the current market price, helping traders make well-timed and well-informed DCA decisions.
Position Sizing: Proper position sizing is essential for risk management. The DCA Liquidation Calculator helps traders determine the percentage of capital to allocate to each trade based on the provided insights. By using the recommended position sizing, traders can protect their capital and potentially maximize profits.
Profit and Loss Visualization: Gain real-time visibility into your Profit and Loss (PnL) with the DCA Liquidation Calculator. This feature allows you to monitor your trades' performance, enabling you to adapt your strategies as needed and make data-driven decisions.
Margin Call Indicators: Anticipating potential margin calls is crucial for maintaining a healthy trading account. The DCA Liquidation Calculator's smart analysis helps you identify and manage potential margin call situations, reducing the risk of account liquidation.
Capital Requirements: Before entering a trade, it's vital to know the required capital. The DCA Liquidation Calculator provides you with this information, ensuring you are adequately prepared to execute your trades without overextending your resources.
Maximum Trade Limit: Considering your available capital, the DCA Liquidation Calculator helps you determine the maximum number of trades you can enter. This feature ensures you maintain a disciplined and sustainable trading approach aligned with your financial capabilities.
Color-Coded Risk Indicators:
Green Liquidation Price Cell: Indicates that the position is considered safe from liquidation at the given parameters.
Yellow Liquidation Price Cell: Warns traders of potential liquidation risk. Exercise caution and monitor the trade closely to avoid undesirable outcomes.
Purple Liquidation Price Cell: Shows the liquidation price, but it does not necessarily indicate an imminent liquidation. Use this information to make prudent risk management decisions.
Red Row: Signals that the trade cannot be executed due to insufficient capital. Consider alternative strategies or ensure adequate capitalization before proceeding.
Settings explained:
In conclusion, the DCA Liquidation Calculator equips traders with essential tools to make well-calculated decisions, minimize liquidation risks, and optimize their Dollar Cost Averaging strategy. By offering comprehensive insights into your trading position, this indicator empowers you to navigate the markets with confidence and increase your potential for successful and sustainable trading.

(Simple) Lot Size CalculatorPip Calculator: A Guide for Traders
The Pip Calculator is a powerful tool designed to help traders calculate their lot size based on their account balance, risk percentage, and stop loss in pips. This guide will walk you through using the Pip Calculator script and explain its features.
Features of the Pip Calculator:
User-friendly UI : The Pip Calculator provides a simple and intuitive user interface, making it easy to input your account details and obtain the desired lot size.
Flexible Inputs : The Pip Calculator allows you to enter your account balance, risk percentage, and stop loss in pips. This flexibility enables you to customize the calculation according to your trading strategy.
Dynamic Currency Pair Support : The Pip Calculator supports various currency pairs and their respective pip values. The script automatically detects the currency pair of the chart you're viewing, ensuring accurate calculations.
Real-time Lot Size Display : The Pip Calculator instantly calculates and displays the lot size based on your inputs. The lot size is updated in real-time as you adjust your account balance, risk percentage, or stop loss.
Visual Representation : The Pip Calculator visually presents the calculated lot size on the chart, making it easy to understand and reference during your trading activities.
Using the Pip Calculator:
Install and Apply the Script : To use the Pip Calculator, install it as an extension on your preferred trading platform (such as TradingView). Apply the script to the chart of the desired currency pair.
Enter Account Details : In the script's user interface, enter your account balance, risk percentage, and stop loss in pips. These details are essential for accurate lot size calculation.
Review Currency Pair Support : The Pip Calculator automatically detects the currency pair of the chart. Ensure that the currency pair is supported by checking the "Currency pair not supported" message. Currently, GBPJPY is the supported pair.
Observe Real-time Lot Size : Once you've entered the required information, the script will calculate and display the lot size in real-time. The lot size is adjusted automatically as you modify your inputs.
Visualize the Lot Size : The calculated lot size is displayed on the chart as a label. You can easily view and reference the lot size while analyzing price movements.
Customize the UI : The Pip Calculator allows you to customize the appearance of the lot size label. You can adjust the text color, background color, and choose whether to show or hide the lot size label.
Note: The Pip Calculator script is intended as a tool to assist traders in determining an appropriate lot size based on their account balance, risk percentage, and stop loss. It should be used in conjunction with a comprehensive trading strategy and risk management principles.
Advantages of the Pip Calculator:
Accuracy: The Pip Calculator incorporates accurate pip values for supported currency pairs, ensuring precise lot size calculations.
Simplicity: The user-friendly interface and intuitive design make it easy for traders to calculate their lot size without complex calculations or manual estimations.
Real-time Updates: The Pip Calculator provides instant lot size updates, allowing traders to adapt their position sizing based on changes in account balance, risk percentage, or stop loss.
Visibility: The visual representation of the lot size on the chart helps traders quickly identify their desired position size and monitor it during trading activities.
The Pip Calculator offers a convenient and efficient way to determine lot sizes based on your trading parameters. By using this tool, you can enhance your risk management practices, maintain consistency, and stay aligned with your trading plan.
Disclaimer: The Pip Calculator script is provided for informational purposes only and should not be considered as financial advice. Trading in the financial markets carries inherent risks, and it is essential to perform your own analysis and consult with a qualified financial advisor before making any investment decisions.

Lot Size Calculator - GER30 Variable Contract sizeLot size calculator is built for ger30 (dax) it has variable contract size to meet all different brokers requirements
right click and move to pane above to add to chart window, in settings you can change line colour to opaque

Crypto Risk CalculatorCrypto Risk Calculator 's logical is bring the differential between Entry price and Stoploss price, your acceptable risk and your account size to calculate the loss size first then convert to the 'Amount coins' and have another feature like auto scale static target calculate by your loss size with RRR (Risk Reward Ratio). Give you to get easier to manage your orders. *** Create to use for Cryptocurrencies Future market ***
Key Features:
📈 Real-time Risk Assessment: Enter the amount you are willing to risk, and Crypto Risk Calculator will calculate the appropriate position size for your futures trade in real-time.
🎯 Target Lines and Static Target Prices based on RRR: Set your desired Risk-Reward Ratio (RRR), and let Crypto Risk Calculator auto-generate target prices according to your RRR. Additionally, place target lines to visualize the expected profit if the price hits that line.
⚙️ Customizable Parameters: Adjust risk percentage, RRR, and other parameters to tailor the tool to your trading strategy.
👁️ User-Friendly Interface: Crypto Risk Calculator features an easy-to-use and intuitive interface for both beginners and seasoned traders.
Usage:
Step 1: Place your entry price
Step 2: Place your stop loss price
Step 3: Place your target price
Step 4: Confirm your account detail
Step 5: Bring the 'Amount coins' to use
Parameter:
Initial account size
Risk percent
Leverage
Entry price
Stop price
Target price
Show your target price
Show static target prices
Number of your static target prices
Table position
Text size
Background color
Text color
Border color
Data output:
Chart
Entry price line
Stop loss price line (loss in base unit currency)
Target price line (profit in base unit currency)
Table
Account size
Risk percent
Leverage
Margin
Entry price
Stoploss price
Amounts coin
