FTC Confirmation (Daily + 60 + 30)This Pine Script strategy provides a "Full Timeframe Confirmation" (FTC) system by analyzing three timeframes: Daily, 60-min, and 30-min. It checks if all timeframes align in the same direction (either bullish or bearish) and colors the current candle accordingly. A green candle indicates a full bullish confirmation, while a maroon candle indicates a full bearish confirmation. This helps identify market trend reinforcement or rejection based on multi-timeframe analysis.
Candlestick analysis

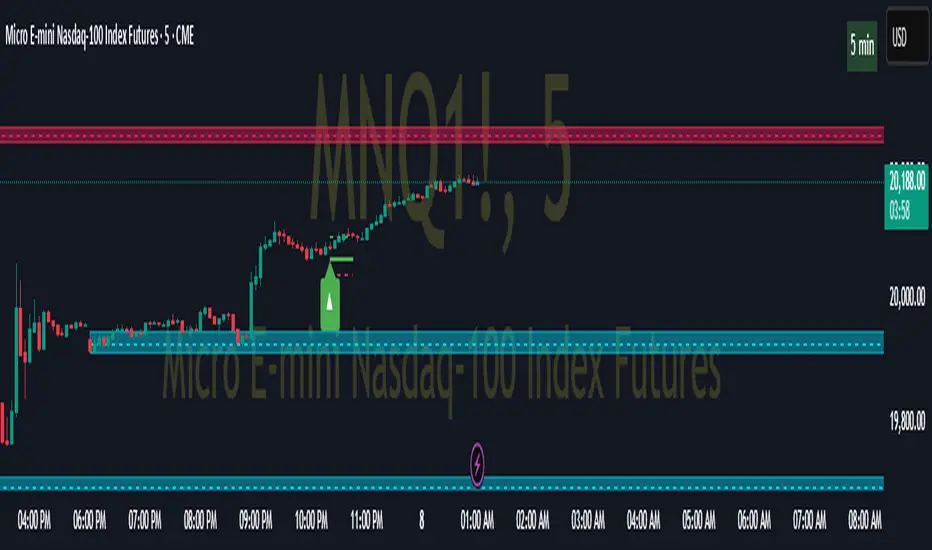
TargetTrend GOLD SCALPER v1.1✅ Does NOT use label.new() – instead uses plotshape() (which always works reliably)
✅ Still displays BUY/SELL signals as arrows on the chart
✅ Includes all levels: TP1, TP2, TP3, Stop Loss, BreakEven, and market structure detection (BOS / CHoCH)
✅ Works flawlessly in Pine Script v5 without errors or bugs

Pivot ATR Zones [v6]🟩 Pivot ATR Zones
Overview:
The Pivot ATR Zones indicator plots dynamic support and resistance zones based on pivot highs and lows, combined with ATR (Average True Range) volatility levels. It helps traders visually identify potential long and short trade areas, along with realistic target and stop loss zones based on market conditions.
Features:
Automatically detects pivot highs and lows
Draws ATR-based entry zones on the chart
Plots dynamic take-profit and stop-loss levels using ATR multipliers
Color-coded long (green) and short (red) zones
Entry arrow markers for clearer trade visualization
Real-time alerts when new zones form
Best For:
Scalpers, intraday traders, and swing traders who want a visual, volatility-aware way to mark potential trade areas based on key pivot structures.
How to Use:
Look for newly formed green zones for long opportunities and red zones for short setups.
Use the dashed lines as dynamic take-profit and stop levels, tuned to the current ATR value.
Combine with other confirmation tools or indicators for optimal results.

Vietnamese Market Structure With CountersThis indicator is designed to track Market Structure with Swing-Low Breakdowns and Swing-High Breakups specifically tailored for the Vietnamese stock market, though it can be applied elsewhere too. By default, it uses a 10-period EMA to dynamically detect key turning points in price action and count significant breakdowns or breakups from previous swing levels.
As an open source, you can modify the source code to match your needs.
What it does:
Detects when price breaks below previous swing lows or above previous swing highs.
Plots swing levels for both highs and lows.
Displays labeled counters on the chart to show how many consecutive breakdowns or breakups have occurred.
Helps traders identify trend shifts and possible exhaustion in moves.
Why it's useful:
This tool is great for visually tracking market momentum and structure changes — especially in trending or volatile environments. It emphasizes structure over indicators, helping you understand price behavior in a simplified, intuitive way.
License:
This script is published under the Mozilla Public License 2.0. Feel free to use, modify, and contribute!
Created with care by @doqkhanh.
If you find it useful, consider leaving a comment or sharing it with others!

Pullback Setup HelperThe Pullback Setup Helper is a visual tool designed to assist traders in identifying high-probability pullback entry zones in both bullish and bearish trends. It dynamically calculates support and resistance pullback areas using a combination of recent price extremes and ATR-based volatility measures.
The indicator plots two main zones: one for potential long setups beneath recent highs, and another for short setups above recent lows. These zones are derived from configurable multipliers of the ATR to define depth and width, with an additional buffer to allow for slight overshoots or market noise.
Signals are generated when price enters a pullback zone and closes in the direction of the trend, using a relaxed condition (close > previous close for longs, close < previous close for shorts) to increase signal frequency. Entry signals appear as triangles on the chart, with optional alerts available for both long and short scenarios.
This tool is best used as a contextual guide to support trend-continuation trades, particularly when combined with additional confirmation from momentum or volume indicators.

MA Crossover Volume Long Strategy✅ Strategy Logic:
This strategy is designed for long-only short-term trades and works across multiple timeframes. It uses a combination of price moving average crossover and volume moving average confirmation to determine entry signals, and applies dynamic take-profit (trailing) and fixed stop-loss mechanisms.
🟢 Entry Conditions (Long Only):
A long position is opened when all the following conditions are met:
Price crosses above the 25-period Simple Moving Average (SMA) — a bullish signal.
The 5-period volume moving average is greater than the 60-period volume moving average — indicating rising or strong volume support.
No current open position — to prevent multiple entries during the same signal.
🔴 Exit Conditions:
The strategy closes the position using two types of risk management:
1. Take Profit with Trailing Logic:
Once the price increases by 5% or more from the entry price, a trailing stop is activated.
The trailing stop follows the price with a 1% trailing offset.
If the price drops 1% from its highest point after reaching the 5% profit threshold, the position is closed to secure profits.
2. Fixed Stop Loss:
If the price drops 1% below the entry price, the position is closed automatically to limit the loss.
⚙️ Other Settings:
No short trades: This strategy is long-only.
No pyramiding: Only one position at a time is allowed. New entries are blocked until the current position is closed.
User-configurable parameters:
Price MA length (default: 25)
Volume short MA length (default: 5)
Volume long MA length (default: 60)
🧠 Summary:
This strategy combines trend-following (price above MA) with volume confirmation to identify strong bullish moves, and uses a smart trailing profit mechanism to lock in gains, while strictly capping downside risk at 1% per trade. It is suitable for intraday or swing trading depending on the chosen timeframe.

Combined Indicator: SQZMOM + Supertrend + Ultimate MAtyphonha
very good indicator
ejbvqekrfqe
evoqhuebfvpjqenfvqweDVC
qwrefojqhwdkqcv evfjqwef

ORB ModifedThis strategy is all about waiting for the market to pick a direction in the first 15 minutes.
When the price breaks out of this range, you enter a trade with a smart stop-loss setup.
As the price moves up, you follow it closely using "shelves" (past price levels) to protect your profits without getting out too soon.
It’s like moving your safety net up as you climb a ladder so you don’t fall all the way back down.

Perfect Setup Visuals)📌 Perfect Setup Visuals — Reversals, Engulfing, MACD, Equal Highs/Lows
This all-in-one visual-only indicator is designed to help traders quickly spot powerful technical setups on any asset or timeframe. It combines multiple high-probability price action and momentum tools to highlight key areas of interest on your chart — without auto-trading or repainting signals.
✅ Features Included:
EMA Trend Filter – Plots fast and slow EMAs to visualize trend direction.
Bullish/Bearish Engulfing Candles – Highlights strong momentum shifts via engulfing bar patterns (optional).
Equal Highs & Lows Detection – Shows potential liquidity zones where price may reverse or break out (optional).
Reversal Signals – Two confirmation methods:
Wick Reversals (e.g., hammer, shooting star)
RSI Divergence (basic bullish/bearish divergence logic)
MACD Histogram & Lines – Optional momentum visualization in a separate pane.
⚙️ Fully Customizable:
Toggle each feature individually via settings.
Compatible with all timeframes and assets: crypto, forex, stocks, indices, and more.

Break of Structure Rally GapThe script will still identify:
Break of structure above key levels
Formation of fair rally gaps
Entry signals when price pulls back to the gap zone
All of this will work properly with the time filter (9:30 AM to 11:00 AM) and volume requirements you specified. The indicator should now compile without errors.

Enhanced RSI with Divergence & SignalsEnhanced RSI with Divergence Signals. Will now display crossovers indicators

CPR - pivot lucifer v5Multi-Timeframe CPR + S/R Levels (Daily, Weekly, Monthly, Yearly
This indicator plots the central pivot range (CPR) along with the S1–S4 and R1–R4 levels across multiple timeframes.
Includes dynamic daily, weekly, monthly, and yearly pivot zones with toggleable visibility.
Supports future (next period) CPR projections and previous highs/lows.
Now upgraded to Pine Script v5 with alerts and optional chart labels.

Gap Fill Mean Reversion Strategy – NASDAQ 3-MinuteThis is a carefully optimized mean-reversion strategy that targets intraday gap fills on the NASDAQ (US100) using 3-minute charts.
Core Logic:
- Detects gap up/down openings larger than 0.5%
- Confirms reversal with a 3-candle pattern
- Enters only in the direction of the 50/200 EMA trend
- Shorts are filtered using RSI > 60
Risk Management:
- TP: 2 × ATR
- SL: 1 × ATR (capped with max dollar loss)
- Optional trailing stop after 2 × ATR profit
- Only 1 trade per day
Results (Backtest - NASDAQ 3min):
- ~46% win rate
- +681 USD net profit
- 69 trades
- Max drawdown: very low
- Suitable for automation and alert-based execution
Note:
Works ONLY on NASDAQ (US100) 3-minute chart. Other assets or timeframes are not supported due to lack of reliable gaps.
Tested and stable – ready for serious use.

Sniper Bottom Catch BuyBottom Catcher.... Gotta Catch Em All
This is my first custom indicator. many more to come. this is just a test

ORB ModifiedThis strategy is all about waiting for the market to pick a direction in the first 15 minutes.
When the price breaks out of this range, you enter a trade with a smart stop-loss setup.
As the price moves up, you follow it closely using "shelves" (past price levels) to protect your profits without getting out too soon.
It’s like moving your safety net up as you climb a ladder so you don’t fall all the way back down.

Abhi's ORB + BOS + FVG + B&R Combocombination of orb/ bos +fvg and break and retest
currently working on it , trying to refine it in every way possible

IBD Style Candles [tradeviZion]IBD Style Candles - Visualize Price Bars Like the Pros
Transform your chart with institutional-grade IBD-style bars and customizable moving averages for both daily and weekly timeframes. This indicator helps you visualize price action the way professionals at Investors Business Daily do.
What This Indicator Offers:
IBD-style bar visualization (clean, professional appearance)
Customizable coloring based on price movement or previous close
Automatic timeframe detection for appropriate moving averages
Four customizable moving averages for daily timeframes (10, 21, 50, 200)
Four customizable moving averages for weekly timeframes (10, 20, 30, 40)
Options to use SMAs or EMAs with adjustable colors and line widths
"The IBD-style bars provide a cleaner view of price action, allowing you to focus on market structure without the visual noise of traditional candles."
How to Apply the IBD-Style Bars:
On your TradingView chart, select "Bars" as the chart type from the main chart type selection menu (next to the time interval options).
Right-click on the chart and select "Settings".
Go to the "Symbol" tab.
Uncheck the "Thin Bars" option to display thicker bars.
Set the "Up Color" and "Down Color" opacity to 0 for a clean IBD-style appearance.
Enable "IBD-style Candles" from the script's settings.
To revert to the original chart style, repeat the above steps and restore the default settings.
Moving Average Configuration:
The indicator automatically detects your timeframe and displays the appropriate moving averages:
Daily Timeframe Moving Averages:
10-day moving average (SMA/EMA)
21-day moving average (SMA/EMA)
50-day moving average (SMA/EMA)
200-day moving average (SMA/EMA)
Weekly Timeframe Moving Averages:
10-week moving average (SMA/EMA)
20-week moving average (SMA/EMA)
30-week moving average (SMA/EMA)
40-week moving average (SMA/EMA)
Usage Tips:
Enable "Color bars based on previous close" to identify momentum shifts based on prior candle closes
Customize colors to match your chart theme or preference
Enable only the moving averages relevant to your trading strategy
For cleaner charts, reduce the number of visible moving averages
For stock trading, the 10/21/50/200 daily and 10/40 weekly MAs are most commonly used by institutions
// Example configuration for different timeframes
if timeframe.isweekly
// Weekly configuration
showSMA1_Weekly = true // 10-week MA
showSMA4_Weekly = true // 40-week MA
else
// Daily configuration
showMA2_Daily = true // 21-day MA
showMA3_Daily = true // 50-day MA
showMA4_Daily = true // 200-day MA
While the IBD style provides clarity, remember that no visualization method guarantees trading success. Always combine with proper analysis and risk management.
If you found this indicator helpful, please consider leaving a comment or suggestion for future improvements. Happy trading!

Candle Pattern Recognition EngineDisclaimer: The content provided in my scripts, indicators, ideas, algorithms, and systems is for educational and informational purposes only.
Candle Pattern Recognition Engine
All Major Candle Patterns with Volume, RSI, and EMA Filters
What It Does:
This advanced indicator detects all major candlestick patterns in real time and filters them based on key technical context. Unlike other pattern tools that flood the screen with noise, this engine only highlights high-probability signals confirmed by:
🔍 Volume surges
📈 RSI trend bias
📊 EMA alignment (20-period)
🔎 Patterns Detected:
✅ Bullish & Bearish Engulfing
✅ Hammer & Inverted Hammer
✅ Shooting Star & Hanging Man
✅ Doji
✅ Morning & Evening Stars
✅ Inside & Outside Bars
🔧 Key Features:
🧪 Smart Filters: Contextual validation based on volume, RSI, and EMA trend
🧭 Multi-Timeframe Compatible: Works across all intervals
🔔 Built-in Alerts: Get notified when powerful patterns form
🧼 Noise Reduction: No random dots — only context-approved setups
📈 How to Use:
Labels appear at candles where context and price align
Turn filters on/off via the input menu for testing sensitivity
Combine with your own strategy or other indicators for confirmation


Hourly Reversal StrategySummary of the Hourly Reversal Strategy Pine Script
This script is designed to capitalize on hourly candle reversals at precise time intervals during each hour, primarily:
15 minutes into the hour
30 minutes into the hour
45 minutes into the hour
1️⃣ Logic Explanation
The script checks if the hourly candle is bullish or bearish:
If bullish → It looks for a reversal after a 15 or 30-minute push upwards.
If bearish → It looks for a reversal after a 15 or 30-minute push downwards.
These reversals are identified by monitoring the hourly candle's behavior and the specific minute mark within the hour.

OpSindoor - First 15-Min Breakout StrategyOpen 15 Mins candle Breakout with zones to avoid fakeouts, entries only outside the grey zone

XAU/USD Scalping Signal Bot [Phase 3]XAU/USD Scalping Visual Bot 1.0
Description:
This is Phase 1 of a multi-phase scalping bot built for XAU/USD (Gold/USD) on TradingView using Pine Script v5.
It automatically detects and visually marks bullish and bearish order blocks using rectangles (green for bullish, red for bearish), based on key candle structure.
Also includes the core logic for TDI (Traders Dynamic Index) to prepare for directional signals and trend confirmation in later phases.
Designed for scalpers on the 1-minute chart but supports higher timeframe trend analysis.
Key Features:
• Auto-detection of order blocks
• Visual zones drawn across the chart
• TDI RSI logic groundwork
• Full support for future visual overlays, alerts, SL/TP, and pip projection
Ideal for traders looking to manually confirm scalping setups or develop automated strategies.
