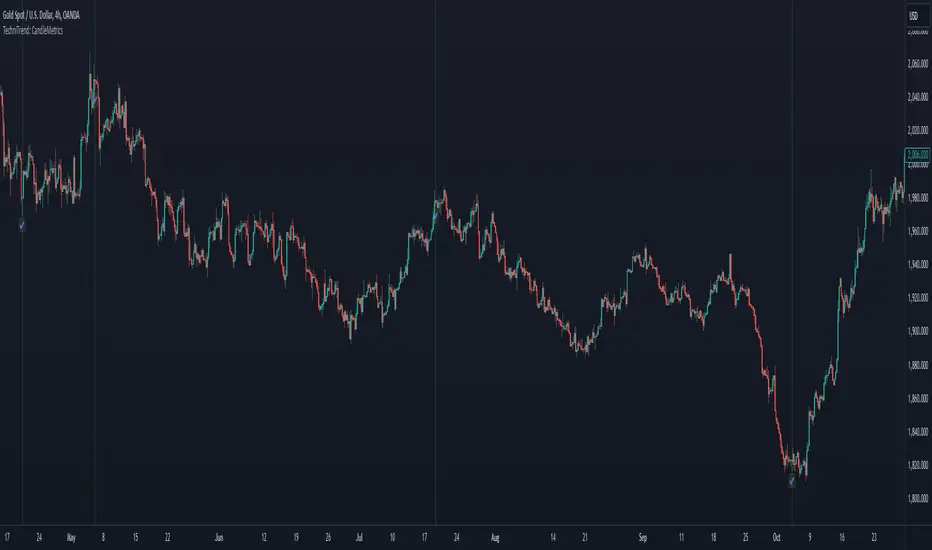
TechniTrend: CandleMetrics🟦 Overview
The TechniTrend: CandleMetrics Indicator is a powerful tool designed to give traders an in-depth analysis of candlestick structures. This indicator allows users to identify potential reversal points, trend continuations, and other crucial market behaviors by examining key ratios between candle components—such as body, shadow, and overall range—alongside volume conditions. The advanced filtering options offer flexibility for both novice and experienced traders, enabling tailored setups to suit different trading strategies.
🟦 Key Features
🔸Customizable Ratios: Set thresholds for Body-to-Range, Shadow-to-Range, Upper Shadow-to-Range, and Lower Shadow-to-Range ratios.
🔸Volume-Based Filters: Integrate volume conditions to strengthen the reliability of signals.
🔸Flexible Conditions: Choose whether filters should work independently or in combination, allowing for precise pattern identification.
🔸Visual Markers: Mark potential signals with a distinct background color and symbols on the chart.
🔸Alerts: Receive notifications for each selected condition, ensuring you never miss an opportunity.
🟦 How It Works
The CandleMetrics Indicator operates by analyzing the relationship between different components of each candlestick, combined with volume data to determine the strength of signals. Here’s a detailed breakdown of each feature:
🔸 Body to Range Ratio:
This filter compares the size of the candle's body to its total range (from high to low).
Example Setting: If you’re interested in spotting candles with small bodies relative to their total range, you might set the Body-to-Range Ratio to “Less than 0.3.”
🔸 Shadow to Range Ratio:
This examines the combined size of both shadows (upper and lower) relative to the entire candle range.
Example Setting: Use a Shadow-to-Range Ratio set to “More than 0.8” to find candles with significant wick lengths, suggesting market indecision.
🔸 Upper Shadow to Range Ratio:
This filter assesses the proportion of the upper shadow (wick) in relation to the candle’s full range.
Example Setting: “Less than 0.05” can help identify situations where the upper shadow is minimal, indicating strong downward pressure.
🔸 Lower Shadow to Range Ratio:
It measures the lower shadow compared to the entire candle range.
Example Setting: “More than 0.7” is useful for detecting potential rejection patterns at lower prices, hinting at a possible bullish reversal.
🔸 Volume Filter:
Integrates volume data to verify the reliability of each candle pattern.
Example Setting: Apply a Volume Filter Length of 100 with an SMA type to smooth volume data over a longer period, filtering out short-term noise and focusing on significant volume shifts.
🟦 Combining Filters
The indicator offers an option to Combine Filters. When this setting is enabled, all selected conditions must be met simultaneously for a candle to be marked. If disabled, each condition functions independently, allowing more flexibility in detecting diverse patterns.
🟦 Examples & Use Cases
🔸Example 1: Spotting Reversal Opportunities
I used the following configuration to find potential bullish reversals:
Upper Shadow to Range Ratio: “Less than 0.05” – Looking for candles with almost no upper shadow.
Lower Shadow to Range Ratio: “More than 0.7” – Highlighting candles with a significant lower shadow.
Volume Filter Length: 100 with SMA.
This setup effectively highlights candles where price rejection is happening at lower levels, suggesting a potential trend reversal to the upside.
🔸Example 2: Detecting Market Uncertainty
If you want to focus on candles showing market hesitation, try:
Shadow to Range Ratio: “More than 0.85” – Emphasizing long-wick candles that could indicate indecision.
Disable Combine Filters to allow flexibility, marking any candle meeting the above criteria.
🟦 Detailed Explanation of Each Option
Here’s a clear and concise breakdown of each option for a better understanding:
1. Body to Range Ratio
Purpose: This ratio shows how significant the candle's body is compared to its overall range. A smaller body-to-range ratio can indicate a potential reversal if the market appears indecisive.
How to Use: Increase the ratio to filter for stronger trend candles; decrease it to identify reversal or indecision candles.
2. Shadow to Range Ratio
Purpose: This filter captures the size of both shadows relative to the candle's total range. A larger ratio often points to market hesitation, while a smaller ratio suggests a decisive move.
How to Use: Adjust this filter to focus on candles with long wicks (indecision) or short wicks (decisiveness).
3. Upper Shadow to Range Ratio
Purpose: Helps to identify candles with strong downward moves by focusing on the upper wick length. A small upper shadow can imply sellers' dominance.
How to Use: Lower the ratio to detect candles with minimal upward rejection.
4. Lower Shadow to Range Ratio
Purpose: Targets candles with strong buying pressure by analyzing the lower shadow. A larger lower shadow may indicate a bullish reversal.
How to Use: Increase the ratio to spot rejection candles with significant lower shadows.
5. Volume Filter
Purpose: Adds a volume component to verify the validity of each candlestick pattern. Higher-than-average volume often signifies the strength of a move.
How to Use: Adjust the filter length and type to smooth out volume fluctuations based on your trading timeframe.
🟦 Indicator Alerts
Each filter has its own alert configuration, enabling traders to stay updated on market conditions that meet their selected criteria. You can customize alerts to trigger whenever a condition is met, helping to manage trades even when away from the screen.
Candlestickpattern
Engulfing Pattern & Impulse [UAlgo]The Engulfing Pattern & Impulse is a tool designed for technical traders who utilize price action and volume analysis to assess market trends and potential reversals. This indicator identifies two powerful trading signals: Engulfing Patterns and Volume Impulses, which are essential components for evaluating potential bullish or bearish market momentum.
Engulfing Patterns are classic candlestick formations often associated with reversals or trend continuations, depending on the overall trend context. This indicator highlights both bullish and bearish engulfing patterns based on configurable criteria such as trend detection settings, comparison with average body size, and a customizable body multiplier for validation. The Volume Impulse feature signals moments of significant volume compared to historical levels, which often precede substantial price movements. Together, these features provide traders with a versatile tool for better timing entry and exit points.
The indicator also offers an adaptive trend detection system, allowing traders to choose from multiple methods (e.g., SMA50 or SMA50/SMA200 combinations) to assess the trend context, making it ideal for various market conditions.
🔶Key Features
Engulfing Pattern Detection: Identifies bullish and bearish engulfing patterns with customizable parameters, including body length and average size comparison.
Configurable trend basis: Choose between SMA50 or SMA50 with SMA200 to define trend direction.
Body size multiplier: Adjust the size threshold for valid engulfing patterns, providing flexibility based on market conditions.
Volume Impulse Signal: Highlights volume spikes that meet or exceed a specified multiplier, which can indicate increased buying or selling interest.
Customizable volume period and multiplier: Allows you to tailor the volume impulse detection based on the instrument’s average volume behavior.
Trend Detection Options: Select different trend detection methods to suit various trading styles and instruments.
SMA50-based detection: Classifies the trend based on the position of price relative to the 50-period SMA.
SMA50 and SMA200 combination: Incorporates a dual-moving average approach, classifying trends based on the relationship between price, SMA50, and SMA200.
Enhanced Visualization: Distinguishes bullish and bearish signals with customizable colors, providing clear and immediate visual cues for easy interpretation.
Custom label colors: Allows you to set distinct colors for bullish, bearish, and neutral signals for quick identification.
Pattern filtering: Enable or disable specific patterns (Bullish, Bearish, or Both) based on your trading preferences.
🔶 Interpreting Indicator
Bullish Engulfing Pattern: Indicates a potential bullish reversal in a downtrend. This signal occurs when a white candlestick with a body size exceeding a specified multiplier completely engulfs the previous black candlestick. The pattern will display a “BE” label below the candle if it meets the criteria, signaling potential upward momentum.
Bearish Engulfing Pattern: Indicates a potential bearish reversal in an uptrend. A black candlestick with a body size exceeding the specified multiplier fully engulfs the previous white candlestick, signaling possible downward movement. The “BE” label appears above the candle to denote this pattern.
Volume Impulse Up: Displays a “VI” label below the candle when the volume surpasses the defined multiplier, and the price closes higher than it opened, indicating strong upward buying interest.
Volume Impulse Down: Displays a “VI” label above the candle when the volume meets or exceeds the specified threshold, and the price closes lower than it opened, signaling strong selling pressure.
Indicator uses the SMA50 and SMA200 to determine trend direction due to their popularity in technical analysis as indicators of medium- and long-term trends. The SMA50 reflects the average price over the past 50 periods, providing insight into intermediate trends, while the SMA200 is often used to identify the broader trend direction. These SMAs help traders quickly assess whether the market is in an uptrend, downtrend, or consolidation phase, enhancing decision-making for both short-term and long-term strategies.
🔶 Disclaimer
Use with Caution: This indicator is provided for educational and informational purposes only and should not be considered as financial advice. Users should exercise caution and perform their own analysis before making trading decisions based on the indicator's signals.
Not Financial Advice: The information provided by this indicator does not constitute financial advice, and the creator (UAlgo) shall not be held responsible for any trading losses incurred as a result of using this indicator.
Backtesting Recommended: Traders are encouraged to backtest the indicator thoroughly on historical data before using it in live trading to assess its performance and suitability for their trading strategies.
Risk Management: Trading involves inherent risks, and users should implement proper risk management strategies, including but not limited to stop-loss orders and position sizing, to mitigate potential losses.
No Guarantees: The accuracy and reliability of the indicator's signals cannot be guaranteed, as they are based on historical price data and past performance may not be indicative of future results.

STANDARD DEVIATION INDICATOR BY WISE TRADERWISE TRADER STANDARD DEVIATION SETUP: The Ultimate Volatility and Trend Analysis Tool
Unlock the power of STANDARD DEVIATIONS like never before with the this indicator, a versatile and comprehensive tool designed for traders who seek deeper insights into market volatility, trend strength, and price action. This advanced indicator simultaneously plots three sets of customizable Deviations, each with unique settings for moving average types, standard deviations, and periods. Whether you’re a swing trader, day trader, or long-term investor, the STANDARD DEVIATION indicator provides a dynamic way to spot potential reversals, breakouts, and trend-following opportunities.
Key Features:
STANDARD DEVIATIONS Configuration : Monitor three different Bollinger Bands at the same time, allowing for multi-timeframe analysis within a single chart.
Customizable Moving Average Types: Choose from SMA, EMA, SMMA (RMA), WMA, and VWMA to calculate the basis of each band according to your preferred method.
Dynamic Standard Deviations: Set different standard deviation multipliers for each band to fine-tune sensitivity for various market conditions.
Visual Clarity: Color-coded bands with adjustable thicknesses provide a clear view of upper and lower boundaries, along with fill backgrounds to highlight price ranges effectively.
Enhanced Trend Detection: Identify potential trend continuation, consolidation, or reversal zones based on the position and interaction of price with the three bands.
Offset Adjustment: Shift the bands forward or backward to analyze future or past price movements more effectively.
Why Use Triple STANDARD DEVIATIONS ?
STANDARD DEVIATIONS are a popular choice among traders for measuring volatility and anticipating potential price movements. This indicator takes STANDARD DEVIATIONS to the next level by allowing you to customize and analyze three distinct bands simultaneously, providing an unparalleled view of market dynamics. Use it to:
Spot Volatility Expansion and Contraction: Track periods of high and low volatility as prices move toward or away from the bands.
Identify Overbought or Oversold Conditions: Monitor when prices reach extreme levels compared to historical volatility to gauge potential reversal points.
Validate Breakouts: Confirm the strength of a breakout when prices move beyond the outer bands.
Optimize Risk Management: Enhance your strategy's risk-reward ratio by dynamically adjusting stop-loss and take-profit levels based on band positions.
Ideal For:
Forex, Stocks, Cryptocurrencies, and Commodities Traders looking to enhance their technical analysis.
Scalpers and Day Traders who need rapid insights into market conditions.
Swing Traders and Long-Term Investors seeking to confirm entry and exit points.
Trend Followers and Mean Reversion Traders interested in combining both strategies for maximum profitability.
Harness the full potential of STANDARD DEVIATIONS with this multi-dimensional approach. The "STANDARD DEVIATIONS " indicator by WISE TRADER will become an essential part of your trading arsenal, helping you make more informed decisions, reduce risks, and seize profitable opportunities.
Who is WISE TRADER ?
Wise Trader is a highly skilled trader who launched his channel in 2020 during the COVID-19 pandemic, quickly building a loyal following. With thousands of paid subscribed members and over 70,000 YouTube subscribers, Wise Trader has become a trusted authority in the trading world. He is known for his ability to navigate significant events, such as the Indian elections and stock market crashes, providing his audience with valuable insights into market movements and volatility. With a deep understanding of macroeconomics and its correlation to global stock markets, Wise Trader shares informed strategies that help traders make better decisions. His content covers technical analysis, trading setups, economic indicators, and market trends, offering a comprehensive approach to understanding financial markets. The channel serves as a go-to resource for traders who want to enhance their skills and stay informed about key market developments.

Master Candle Breakout V1 Master Candle Breakout V1 - Indicator Description
The Master Candle Breakout V1 indicator is a powerful price action-based tool designed to help traders identify and capitalize on breakout opportunities from consolidation phases. This indicator is particularly useful for identifying master candles, which are large candles that encompass the range of subsequent candles, creating a key level of support or resistance. Once the price breaks above or below the range of the master candle, the indicator provides clear buy or sell signals, allowing traders to ride the momentum of the breakout.
Key Features:
Master Candle Detection: The indicator identifies master candles based on a user-defined period, marking them on the chart as critical breakout points.
Buy and Sell Signals: When the price breaks above the master candle's high, a buy signal is plotted. Similarly, when the price breaks below the master candle's low, a sell signal is generated. These signals are displayed on the chart with customizable shapes (diamonds, arrows, circles, crosses) and colors for easy visualization.
Stop-Loss Level Display: For risk management, the indicator calculates and plots a stop-loss level based on user-defined ticks above or below the master candle's high or low. The stop-loss value is shown as a label next to the signal, helping traders manage risk effectively.
Customizable Colors and Shapes: Users can fully customize the appearance of the signals, including the color of the buy/sell diamonds, the stop-loss label text color, and the type of shape used for the signals.
Versatile Application: The Master Candle Breakout V1 can be applied to any timeframe and market, from forex and stocks to commodities and cryptocurrencies, making it a highly versatile tool for traders of all types.
How to Use:
Master Candle Period: Define how many candles should follow the master candle for confirmation.
Stop Loss Ticks: Set the number of ticks above or below the master candle to define your stop-loss level.
Entry Signals: Once the price closes outside the high or low of the master candle, enter the trade accordingly (buy on breakouts above the high, sell on breakouts below the low).
Risk Management: Use the stop-loss level provided by the indicator to minimize losses and protect your capital.
This indicator is perfect for traders who prefer a simple, price-action-based strategy and want to avoid the clutter of traditional indicators. By focusing on the core principle of breakouts, Master Candle Breakout V1 helps traders quickly identify consolidation zones and potential breakout trades.

Judas Swing ICT 01 [TradingFinder] New York Midnight Opening M15🔵 Introduction
The Judas Swing (ICT Judas Swing) is a trading strategy developed by Michael Huddleston, also known as Inner Circle Trader (ICT). This strategy allows traders to identify fake market moves designed by smart money to deceive retail traders.
By concentrating on market structure, price action patterns, and liquidity flows, traders can align their trades with institutional movements and avoid common pitfalls. It is particularly useful in FOREX and stock markets, helping traders identify optimal entry and exit points while minimizing risks from false breakouts.
In today's volatile markets, understanding how smart money manipulates price action across sessions such as Asia, London, and New York is essential for success. The ICT Judas Swing strategy helps traders avoid common pitfalls by focusing on key movements during the opening time and range of each session, identifying breakouts and false breakouts.
By utilizing various time frames and improving risk management, this strategy enables traders to make more informed decisions and take advantage of significant market movements.
In the Judas Swing strategy, for a bullish setup, the price first touches the high of the 15-minute range of New York midnight and then the low. After that, the price returns upward, breaks the high, and if there’s a candlestick confirmation during the pullback, a buy signal is generated.
bearish setup, the price first touches the low of the range, then the high. With the price returning downward and breaking the low, if there’s a candlestick confirmation during the pullback to the low, a sell signal is generated.
🔵 How to Use
To effectively implement the Judas Swing strategy (ICT Judas Swing) in trading, traders must first identify the price range of the 15-minute window following New York midnight. This range, consisting of highs and lows, sets the stage for the upcoming movements in the London and New York sessions.
🟣 Bullish Setup
For a bullish setup, the price first moves to touch the high of the range, then the low, before returning upward to break the high. Following this, a pullback occurs, and if a valid candlestick confirmation (such as a reversal pattern) is observed, a buy signal is generated. This confirmation could indicate the presence of smart money supporting the bullish movement.
🟣 Bearish Setup
For a bearish setup, the process is the reverse. The price first touches the low of the range, then the high. Afterward, the price moves downward again and breaks the low. A pullback follows to the broken low, and if a bearish candlestick confirmation is seen, a sell signal is generated. This confirmation signals the continuation of the downward price movement.
Using the Judas Swing strategy enables traders to avoid fake breakouts and focus on strong market confirmations. The strategy is versatile, applying to FOREX, stocks, and other financial instruments, offering optimal trading opportunities through market structure analysis and time frame synchronization.
To execute this strategy successfully, traders must combine it with effective risk management techniques such as setting appropriate stop losses and employing optimal risk-to-reward ratios. While the Judas Swing is a powerful tool for predicting price movements, traders should remember that no strategy is entirely risk-free. Proper capital management remains a critical element of long-term success.
By mastering the ICT Judas Swing strategy, traders can better identify entry and exit points and avoid common traps from fake market movements, ultimately improving their trading performance.
🔵 Setting
Opening Range : High and Low identification time range.
Extend : The time span of the dashed line.
Permit : Signal emission time range.
🔵 Conclusion
The Judas Swing strategy (ICT Judas Swing) is a powerful tool in technical analysis that helps traders identify fake moves and align their trades with institutional actions, reducing risk and enhancing their ability to capitalize on market opportunities.
By leveraging key levels such as range highs and lows, fake breakouts, and candlestick confirmations, traders can enter trades with more precision. This strategy is applicable in forex, stocks, and other financial markets and, with proper risk management, can lead to consistent trading success.

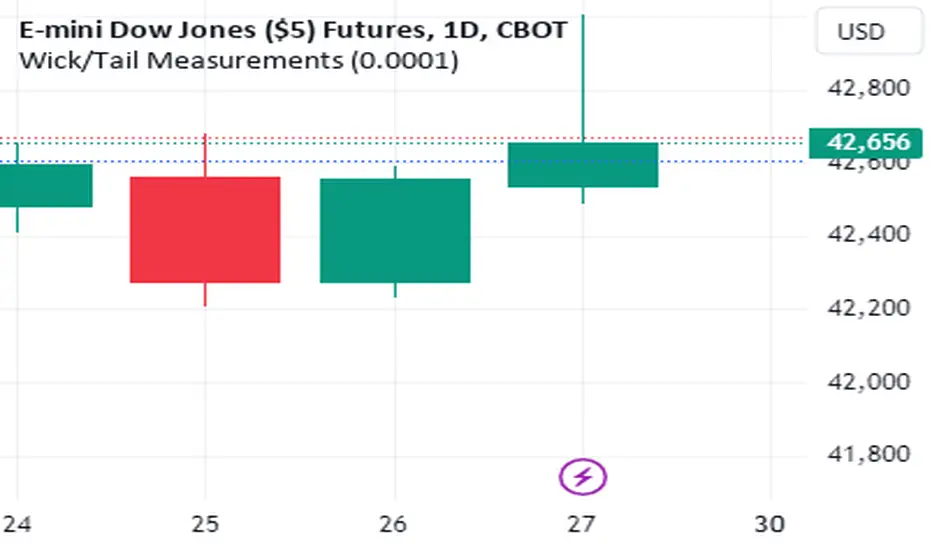
Wick/Tail Candle MeasurementsThis indicator runs on trading view. It was programmed with pine script v5.
Once the indicator is running you can scroll your chart to any year or date on the chart, then for the input select the date your interested in knowing the length of the tails and wicks from a bar and their lengths are measured in points.
To move the measurement, you can select the vertical bar built into the indicator AFTER clicking the green label and moving it around using the vertical bar *only*. You must click the vertical bar in the middle of the label to move the indicator calculation to another bar. You can also just select the date using the input as mentioned. This indicator calculates just one bar at a time.
measurements are from bar OPEN to bar HIGH for measured WICKS regardless of the bar being long or short and from bar OPEN to bar LOW for measured TAILS also regardless of the bar being long or short.
This indicator calculates tails and wicks including the bar body in the calculations. Basically showing you how much the market moved in a certain direction for the entire duration of that Doji candle.
Its designed to measure completed bars on the daily futures charts. (Dow Jones, ES&P500, Nasdaq, Russell 2000, etc) Although it may work well on other markets. The indicator could easily be tweaked in order to work well with other markets. It is not designed for forex markets currently.
E9 Shark-32 PatternUnderstanding the Shark-32 Pattern and its Trading Applications
The Shark-32 Pattern is a bearish technical trading formation used to predict market reversals or trend continuations. It highlights a downward move followed by a corrective rally, signaling a potential resumption of the downtrend. Here’s a breakdown of how it works:
What is the Shark-32 Pattern?
The Shark-32 pattern is a five-wave structure typically observed in bearish markets:
Wave 0 to X: A significant price decline starts the pattern.
Wave X to A: A correction pushes the price slightly upward.
Wave A to B: The price drops again but doesn’t reach the initial low.
Wave B to C: A final sharp decline concludes the pattern.
Once Wave C is formed, it suggests that the market will continue to move downward, presenting a potential selling or shorting opportunity.
Using the Pattern in Trading
This pattern is valuable for traders seeking high-probability bearish setups. The goal is to capitalize on the continuation of a downtrend following the corrective rally (X to A). Identifying the Shark-32 pattern helps anticipate the next wave of selling pressure.
Trading Setup
Identify a Shark-32 pattern.
If the price closes above the pattern's high, buy at the open the next day.
If the price closes below the pattern's low, short at the open the next day.
Sell/cover when the price moves 7% in the direction of the breakout.
Close the trade for a loss if the price moves 7% in the opposite direction.
For example, in a bull market after an upward breakout from a Shark-32, the net gain was $69.55. The method won 56% of the time with 5,218 winning trades and an average gain of $714.07. Conversely, 44% of trades were losers, with an average loss of $747.33. The average holding period was 26 calendar days.
The gains and losses were closely aligned with the 7% threshold set for this test.
Key Target Levels
To enhance the strategy, use dotted projection lines as target levels:
Upper Target: Drawn above the high of the corrective rally (Wave A). If the price breaks above this line, it may signal further upward movement, indicating a potentially weaker downtrend.
Lower Target: Positioned below the low of Wave C, providing a target for bearish trades.
These lines help determine future price targets and assist in setting take-profit or stop-loss levels.
Trading the Breakout
Look for breakouts once the Shark-32 pattern is identified:
Upward Breakout: If the price closes above the green line (high from two bars ago), it indicates a potential reversal to the upside.
Downward Breakout: If the price breaks below the red line (low from two bars ago), it confirms the bearish continuation.
Breakouts allow traders to adjust their positions based on market shifts.
Trading Tips
Continuation: The Shark-32 pattern acts as a continuation 60% of the time, confirming the ongoing trend.
Breakout Confirmation: Wait for the price to close above or below the pattern’s key levels before entering a trade.
Trade with the Trend: Since the Shark-32 is a continuation pattern, expect the breakout to align with the inbound price trend.
Symmetry: Patterns with symmetry often perform better. For more insights, refer to detailed trading literature.
Half-Staff: The Shark-32 can form midway in a trend, similar to flags and pennants.
Shark-32: Trading Performance
Based on an analysis of 23,369 trades, the following performance metrics were observed:
Bull Market with Upward Breakout: The average net profit was $69.55. This method won 56% of the time, with winning trades averaging $714.07. Losing trades, which constituted 44% of the total, had an average loss of $747.33. The average holding period was 26 calendar days.
Bull Market with Downward Breakout: The average net loss was $(76.36). This method won 43% of the time, with winning trades averaging $753.56. Losing trades, which constituted 57% of the total, had an average loss of $706.32. The average holding period was 23 calendar days.
Bear Market with Upward Breakout: The average net loss was $(89.13). This method won 46% of the time, with winning trades averaging $710.77. Losing trades, which constituted 54% of the total, had an average loss of $756.97. The average holding period was 16 calendar days.
Bear Market with Downward Breakout: The average net profit was $65.17. This method won 52% of the time, with winning trades averaging $781.62. Losing trades, which constituted 48% of the total, had an average loss of $722.41. The average holding period was 13 calendar days.
Heikin Ashi & Swing Highs/LowsHeikin Ashi & Swing Highs/Lows
Indicator Description:
The "Heikin Ashi & Swing Highs/Lows" indicator combines Heikin Ashi candle analysis with the identification of significant swing highs and lows on the chart. This indicator is useful for traders looking to spot trend changes and key points in the market.
Key Features:
Heikin Ashi:
Calculation and Visualization: Utilizes the Heikin Ashi method to smooth out the candlestick chart, helping to visualize trends and reduce market noise. Heikin Ashi candles are calculated from the standard candles (Open, High, Low, Close) and are displayed on the chart with a green color for bullish signals and red for bearish signals.
Vertical Offset Adjustment: Provides options to adjust the vertical offset of the candles based on the selected timeframe, with specific adjustments for short, medium, long, and super-long periods.
Swing Highs/Lows:
Key Point Identification: Marks significant swing highs and lows on the chart using a configurable period. Swing highs are displayed in red and swing lows in green.
Candlestick Patterns: Detects and labels common candlestick patterns such as:
Hammer: A bullish candlestick pattern with a small body and a long lower wick.
Inverted Hammer: Similar to the Hammer, but with a long upper wick.
Bullish Engulfing: A two-candle pattern where a bullish candle completely engulfs a previous bearish candle.
Hanging Man: A bearish pattern with a small body and a long lower wick, appearing at the end of an uptrend.
Shooting Star: A bearish pattern with a small body and a long upper wick, appearing at the end of an uptrend.
Bearish Engulfing: A two-candle pattern where a bearish candle completely engulfs a previous bullish candle.
Settings:
Timeframe: Allows you to select the desired timeframe to adjust the Heikin Ashi candle analysis.
Vertical Offset: Customize the vertical offset of Heikin Ashi candles based on the selected timeframe.
Swing Point Style: Configure the colors of the significant swing highs and lows on the chart.
Recommended Use:
This indicator is ideal for traders looking for a clear representation of trends through Heikin Ashi candles and who want to identify key reversal points in the market by detecting swing highs/lows and candlestick patterns.
Benefits:
Facilitates the identification of smooth trends and trend reversals.
Provides a clear visual representation of critical market points.
Helps traders recognize important candlestick patterns that may indicate changes in market direction.

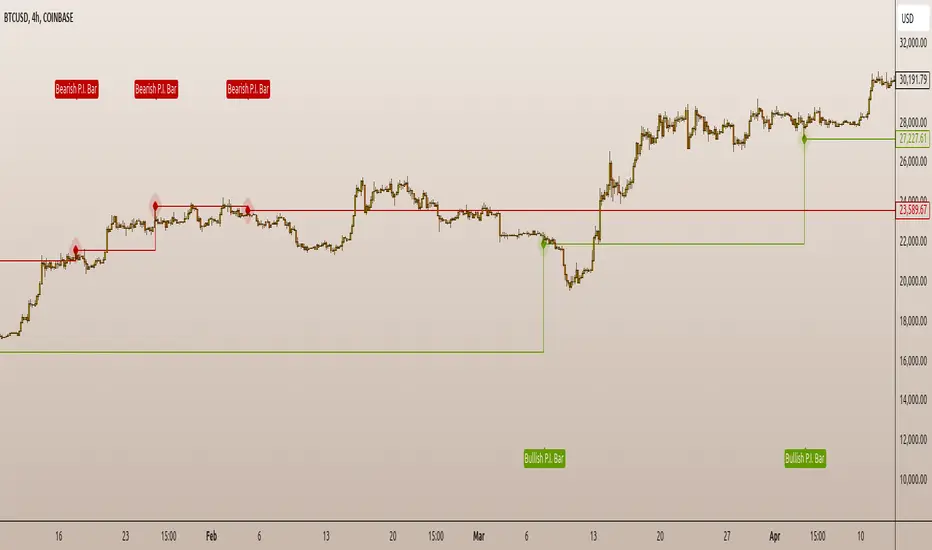
P.I.B. System (Pin Bar | Inside Bar) // AlgoFyreThe "P.I.B. System (Pin Bar | Inside Bar)" identifies bullish and bearish pin bars and inside bars on a price chart. It highlights potential market reversals by plotting labels and colorizing bars, providing traders with visual cues for better decision-making.
Description
The "P.I.B. System (Pin Bar | Inside Bar)" script is designed to help traders identify potential reversal points in the market by detecting bullish and bearish pin bars and inside bars. A pin bar is a candlestick pattern that indicates a potential reversal, characterized by a small body and a long wick. Inside bars are candlestick patterns where the current bar's high and low are within the previous bar's range, indicating potential consolidation before a breakout.
This script allows customization of various parameters to fine-tune the identification of pin bars and inside bars. When a pin bar or an inside bar is detected, the script plots a label on the chart and colorizes the bars to highlight these patterns. This tool is useful for traders looking to identify potential reversal points and make informed trading decisions.
Explanation of All Options
Pin-Wick Size Ratio Minimum Value : The minimum ratio of the wick size to the total candle size for a pin bar to be considered valid. Default is 0.66.
Candle Body Size Ratio Maximum Value : The maximum ratio of the body size to the total candle size for a pin bar to be considered valid. Default is 0.4.
Handle-Wick Wick Size Ratio Maximum Value : The maximum ratio of the opposite wick size to the total candle size for a pin bar to be considered valid. Default is 0.4.
Filter Out Small Candles : Option to filter out small candles based on the previous candle's size. Default is true.
Small Candle Size Ratio : The ratio used to determine if a candle is considered small compared to the previous candle. Default is 2.0.
Identify Inside Bars : Option to identify inside bars following a pin bar. Default is true.
Show Only P.I.B. : Option to show only the bars where a pin bar is followed by an inside bar. Default is true.
Hide Horizontal Rays : Option to hide horizontal rays drawn from the last identified pin bars. Default is false.
How to Use
To use this script, add it to your chart. Customize the input parameters to match your trading strategy. The script will automatically identify and highlight bullish and bearish pin bars and inside bars on the chart. Use the visual cues provided by the labels and colorized bars to make informed trading decisions.
Big Candle HighlighterBig Candle Highlighter
The Big Candle Highlighter indicator highlights significant candles based on their percentage difference between the open and close prices. This tool helps traders quickly identify candles with substantial price movements, which can be crucial for spotting key price action, potential reversals, or significant market events.
Key Features:
Percentage Threshold : Customize the minimum percentage difference from open to close required to mark a candle as "big."
Bullish and Bearish Markers : Bullish big candles are marked with a label below the bar in green, while bearish big candles are marked with a label above the bar in red.
Background Highlighting : Optionally highlight the background of big candles for better visual emphasis.
Inputs:
Percentage Threshold (% ): Set the percentage threshold to define what constitutes a "big" candle. For example, a threshold of 2.0 means that only candles with a 2% or more difference between open and close will be marked.
Color for Big Bullish Candle : Choose the color for labeling and highlighting bullish big candles.
Color for Big Bearish Candle : Choose the color for labeling and highlighting bearish big candles.
Usage :
This indicator is useful for traders looking to identify significant price movements and potential trading opportunities. By focusing on candles that show substantial changes from open to close, you can better understand market dynamics and make more informed trading decisions.
Add the Big Candle Marker to your charts to enhance your technical analysis and stay ahead of market trends.

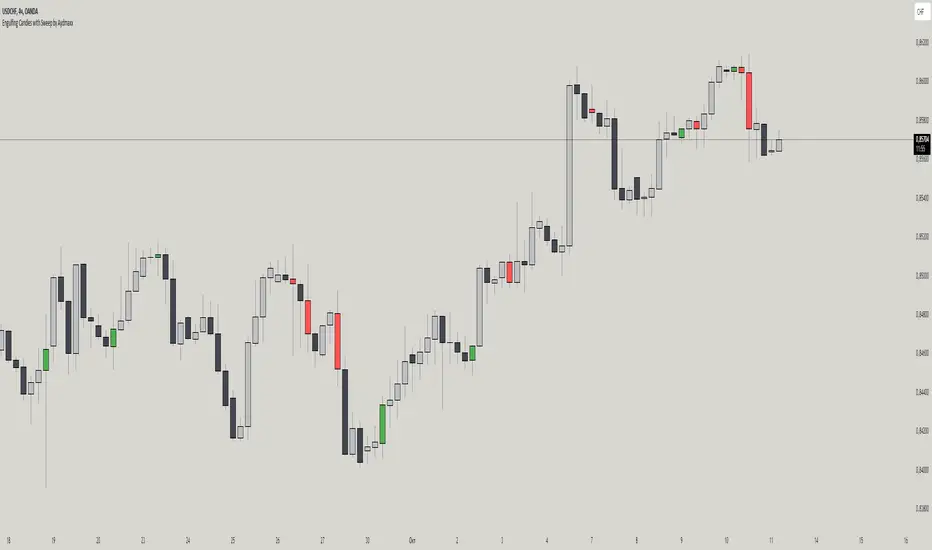
Engulfing Candles with Sweep by AydmaxxEngulfing Candles with Sweep Indicator
The "Engulfing Candles with Sweep" indicator identifies bullish and bearish engulfing candles that exhibit liquidity sweeps. It marks these significant candlestick patterns and draws a 50% Fibonacci retracement line from the high to low of the engulfing candle. The indicator helps traders spot potential reversal points where large market players might be accumulating or distributing positions.
Key Features:
Bullish Engulfing Candle with Sweep:
Identifies when a bullish candle (closing higher than it opened) engulfs the previous bearish candle (closing lower than it opened).
Ensures that the bullish candle’s low is lower than the previous candle’s low, indicating a sweep of liquidity.
Marks the identified bullish candle with a symbol below the candlestick.
Draws a 50% Fibonacci retracement line from the high to the low of the bullish engulfing candle.
Bearish Engulfing Candle with Sweep:
Identifies when a bearish candle (closing lower than it opened) engulfs the previous bullish candle (closing higher than it opened).
Ensures that the bearish candle’s high is higher than the previous candle’s high, indicating a sweep of liquidity.
Marks the identified bearish candle with a symbol above the candlestick.
Draws a 50% Fibonacci retracement line from the high to the low of the bearish engulfing candle.
Customizable Settings:
Fibonacci Line Color: Allows customization of the Fibonacci retracement line color for both bullish and bearish engulfing candles.
Fibonacci Line Style: Provides options to choose the line style (solid, dotted, dashed).
Fibonacci Line Width: Enables adjustment of the line width for better visibility.
Toggle Fibonacci Lines: Option to enable or disable the display of Fibonacci retracement lines.
How to Use:
Apply the indicator to your chart.
Look for symbols below or above the candlesticks, indicating bullish or bearish engulfing candles with liquidity sweeps.
Utilize the 50% Fibonacci retracement lines to identify potential support or resistance levels.
Benefits:
Helps in identifying key reversal patterns in the market.
Provides visual aids with Fibonacci retracement levels for potential entry and exit points.
Enhances trading decisions by confirming engulfing patterns with liquidity sweeps.
Last Candle OHLC (Ticks or Points)What the Code Does
1. **Draws Lines and Labels**:
- It draws lines on your chart to show the high, low, open, and close prices from the previous period (like the previous day or week).
- It also labels these lines with numbers that tell you how far the current price is from these levels.
2. **Shows Price Movement**:
- You can see how far the price has moved from these levels in terms of small price changes (ticks) or larger units (points).
- This helps you understand price movements and potential levels of support or resistance.
3. **Customizable**:
- You can choose whether to show these lines and labels, and you can select if you want to see the movement in ticks or points.
- The lines can extend into the future on your chart to help you anticipate where prices might be in the coming days.
### How It’s Useful:
1. **Identify Key Levels**:
- It helps you spot important price levels from past periods, which can act as support or resistance.
2. **Understand Price Movement**:
- You get a visual sense of how much the price has moved from key levels, which can help you gauge market volatility.
3. **Plan Trades**:
- By seeing where the price has been and how it has moved, you can better plan your trades, like deciding where to enter or exit based on these levels.
4. **Flexible for Different Markets**:
- It works across various markets, like stocks, futures, and forex, adjusting to the specific characteristics of each instrument.
In short, this tool helps you visualize and understand past price movements and levels on your chart, aiding in your trading decisions.

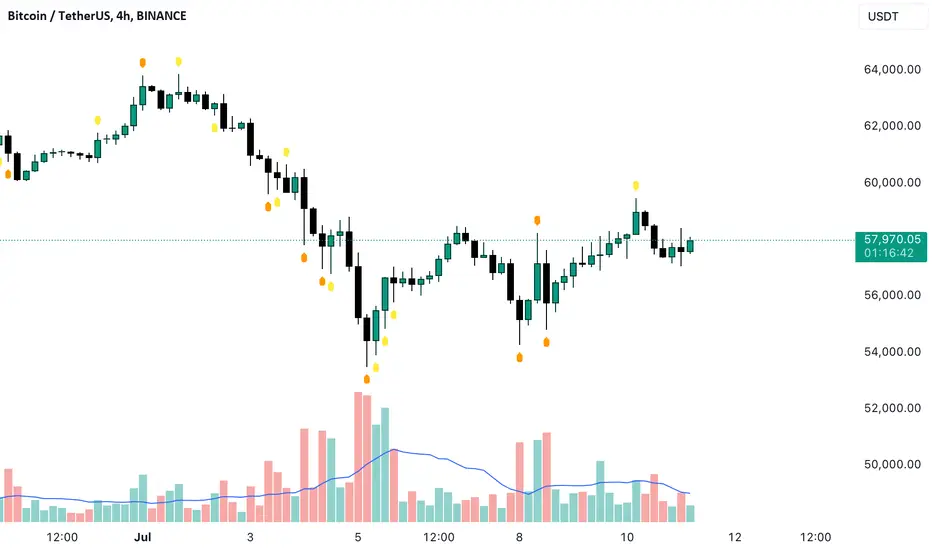
Candle Patterns with Volume ValidationHey Guys !
█ This indicator shows validated Hammer and Shooting Star candle patterns based on volume.
This indicator identifies Hammer and Shooting Star patterns and validates them using volume analysis.
Hammer and Shooting Star patterns are candlestick patterns that signal potential reversals in the market.
█ Usages:
A hammer is formed when in a session, the price has fallen, only to reverse and recover to close back near the opening price. This is a sign of strength with the selling having been absorbed in sufficient strength for the buyers to overwhelm the sellers, allowing the market to recover. The hammer is so called as it is ‘hammering out a bottom’, and just like the shooting star, is immensely powerful when combined with Volume Price Analysis (VPA).
The shooting star is a bearish reversal pattern that appears at the top of uptrends. It signifies that prices have peaked and a downward reversal is likely. The presence of high volume strengthens this signal, indicating that the insiders are offloading their positions.
When combined with volume analysis, these patterns become powerful signals. The volume provides context to the price action, helping traders confirm the validity of the pattern. For example, a hammer with high volume suggests strong buying interest, whereas a shooting star with high volume indicates strong selling pressure.
█ Features:
• Detects Hammer and Shooting Star patterns.
• Validates patterns with volume thresholds.
• Color codes patterns based on volume validation.
• Allows customization of volume thresholds and pattern criteria.
• Option to show or hide signals.
█ Parameters:
• Volume Average Period: The period used to calculate the average volume.
• Higher Volume Multiplier: Multiplier to define higher volume threshold.
• Much Higher Volume Multiplier: Multiplier to define much higher volume threshold.
• Enormous Volume Multiplier: Multiplier to define enormous volume threshold.
• Body/Shadow Ratio for Hammer and Shooting Star: Ratio of body to shadow for pattern validation.
• Upper Shadow Limit for Hammer: Upper shadow limit for Hammer pattern.
• Lower Shadow Limit for Shooting Star: Lower shadow limit for Shooting Star pattern.
• Show Hammer Signals: Display signals for Hammer patterns.
• Show Shooting Star Signals: Display signals for Shooting Star patterns.
Enjoy !
Candlestick Structure [LuxAlgo]The Candlestick Structure indicator detects major market trends and displays various candlestick patterns aligning with the detected trend, filtering out potentially unwanted patterns as a result. Multiple trend detection methods are included and can be selected by the users.
A dashboard showing the alignment percentage of each individual pattern is also provided.
🔶 USAGE
By distinguishing major and minor trend detection, we can still detect patterns based on minor trends, yet filter out the patterns that do not align with the major trend.
By detecting candlestick patterns that align with a major trend, we can effectively detect the ending points of retracements, potentially providing various entry points of interest within a trend.
Users are able to track the alignment of each candlestick pattern in the dashboard to reveal which patterns typically align with the trend and which may not.
Note: Alignment % only checks if the pattern's direction is the same as the current trend direction. These are only raw readings and not any type of confidence score.
🔶 DETAILS
In this indicator, we are identifying and tracking 16 different Candlestick Patterns.
🔹 Bullish Patterns
Hammer: Identified by a small upper wick (or no upper wick) with a small body, and an elongated lower wick whose length is 2X greater than the candle body’s width.
Inverted Hammer: Identified by a small lower wick (or no lower wick) with a small body, and an elongated upper wick whose length is 2X greater than the candle body’s width.
Bullish Engulfing: A 2 bar pattern identified by a large bullish candle body fully encapsulating (opening lower and closing higher) the previous small (bearish) candle body.
Rising 3: A 5 bar pattern identified by an initial full-bodied bullish candle, followed by 3 bearish candles that trade within the high and low of the initial candle, followed by another full-bodied bullish candle closing above the high of the initial candle.
3 White Soldiers: Identified by 3 full-bodied bullish candles, each opening within the body and closing below the high, of the previous candle.
Morning Star: A 3 bar pattern identified by a full-bodied bearish candle, followed by a small-bodied bearish candle, followed by a full-bodied bullish candle that closes above the halfway point of the first candle.
Bullish Harami: A 2 bar pattern, identified by an initial bearish candle, followed by a small bullish candle whose range is entirely contained within the body of the initial candle.
Tweezer Bottom: A 2 bar pattern identified by an initial bearish candle, followed by a bullish candle, both having equal lows.
🔹 Bearish Patterns
Hanging Man: Identified by a small upper wick (or no upper wick) with a small body, and an elongated lower wick whose length is 2X greater than the candle body’s width.
Shooting Star: Identified by a small lower wick (or no lower wick) with a small body, and an elongated upper wick whose length is 2X greater than the candle body’s width.
Bearish Engulfing: A 2 bar pattern identified by a large bearish candle body fully encapsulating (opening higher and closing lower) the previous small (bullish) candle body.
Falling 3: A 5 bar pattern identified by an initial full-bodied bearish candle, followed by 3 bullish candles that trade within the high and low of the initial candle, followed by another full-bodied bearish candle closing below the low of the initial candle.
3 Black Crows: Identified by 3 full-bodied bearish candles, each open within the body and closing below the low, of the previous candle.
Evening Star: A 3 bar pattern identified by a full-bodied bullish candle, followed by a small-bodied bullish candle, followed by a full-bodied bearish candle that closes below the halfway point of the first candle.
Bearish Harami: A 2 bar pattern, identified by an initial bullish candle, followed by a small bearish candle whose range is entirely contained within the body of the initial candle.
Tweezer Top: A 2 bar pattern identified by an initial bullish candle, followed by a bearish candle, both having equal highs.
🔹 Trend Types
Major trend is displayed at all times, the display will change depending on the trend method selected.
The minor trend can also be visualized; to avoid confusion, the minor trend can optionally be displayed through the candle colors.
Supertrend: Displays Upper and Lower SuperTrend, When we break above the upper, it is considered an Uptrend. When we break below the lower, it is considered a Downtrend.
EMAs: Displays Fast and Slow EMAs, When Fast>Slow, it is considered an Uptrend. When Fast

Relative Equal Highs/LowsThis Pine script indicator is designed to create a visual representation of the relative equal highs & lows formed and automatically removed mitigated ones. Unlike indicators designed to show exact equal high/lows this indicator allows a small, configurable degree of variance between price to identify areas where price stops.
Relevance:
Relative Equal highs and lows can serve as valuable tools in identifying potential shifts in trend direction. They come into play when the price hits a support or resistance level and can’t advance further, signaling a possible reversal or pivot point. When the price sufficiently retreats from these levels, relative equal highs and lows can also indicate liquidity draws where buy/sell stops might be positioned, in accordance with SMC/ICT concepts.
How It Works:
The indicator tracks all unmitigated highs & lows within the chart’s present timeframe, limited to the user-defined max bars lookback for optimal performance. If the prices are within the configured variance they are marked as relatively equal and at that point are visually identified by a horizontal line, which connects the two (or more) points of price. Depending on configuration of the indicator, a line is rendered from the 1st, last or both values within the relatively equal range of price. A unique feature of this indicator is its ability to remove the line once the price mitigates the relative equal high/low by falling below the lows or rising above highs. This ensures the chart remains uncluttered and highlights only the currently relevant levels, setting it apart from other indicators providing similar functionality.
Configurability:
The indicator offers five style settings for complete customization of the lines that represent equal highs/lows. These settings include line style, color, and width, along with an option to extend the lines to the right of the chart for enhanced visibility of equal high/low levels. To optimize performance, the indicator allows users to configure the lookback length, determining how far back the price history should be examined. In most instances, the default setting of 500 bars proves more than adequate. Additionally, you can set thresholds via separate configs for stocks & indices that will determine if the price is relatively equal and lastly allow you to configure where the indicator line should be drawn, the first, last or all the values.
Additional notes:
This uses a different approach then my “equal highs/lows” indicator to identify price levels and because it focuses specifically on relative as opposed to exact values it is entirely different and may show “weaker”, but still important levels of liquidity. This indicator is more suited for analysis of stocks and indices or higher-timeframes where price-action rarely forms exact equal values instead more frequently forming almost equal values. My other indicator is more suited for smaller (15m or less) timeframe on indices where exact equal prices are often identical. Depending on situation different indicators should be used.

EngulfScanEngulf Scan
Introduction:
The Engulf Scan indicator helps users identify bullish and bearish engulfing candlestick patterns on their charts. These patterns are often used as signals for trend reversals and are important indicators for traders. Engulf Scan signals are generated when an engulfing pattern is swallowed by another candlestick of the opposite color.The signal of a candle engulfment formation is generated when the 1st candle is engulfed by the 2nd candle and the 2nd candle is engulfed by the 3rd candle.
Features:
Bullish Engulfing Pattern: Indicates the start of an upward trend and typically signals that the market is likely to move higher.
Bearish Engulfing Pattern: Indicates the start of a downward trend and typically signals that the market is likely to move lower.
Color Coding: Users can customize the background colors for bullish and bearish engulfing patterns.
Usage Guide:
Adding the Indicator: Add the "Engulf Scan" indicator to your TradingView chart.
Color Settings: Choose your preferred colors for bullish and bearish engulfing patterns from the indicator settings.
Pattern Detection: View the engulfing patterns on the chart with the specified colors and symbols. These patterns help identify potential trend reversal points.
Parameters and Settings:
Bullish Engulfing Color: Background color for the bullish engulfing pattern.( Green)
Bearish Engulfing Color: Background color for the bearish engulfing pattern. (Red)
Examples:
Bullish Engulfing Example: On the chart below, you can see bullish engulfing patterns highlighted with a green background. (Green)
Bearish Engulfing Example: On the chart below, you can see bearish engulfing patterns highlighted with a red background. (Red)
Frequently Asked Questions (FAQ):
How are engulfing patterns detected?
Engulfing patterns are formed when a candlestick completely engulfs the previous candlestick. For a bullish engulfing pattern, a bullish candlestick follows a bearish one. For a bearish engulfing pattern, a bearish candlestick follows a bullish one.
Which timeframes work best with this indicator?
Engulfing patterns are generally more reliable on daily and higher timeframes, but you can test the indicator on different timeframes to see if it fits your trading strategy.
Can I detect a reversal or trend?
As can be seen in the image, it sometimes appears as a return signal and sometimes as a harbinger of an ongoing trend.But it may be a mistake to use the indicator only for these purposes. However, this indicator may not be sufficient when used alone. It can be combined with different indicators from the Tradingview library.
Updates and Changelog:
v1.0: Initial release. Added detection and color coding for bullish and bearish engulfing patterns.
-Please feel free to write your valuable comments and opinions. I attach importance to your valuable opinions so that I can improve myself.

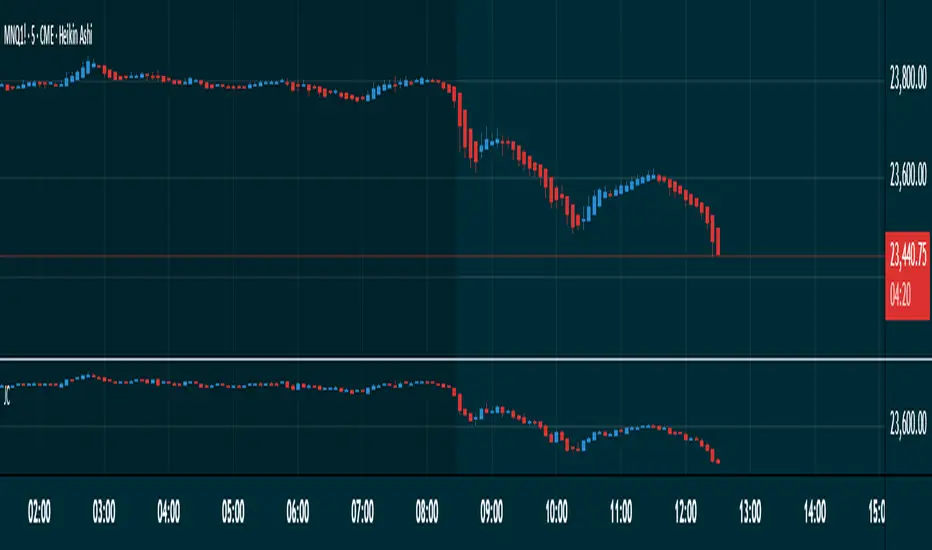
Japanese CandlesSimple script to add standard Japanese candles in a new pane for use when using a non-standard chart (Ex: Heikin Ashi) that doesn't use true OHLC values in it's calculation so that you can still monitor true values and activity without having to take up the screen real estate that using a layout containing a whole new chart would require. This also makes horizontal sync of the main chart to the Japanese candle chart perfect at all times.
Reversal Candlestick Structure [LuxAlgo]The Reversal Candlestick Structure indicator detects multiple candlestick patterns occurring when trends are most likely to experience a reversal in real-time. The reversal detection method includes various settings allowing users to adjust the reversal detection algorithm more precisely.
A dashboard showing the percentage of patterns detected as reversals is also included.
🔶 USAGE
Candlestick patterns are ubiquitous to technical analysts, allowing them to detect trend continuations, reversals, and indecision.
The proposed tool effectively detects reversals by using the confluence between candlestick patterns and a reversal detection method based on the stochastic oscillator, acting as a filter for the patterns. If a candlestick pattern occurs while conditions suggest a potential reversal then the pattern is highlighted.
The displayed candle coloring allows users to observe the reversal detection method, with colored candles indicating potential reversals.
Users wanting to detect longer-term reversals can use a higher "Trend Length" setting, this can however lead to an increased amount of displayed candlestick patterns.
To prevent false positives users also have control over a "Threshold" setting in a range between (0, 100), with values closer to 100 preventing candlesticks from being detected at the start of trends.
The "Warmup Length" serves a similar purpose, and aims to prevent sudden moves to be classified as reversals. Higher values of this setting will require trends to be established for a longer period of time for reversal conditions to be detected.
🔹 Dashboard
To evaluate the role of individual candlestick patterns as potential reversal signals relative to the proposed reversal detection method, a dashboard displaying the percentage of candlestick patterns displayed (that occur when a potential reversal is detected) over the total amount detected.
Hovering on the dashboard cells of the "Reversal %" column allows displaying the total amount of patterns detected.
🔶 CANDLESTICKS PATTERNS
This tool detects 16 popular candlestick patterns, each listed in the sub-sections below.
🔹 Bullish Patterns
Hammer - A bullish reversal pattern that forms after a decline, characterized by a small body at the upper end of the trading range and a long lower shadow.
Inverted Hammer - A bullish reversal pattern that forms after a downtrend, featuring a small body at the lower end of the trading range and a long upper shadow.
Bullish Engulfing - A bullish reversal pattern where a small bearish candlestick is followed by a larger bullish candlestick that completely engulfs the previous candle.
Rising 3 - A bullish continuation pattern that consists of a long bullish candlestick followed by three smaller bearish candlesticks and then another long bullish candlestick.
3 White Soldiers - A bullish reversal pattern consisting of three consecutive long bullish candlesticks, each opening within the previous candle's body and closing higher.
Morning Star - A bullish reversal pattern made up of three candlesticks: a long bearish candlestick, followed by a short candlestick, and then a long bullish candlestick.
Bullish Harami - A bullish reversal pattern where a small bullish candlestick is completely within a previous larger bearish candlestick.
Tweezer Bottom - A bullish reversal pattern identified by an initial bullish candle, followed by a bearish candle, both having equal lows.
🔹 Bearish Patterns
Hanging Man - A bearish reversal pattern that forms after an uptrend, characterized by a small body at the upper end of the trading range and a long lower shadow.
Shooting Star - A bearish reversal pattern that forms after an uptrend, featuring a small body at the lower end of the trading range and a long upper shadow.
Bearish Engulfing - A bearish reversal pattern where a small bullish candlestick is followed by a larger bearish candlestick that completely engulfs the previous candle.
Falling 3 - A bearish continuation pattern that consists of a long bearish candlestick followed by three smaller bullish candlesticks and then another long bearish candlestick.
3 Black Crows - A bearish reversal pattern consisting of three consecutive long bearish candlesticks, each opening within the previous candle's body and closing lower.
Evening Star - A bearish reversal pattern made up of three candlesticks: a long bullish candlestick, followed by a short candlestick, and then a long bearish candlestick.
Bearish Harami - A bearish reversal pattern where a small bearish candlestick is completely within a previous larger bullish candlestick.
Tweezer Top - A bearish reversal pattern is identified by an initial bullish candle, followed by a bearish candle, both having equal highs."
🔶 SETTINGS
🔹 Patterns
Group including toggles for each of the supported candlestick patterns. Enabled toggles will allow detection of the associated candlestick pattern.
🔹 Reversal Detection
Trend Length: Determines the sensitivity of the reversal detection method to shorter-term variation, with higher values returning a detection method more sensitive to longer-term trends.
Threshold: Determines how easy it is for the reversal detection method to consider a trend at an extreme point.
Warmup Length: Warmup period in the reversal detection method, longer values will require a longer-term trend to detect potential reversals.
🔹 Style
Color Candles: Enable candle coloring on the user chart based on the reversal detection method.
Use Gradient: Use a gradient as candle coloring.
Label Size: Size of the labels displaying the detected candlesticks patterns.
🔹 Dashboard
Show Dashboard: Display the dashboard on the user chart when enabled.
Location: Dashboard location on the user chart.
Size: Size of the displayed dashboard.

Indecisive CandlesAn Indecisive Candle, often referred to as a Base Candle, is a pivotal element in technical analysis, particularly for identifying institutional supply and demand zones. These candles are characterized by their small bodies and long wicks, reflecting a balance between buyers and sellers, indicating a potential pause or consolidation in the market.
To calculate whether a candle qualifies as an indecisive candle based on the criterion that its body (the absolute difference between its open and close prices) is less than or equal to 50% of the total range of the candle (the difference between its high and low prices).
Key Features:
Small Real Body: Signifies minimal movement from open to close, indicating market indecision.
Long Upper and Lower Wicks: Show that both bulls and bears attempted to control the price, but neither succeeded, leading to a standoff.
Formation Context: Typically found at the end of a strong trend or within a consolidation phase, hinting at a potential reversal or continuation pattern.
Usage in Identifying Institutional Supply and Demand:
Supply Zones: When an Indecisive Candle forms after a rally, it can mark the onset of an institutional supply zone, suggesting that large entities are starting to sell, leading to potential downward pressure.
Demand Zones: Conversely, when this candle appears after a downtrend, it often signals the emergence of a demand zone, where institutions begin to accumulate, anticipating a price increase.
Trading Strategies:
Zone Identification: Use Indecisive Candles to pinpoint key supply and demand zones on your chart, enhancing the accuracy of your support and resistance levels.
Confirmation: Look for confirmation from subsequent price action or volume spikes to validate the presence of institutional activity before making trading decisions.
Risk Management: Place stop-loss orders beyond the wicks of these candles to protect against false breakouts or continued indecision.
Conclusion:
Indecisive Candles are essential tools for traders looking to understand market sentiment and institutional behavior. By mastering their identification and interpretation, you can enhance your ability to spot high-probability trading opportunities and manage risks effectively.

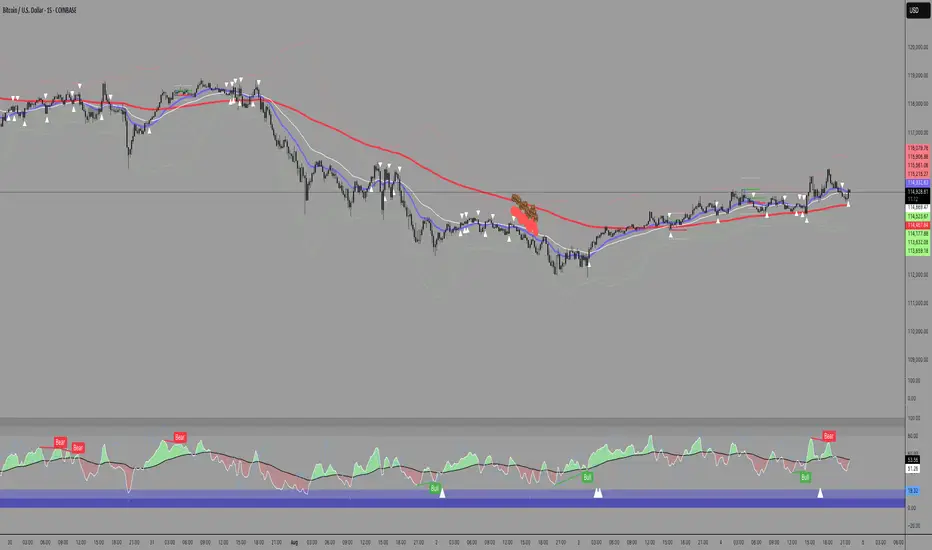
Candlestick Reversal and Trend Signals [AlgoAlpha]🚀 Unleash your charting capabilities with the Candlestick Reversal and Trend Signals indicator by AlgoAlpha, your go-to tool for spotting pivotal market movements! This script enhances your trading experience by identifying key candlestick patterns and trend changes, perfect for traders aiming for precision in their technical analysis.
🛠 Key Features:
- 🔄 Multi-Timeframe Analysis : Leverages a timeframe multiplier to analyze levels on higher timeframes, enhancing the depth and applicability of insights.
- 🧩 Diverse Pattern Detection : Capable of detecting a wide array of patterns including Bull/Bear Engulfings, Dojis, Haramis, Piercing Lines, Dark Cloud Covers, and Morning/Evening Stars, each contributing to a robust trading strategy.
- 🔍 Dynamic Trend Filters : Utilizes three exponential moving averages (EMAs) and volume filters to decisively confirm trend directions and strength, providing a clearer picture of market dynamics.
- ⚙️ Customizable Settings : Features adjustable settings for filter period, signal thresholds, and appearance, allowing for a tailored analysis experience to fit individual trading styles.
- 📉 Swing Levels Identification : Marks significant high and low swing points on the chart, highlighting potential pivot points and trend reversals for strategic trading decisions.
📈 Quick Guide to Using the Candlestick Reversal and Trend Signals Indicator
1. 🛠 Add the Indicator : Add the indicator to your favorites. Adjust the settings to match your analysis needs.
2. 📊 Analysis : Keep an eye out for the specific symbols plotted on your chart that indicate various candlestick patterns. Use these signals to enhance your market analysis.
3. 🔔 Set Alerts : Enable alerts for the patterns you are most interested in to get notified of potential trading opportunities without needing to monitor the charts constantly.
Embark on your enhanced trading journey with this powerful tool! 🚀✨ Happy trading!
🧐 How It Works:
The Candlestick Reversal and Trend Signals indicator operates by integrating several candlestick patterns and trend analysis features to assist in making informed trading decisions. Initially, it gathers user-defined settings like the period for filtering, signal thresholds, and the desired patterns to detect. It analyzes candlestick formations such as Bull/Bear Engulfings, Dojis, Haramis, and more, by comparing the current candlestick's attributes (such as body length and direction) with previous data to identify potential market reversals or confirmations. The indicator enhances its accuracy through additional filters like volume ratios and exponential moving averages (EMAs) that help validate the strength and direction of trends. By marking these patterns and trends visually on the chart, it provides clear signals that aid traders in identifying significant market movements efficiently. The script is then complemented with the 3 EMA indicator for trend detection and swing levels for added confluence.

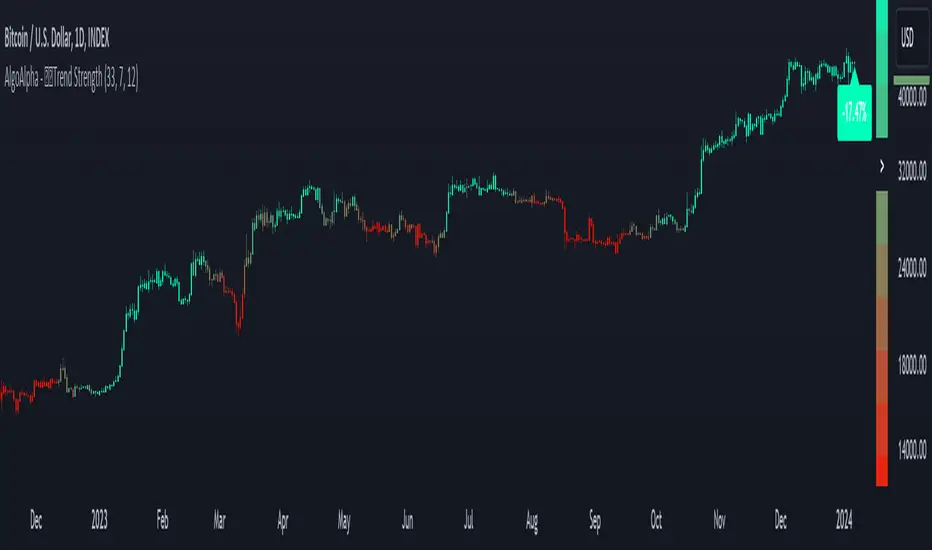
Candlestick Trend Strength [AlgoAlpha]🚀🎉 Introducing the Candlestick Trend Strength by AlgoAlpha, a dynamic TradingView indicator designed to visually communicate the strength and direction of market trends right on your charts! 🕯️💪
Key Features:
🌈 Visual gauge for trend strength, color-coded for intuitive insights.
⏳ Customizable trend detection and normalization periods to match your trading strategy.
🎨 Flexible color settings for both uptrend (green) and downtrend (red).
🔔 Real-time alerts for trend reversals, helping you stay ahead of market moves.
How to Use:
🛠 Add the Indicator: Add the indicator to favorites and customize it to suit your needs.
🔍 Analyze the Trends: Monitor the color changes in the gauge and bar color to identify strengthening or weakening trends.
🔔 Set Alerts: Configure alerts to notify you of trend changes, allowing you to react swiftly to trading opportunities without constant monitoring.
Basic Logic Explained:
The "Candlestick Trend Strength" indicator calculates the trend strength score by analyzing the ratio of the candle's wick to its body, alongside the direction of the candle (up or down). It uses a normalization period to adjust the sum of the trend score into a scale from -1 to 1, which is then plotted as a color gradient gauge from red (downtrend) to green (uptrend) on the chart. This representation helps traders quickly assess whether a trend is gaining or losing strength, and it updates in real-time with each new bar, providing a highly responsive tool for technical analysis.
Embrace the power of visual trend analysis with the "Candlestick Trend Strength" by AlgoAlpha and transform your trading experience today! 🌟📈
ICT Immediate Rebalance [LuxAlgo]The ICT Immediate Rebalance aims at detecting and highlighting immediate rebalances, a concept taught by Inner Circle Trader. The ICT Immediate Rebalance, although frequently overlooked, emerges as one of ICT's most influential concepts, particularly when considered within a specific context.
🔶 USAGE
Immediate rebalances, a concept taught by ICT, hold significant importance in decision-making. To comprehend the concept of immediate rebalance, it's essential to grasp the notion of the fair value gap. A fair value gap arises from market inefficiencies or imbalances, whereas an immediate rebalance leaves no gap, no inefficiencies, or no imbalances that the price would need to return to.
Following an immediate rebalance, the typical expectation is for two extension candles to ensue; failing this, the immediate rebalance is deemed unsuccessful. It's important to note that both failed and successful immediate rebalances hold significance in trading when analyzed within a contextual framework.
Immediate rebalances can manifest across various locations and timeframes. It's recommended to analyze them in conjunction with other ICT tools or technical indicators to gain a more comprehensive understanding of market dynamics.
🔹 Multi Timeframe
The script facilitates multi-timeframe analysis, enabling users to display immediate rebalances from higher timeframes.
Enabling the display of higher timeframe candles helps visualize the detected immediate rebalance patterns.
🔹 Dashboard
The dashboard offers statistical insights into immediate rebalances.
🔶 SETTINGS
🔹 Immediate Rebalances
Timeframe: this option is to identify immediate rebalances from higher timeframes. If a timeframe lower than the chart's timeframe is selected, calculations will be based on the chart's timeframe.
Bullish, and Bearish Immediate Rebalances: color customization options.
Wicks 75%, %50, and %25: color customization options of the wick price levels for the detected immediate rebalances.
Immediate Rebalance Candles: toggles the visualization of higher timeframe candles where immediate rebalance is detected.
Confirmation (Bars): specifies the number of bars required to confirm the validation of the detected immediate rebalance.
Immediate Rebalance Icon: allows customization of the size of the icon used to represent the immediate rebalance.
🔹 Dashboard
Dashboard: toggles the visualization of the dashboard, sets its location, and customizes the size of the dashboard.
🔶 RELATED SCRIPTS
Fair-Value-Gap
Thanks to our community for recommending this script. For more conceptual scripts and related content, we welcome you to explore by visiting >>> LuxAlgo-Scripts .

Bullish Candlestick Patterns With Filters [TradeDots]The "Bullish Candlestick Patterns With Filters" is a trading indicator that identifies 6 core bullish candlestick patterns. This is further enhanced by applying channel indicator as filters, designed to further increase the accuracy of the recognized patterns.
6 CANDLESTICK PATTERNS
Hammer
Inverted Hammer
Bullish Engulfing
The Piercing Line
The Morning Star
The 3 White Soldiers
SIGNAL FILTERING
The indicator incorporates with 2 primary methodologies aimed at filtering out lower accuracy signals.
Firstly, it comes with a "Lowest period" parameter that examines whether the trough of the bullish candlestick configuration signifies the lowest point within a specified retrospective bar length. The longer the period, the higher the probability that the price will rebound.
Secondly, the channel indicators, the Keltner Channels or Bollinger Bands. This indicator examines whether the lowest point of the bullish candlestick pattern breaches the lower band, indicating an oversold signal. Users have the flexibility to modify the length and band multiplier, enabling them to custom-tune signal sensitivity.
Without Filtering:
With Filtering
RISK DISCLAIMER
Trading entails substantial risk, and most day traders incur losses. All content, tools, scripts, articles, and education provided by TradeDots serve purely informational and educational purposes. Past performances are not definitive predictors of future results.
