Vortex Candle MarkerVortex Candle Marker
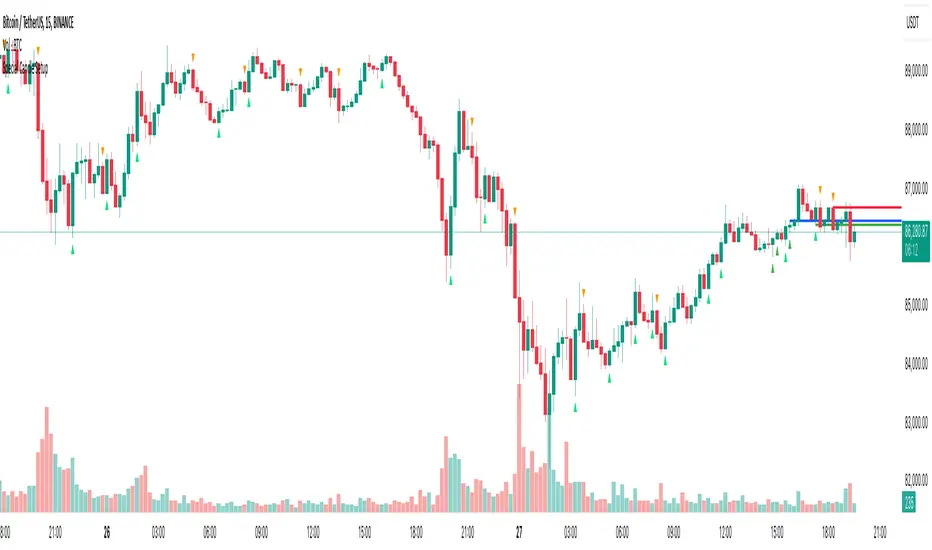
The Vortex Candle Marker is a specialized TradingView indicator designed to identify and highlight **Vortex Candles**—candles that momentarily form without wicks on either the high or low. This unique price behavior can signal potential price retracements or reversals, aligning with the **Power of Three (PO3)** concept in price action theory.
Indicator Logic:
A candle is classified as a **Vortex Candle** if either of these conditions is met during its formation:
1. **Vortex Top:** The **high** equals either the **open** or **close**, indicating no upper wick.
2. **Vortex Bottom:** The **low** equals either the **open** or **close**, indicating no lower wick.
When a Vortex Candle is detected, the indicator changes the **candle border color** to **aqua**, making it easy to identify these significant price moments.
Market Insight & PO3 Interpretation:
In typical price behavior, most candles exhibit both upper and lower wicks, representing price exploration before settling at a closing value. A candle forming without a wick suggests **strong directional intent** at that moment. However, by the **Power of Three (PO3)** concept—Accumulation, Manipulation, and Distribution—such wickless formations often imply:
- **Price Reversion Likelihood:** When a candle temporarily forms without a wick, it suggests the market may **revisit the opening price** to establish a wick before the candle closes.
- **Liquidity Manipulation:** The absence of a wick may indicate a **stop-hunt** or liquidity grab, where the price manipulates one side before reversing.
- **Entry Triggers:** Identifying these moments can help traders anticipate potential **retracements** or **continuations** within the PO3 framework.
Practical Application
- **Early Reversal Detection:** Spot potential price reversals by observing wickless candles forming at key levels.
- **Breakout Validation:** Use Vortex Candles to confirm **true breakouts** or **false moves** before the price returns.
- **Liquidity Zones:** Identify areas where the market is likely to revisit to create a wick, signaling entry/exit points.
This indicator is a powerful tool for traders applying **Po3** methodologies and seeking to capture price manipulation patterns.
Candlesticksignals

EBP Candle Marker### **EBP Candle Marker – TradingView Indicator**
The **EBP Candle Marker** is a specialized TradingView indicator designed to identify and highlight potential liquidity sweep candles. This indicator visually emphasizes key price action patterns where the market sweeps previous highs or lows and closes in the opposite direction, often signaling potential reversals or liquidity grabs.
---
### 📊 **Indicator Logic:**
1. **Bullish Sweep:**
- The current candle’s **low** is lower than the previous candle’s **low** (indicating a liquidity sweep).
- The **close** is above both the **open** and **close** of the previous candle.
2. **Bearish Sweep:**
- The current candle’s **high** is higher than the previous candle’s **high** (indicating a liquidity sweep).
- The **close** is below both the **open** and **close** of the previous candle.
---
### 🎨 **Visual Representation:**
- **Yellow Candle Body:** Highlights any candle meeting the bullish or bearish sweep conditions.
---
### 🔔 **Alert Functionality:**
The indicator supports setting custom alerts in TradingView for:
- **Bullish Sweep Detected** – Notifies when a bullish sweep occurs.
- **Bearish Sweep Detected** – Notifies when a bearish sweep occurs.
These alerts are compatible across any timeframe, providing flexibility to monitor key market conditions.
---
### 📈 **Use Cases:**
- **Liquidity Sweep Detection:** Identify areas where the market may be triggering stop-loss orders or liquidity hunts.
- **Reversal Confirmation:** Enhance trade confirmation by identifying potential reversal zones.
- **Scalping & Swing Trading:** Suitable for both short-term and long-term trading strategies across multiple timeframes.

Triangle Reversal IndicatorTriangle Reversal Indicator – A Visual Tool for Identifying Reversal Patterns
This indicator is designed to highlight potential trend reversal moments by comparing the current candle with the previous one. It offers a unique approach by focusing on distinct candle patterns rather than generic trend indicators, making it a valuable addition to your trading toolkit.
How It Works:
For a bullish signal, the indicator checks if:
The current candle is bullish (closing higher than it opens) while the previous candle was bearish.
The current candle’s low breaches the previous bearish candle’s low.
The current candle’s close is above the previous bearish candle’s close.
When these conditions are met, a tiny green triangle is plotted below the candle to signal a potential bullish reversal.
Conversely, for a bearish signal, it verifies if:
The current candle is bearish (closing lower than it opens) following a bullish candle.
The current candle’s high exceeds the previous bullish candle’s high.
The current candle’s close falls below the previous bullish candle’s close.
If all conditions are satisfied, a small red triangle appears above the candle to indicate a potential bearish reversal.
How to Use:
Simply apply the indicator on your chart and look for the tiny triangles that appear above or below the candles. These markers can serve as an additional visual cue when confirming entry or exit points, but it’s best used alongside your other analysis techniques.
Customization Options:
Users can further enhance the script by adding inputs for lookback periods, adjusting the triangle size, or modifying colors to match their chart themes.

Special Candle SetupThe Special Candle Setup Indicator is designed to detect significant bearish and bullish candlestick patterns , helping traders identify potential trend shifts and key price action setups . This indicator recognizes 8 bearish patterns and 6 bullish patterns , derived from multi-candlestick formations observed across different markets, including crypto, indices, forex, and stocks.
How It Works
This indicator scans the market for specific candlestick structures that indicate potential reversals or trend continuations . It includes:
• Bearish Patterns (8 types) : Identifies candlestick structures that suggest potential downside movement.
• Bullish Patterns (6 types) : Detects formations indicating upward momentum.
• Reversal Signals : Additional patterns that highlight key turning points in price action.
• Key Level Marking : Automatically draws support and resistance levels based on detected setups.
• Expiry Signals (Optional) : Highlights patterns commonly seen on expiry days in the Indian market, but these patterns are universally applicable to other asset classes as well.
Key Features
✔ Comprehensive Candlestick Pattern Recognition – Detects 14 key bullish and bearish formations.
✔ Reversal & Trend Continuation Setups – Helps identify both potential reversals and momentum-based entries.
✔ Automated Key Level Marking – Plots dynamic blue lines for key support and resistance zones.
✔ Customizable Pattern Selection – Allows users to enable/disable specific pattern types.
✔ Non-Repainting Signals – Ensures stability by maintaining signal integrity over time.
Customization Options
• Enable/Disable Specific Patterns – Users can disable main patterns or reversal patterns based on their preference, allowing them to focus on a single type of setup if needed.
• Key Level Customization – The blue lines represent critical price levels, drawn automatically based on identified patterns. These act as reference points for potential breakouts or reversals.
• Optional Expiry Signals – Includes patterns commonly observed on expiry days, primarily for the Indian market, but they also appear in global markets like crypto, forex, and indices.
How to Use
• Trend Trading – Use bullish and bearish patterns to identify entry points within an existing trend.
• Reversal Trading – Focus on reversal signals near key levels for potential market turnarounds.
• Key Level Validation – Utilize the blue lines to confirm important price zones.
• Customization – Tailor the indicator to your strategy by selecting only the patterns that align with your trading style.
Why This Combination?
This indicator blends multiple candlestick formations, ensuring a well-rounded approach to market analysis. The integration of expiry signals, reversal structures, and key level plotting makes it adaptable for various asset classes, not just expiry-based trading.
Why It’s Worth Using?
Manually spotting multiple candlestick setups can be time-consuming and subjective. This indicator automates the process, providing structured insights into market movements with clearly defined signals and key level plotting, making it valuable for traders across different markets.
IBS (Internal Bar Strength) Trading Strategy for SPY and NDQImplementation by AlgoTradeKit
Overview
The IBS Trading Strategy is a daily bars long-only trading system, based on the concept of Internal Bar Strength (IBS). The strategy aims to identify potential reversals by monitoring how the previous bar’s close positions itself within its high-low range. It is suitable for stock and US indices. The default parameters are optimized for SPY/SPX and NDQ/QQQ
Strategy Concept
The Internal Bar Strength (IBS) is calculated using the formula:
IBS = (Previous Close - Previous Low) / (Previous High - Previous Low)
This value always lies between 0 and 1. An IBS value below 0.2 is typically interpreted as an oversold condition, while a value above 0.9 suggests an overbought state.
Trading Rules
- Long Entry :
- Condition 1 : IBS is below the user-defined entry threshold (default is 0.2).
- Condition 2 : The current price is above an N-period Exponential Moving Average (EMA) (default period is 252).
- Note : You can disable the EMA condition by setting the EMA period to 0.
- Long Exit
- The position is closed when IBS rises above the user-defined exit threshold (default is 0.9).
Customization Options
- IBS Entry Threshold : Adjust to set the sensitivity for entering a long trade based on oversold conditions.
- IBS Exit Threshold : Customize to define the exit point when the market becomes overbought.
- EMA Period : Set the lookback period for the EMA to align with your trend bias; disable this condition by setting the period to 0.
Risk Management & Trading Considerations
- Designed for daily charts, the strategy captures higher timeframe trends and minimizes noise.
- The entry and exit conditions are straightforward, aiming to avoid over-trading while letting clear signals dictate trade management.
- Always use proper risk management techniques and test the strategy thoroughly on historical data and in a simulated environment before applying it in live markets.
Disclaimer
This strategy is for educational and informational purposes only and does not constitute financial advice. Trading involves risk, and past performance is not indicative of future results. Always conduct your own research and consider your risk tolerance before making any trades.

3 Red / 3 Green Strategy with Volatility CheckStrategy Name: 3 Red / 3 Green Strategy with Volatility Check by AlgoTradeKit
Overview
This long-only strategy is designed for daily bars on NASDAQ (or similar instruments) and combines simple price action with a volatility filter. It “tells it like it is” – enter when the market shows weakness, but only in sufficiently volatile conditions, and exit either on signs of a reversal or after a set number of days.
Entry Conditions
- Price Action :
Enter a long position when there are 3 consecutive red days (each day's close is below its open).
- Volatility Filter :
The entry is allowed only if the current ATR (Average True Range) calculated over the specified ATR Period (default 12) is greater than its 30-day simple moving average. This ensures the market has enough volatility to justify the trade.
Exit Conditions
- Reversal Signal :
Exit the long position when 3 consecutive green days occur (each day's close is above its open), signaling a potential reversal.
- Time Limit :
Regardless of market conditions, any open trade is closed if it reaches the Maximum Trade Duration (default 22 days). This helps limit exposure during stagnant or unfavorable market conditions.
- You can toggle the three-green-day exit if you want to isolate the time-based exit.
Input Parameters
- Maximum Trade Duration (days): Default is 22 days.
- ATR Period: Default is 12.
- Use 3 Green Days Exit: Toggle to enable or disable the three-green-day exit condition.
How It Works
1. Entry: The strategy monitors daily price action for 3 consecutive down days. When this occurs and if the market is volatile enough (current ATR > 30-day ATR average), it opens a long position.
2. Exit: The position is closed if the price action reverses with 3 consecutive up days or if the trade has been open for the maximum allowed duration - i.e. use it on daily chart.
Risk Management
- The built-in maximum trade duration prevents trades from lingering too long in a non-trending or consolidating market.
- The volatility filter helps ensure that trades are only taken when there is sufficient price movement, potentially increasing the odds of a meaningful move.
Disclaimer
This strategy is provided “as is” without any warranties. It is essential to backtest and validate the performance on your specific instrument and market conditions before deploying live capital. Trading involves significant risk, and you should adjust parameters to match your risk tolerance.
Test and tweak this strategy to see if it fits your trading style and market conditions. Happy trading!

Candle Momentum ExhaustionCandle Momentum Exhaustion
The Candle Momentum Exhaustion indicator is designed to help traders spot potential turning points in a trend by identifying when the prevailing momentum may be “running on empty.” The indicator works by comparing the size of each candle’s body (the absolute difference between the open and close) to the average body size over a recent period. When a candle’s body exceeds a user‐defined multiple of this average, it is flagged as an “exhaustion” candle.
• A bullish exhaustion (shown with a red down–facing triangle above the bar) occurs when a very large bullish candle (close > open) is detected, suggesting that buyers may have pushed the price too far and the rally could be near its end.
• A bearish exhaustion (shown with a green up–facing triangle below the bar) occurs when a very large bearish candle (close < open) is detected, implying that selling pressure might be overdone.
These signals can alert you to a potential reversal or consolidation point. The script also includes alert conditions so that you can set up notifications whenever an exhaustion signal is generated.
How It Works
1. Average Candle Body:
The script computes a simple moving average (SMA) of the absolute candle bodies over a user-defined period (default is 14 bars).
2. Exhaustion Candidate:
A candle is flagged as an exhaustion candidate if its body size exceeds the average by more than the set multiplier (default is 2.0).
3. Signal Identification:
• If the exhaustion candle is bullish (close > open), it is marked with a red down–facing triangle above the bar.
• If it is bearish (close < open), it is marked with a green up–facing triangle below the bar.
4. Alerts:
The built-in alertcondition() calls allow you to set alerts (via TradingView’s alert system) so that you can be notified when an exhaustion event occurs.
Risk Disclaimer:
This indicator is provided for educational and informational purposes only and does not constitute financial, investment, or trading advice. Trading and investing involve significant risk, and you should not rely solely on this indicator when making any trading decisions. Past performance is not indicative of future results. Always perform your own due diligence and consult with a qualified financial advisor before making any financial decisions. The creator of this indicator shall not be held responsible for any losses incurred through its use.

Naive Bayes Candlestick Pattern Classifier v1.1 BETAAn intermezzo on why i made this script publication..
A : Candlestick Pattern took hours to backtest, why not using Machine Learning techniques?
B : Machine Learning, no that's gonna be really heavy bro!
A : Not really, because we use Naive Bayes.
B : The simplest, yet powerful machine learning algorithm to separate (a.k.a classify) multivariate data.
----------------------------------------------------------------------------------------------------------------------
Hello, everyone!
After deep research in extracting meaningful information from the market, I ended up building this powerful machine learning indicator based on the evolution of Bayesian Statistics. This indicator not only leverages the simplicity of Naive Bayes but also extends its application to candlestick pattern analysis, making it an invaluable tool for traders who are looking to enhance their technical analysis without spending countless hours manually backtesting each pattern on each market!.
What most interesting part is actually after learning all of likely useless methods like fibonacci, supply and demand, volume profile, etc. We always ended up back to basic like support and resistance and candlestick patterns, but with a slight twist on strategy algorithm design and statistical approach. Thus, the only reason why i made this, because i exactly know that you guys will ended up in this position as time goes by.
The essence of this indicator lies in its ability to automate the recognition and statistical evaluation of various candlestick patterns. Traditionally, traders have relied on visual inspection and manual backtesting to determine the effectiveness of patterns like Bullish Engulfing, Bearish Engulfing, Harami variations, Hammer formations, and even more complex multi-candle patterns such as Three White Soldiers, Three Black Crows, Dark Cloud Cover, and Piercing Pattern. However, these conventional methods are both time-consuming and prone to subjective bias.
To address these challenges, I employed Naive Bayes—a probabilistic classifier that, despite its simplicity, offers robust performance in various domains. Naive Bayes assumes that each feature is independent of the others given the class label, which, although a strong assumption, works remarkably well in practice, especially when the dataset is large like market data and the feature space is high-dimensional. In our case, each candlestick pattern acts as a feature that can be statistically evaluated based on its historical performance. The indicator calculates a probability that a given pattern will lead to a price reversal, by comparing the pattern’s close price to the highest or lowest price achieved in a lookahead window.
One of the standout features of this script is its flexibility. Each candlestick pattern is not only coded into the system but also comes with individual toggles to enable or disable them based on your trading strategy. This means you can choose to focus on single-candle patterns like Bullish Engulfing or more complex multi-candle formations such as Three White Soldiers, without modifying the core code. The built-in customization options allow you to adjust colors and labels for each pattern, giving you the freedom to tailor the visual output to your preference. This level of customization ensures that the indicator integrates seamlessly into your existing TradingView setup.
Moreover, the indicator isn’t just about pattern recognition—it also incorporates outcome-based learning. Every time a pattern is detected, it looks ahead a predefined number of bars to evaluate if the expected reversal actually materialized. This outcome is then stored in arrays, and over time, the script dynamically calculates the probability of success for each pattern. These probabilities are presented in a real-time updating table on your chart, which shows not only the percentage probability but also the count of historical occurrences. With this information at your fingertips, you can quickly gauge the reliability of each pattern in your chosen market and timeframe.
Another significant advantage of this approach is its speed and efficiency. While more complex machine learning models like neural networks might require heavy computational resources and longer training times, the Naive Bayes classifier in this script is lightweight, instantaneous and can be updated on the fly with each new bar. This real-time capability is essential for modern traders who need to make quick decisions in fast-paced markets.
Furthermore, by automating the process of backtesting, the indicator frees up your time to focus on other aspects of trading strategy development. Instead of manually analyzing hundreds or even thousands of candles, you can rely on the statistical power of Naive Bayes to provide you with insights on which patterns are most likely to result in profitable moves. This not only enhances your efficiency but also helps to eliminate the cognitive biases that often plague manual analysis.
In summary, this indicator represents a fusion of traditional candlestick analysis with modern machine learning techniques. It harnesses the simplicity and effectiveness of Naive Bayes to deliver a dynamic, real-time evaluation of various candlestick patterns. Whether you are a seasoned trader looking to refine your technical analysis or a beginner eager to understand market dynamics, this tool offers a powerful, customizable, and efficient solution. Welcome to a new era where advanced statistical methods meet practical trading insights—happy trading and may your patterns always be in your favor!
Note : On this current released beta version, you must manually adjust reversal percentage move based on each market. Further updates may include automated best range detection and probability.

HTF CandlesHTF Candles, Plot of a Higher/Lower Timeframe Candles on any chart.
This HTF / LTF candle plot displays the previous 3 daily candles with the current update of the price with reference to a lower time frame.
Candles includes 3 Candles of HTF
last HTF candle includes 4 previous candles from LTF
Candle High Low Open Close are plotted.
these OHLC values act as Support and Resistance With reference to current Price.
very useful in making HTF and LTF analysis with reference to current timeframe.

RCYC Bullish Bearish Indicator
Summary: The RCYC Bullish Bearish Indicator is a custom trading tool designed to help traders identify potential bullish and bearish conditions in the market using a combination of KDJ and RSI indicators. This indicator uses color-coded candles to visually represent bullish and bearish signals, making it easy to identify trend changes on the chart. The script is particularly useful for traders who prefer visual signals and want to incorporate both trend momentum (KDJ) and relative strength (RSI) in their analysis.
Description:
The RCYC Bullish Bearish Indicator is a unique mashup of the KDJ and RSI indicators, optimized to provide a clear visual representation of market conditions through color-coded candles. This indicator not only identifies the potential trend shifts but also provides alerts for significant crossover points, enhancing a trader's ability to make informed decisions.
How It Works:
KDJ Calculation:
The KDJ is a variation of the Stochastic Oscillator that includes the %J line, which can go beyond the typical 0-100 range of %K and %D.
The KDJ component of this indicator calculates the highest high and lowest low over a specified period (KDJ Length), using these values to derive the %K line.
The %D line is a smoothed version of %K, and the %J line is derived from %K and %D using the formula: J = 3 * %K - 2 * %D.
This indicator focuses on the behavior of the %J line in relation to a mid-point level (50), identifying crossovers and crossunders that signal potential shifts in market sentiment.
RSI Calculation:
The Relative Strength Index (RSI) is a momentum oscillator that measures the speed and change of price movements. It is widely used to identify overbought or oversold conditions.
In this indicator, RSI values are adjusted and plotted to align visually with the KDJ values, providing a complementary momentum analysis.
Crossover Logic and Candle Coloring:
The indicator tracks two main events:
CrossOver50: When the %J line crosses above the 50 level, indicating potential bullish momentum.
CrossUnder50: When the %J line crosses below the 50 level, indicating potential bearish momentum.
Depending on the crossover events, the script changes the color of the candles on the chart:
Red candles on the initial crossover above 50, followed by dark blue candles to maintain bullish sentiment.
Yellow candles on the initial crossover below 50, followed by light blue candles to maintain bearish sentiment.
Alerts:
The indicator includes alert conditions for both bullish and bearish signals:
Red Candle Alert: Notifies the trader when the %J line crosses above 50.
Yellow Candle Alert: Notifies the trader when the %J line crosses below 50.
These alerts allow traders to react promptly to key market signals without continuously monitoring the chart.
Usage and Benefits:
This indicator is designed for traders looking to combine momentum and trend analysis into a single visual tool. It is particularly useful for those trading in trending markets or looking for entry/exit signals based on momentum shifts.
The color-coded candles provide an intuitive way to assess market conditions at a glance, reducing the complexity associated with analyzing multiple indicators separately.
By integrating both KDJ and RSI, the RCYC Bullish Bearish Indicator offers a balanced approach to trend detection and momentum confirmation, making it versatile for various trading styles, including scalping, swing trading, and position trading.
Originality and Usefulness:
While the indicator builds upon the familiar concepts of KDJ and RSI, it uniquely merges them into a cohesive visual tool with distinct crossover-based alerts and candle coloring.
This approach makes the indicator original, as it simplifies the interpretation of complex signals into straightforward visual cues, enhancing the decision-making process for traders who prefer chart-based analysis.

First Candle High Low LevelsDescription
The "First Candle High Low Levels" Pine Script indicator is designed to highlight the high and low levels of the first candle of the day on your TradingView chart. It works across different timeframes and specifically handles the Indian stock market trading hours (9:15 AM to 3:30 PM IST). The script draws a box from the start to the end of the trading session, visually marking the price range defined by the first candle of the day. Traders can customize the box's border color, fill color, and line width.
Features
Customizable Timeframe: Users can select the desired timeframe for the first candle (e.g., 5-minute, 15-minute, etc.).
Custom Box Appearance: Options to adjust the border color, fill color, and line width of the drawn box.
Auto Reset for Each New Day: The high and low of the first candle are reset daily to mark the start of the next trading day.
Accurate Market Session Handling: The box is drawn from the start of the first candle to the end of the trading session (3:30 PM IST).
Usage
Adding to Chart: Apply the script by copying it into the Pine Script editor in TradingView. Once added, the script will automatically draw a box representing the high and low of the first candle of the day.
Select Timeframe: You can adjust the First Candle Timeframe input to define which timeframe candle will be used for marking the high and low. For example, if you choose a 5-minute timeframe, the high and low of the first 5-minute candle will be used.
Customization:
Adjust the Border Color and Box Fill Color through the input settings to match your chart's style.
Modify the Box Line Width to make the box lines more or less prominent.

Morning & Evening Star Pro (Candle Pattern)Hello Traders!
The Morning & Evening Star Pro indicator often catches the absolute top or bottom of a move and is a reliable reversal indicator. It also provides excellent entries in a strong trending market. For example, in an uptrend you can use a morning star as a pullback entry signal.
The indicator is an advanced tool for identifying powerful reversal patterns in the market. It combines traditional candlestick analysis with modern technical indicators to provide traders with high-probability entry and exit signals.
Key features:
Accurate pattern detection:
Utilizes sophisticated algorithms to identify genuine Morning Star and Evening Star patterns, filtering out false signals.
Trend filter:
Incorporates a customizable Simple Moving Average (SMA) to align signals with the overall market trend, enhancing trade quality.
Volatility awareness:
Integrates Average True Range (ATR) calculations to ensure detected patterns are significant relative to recent price action.
Visual clarity:
Highlights Morning Star and Evening Star patterns with customizable colors and shapes, making them easy to spot on the chart.
Flexible customization:
Offers a wide range of user inputs to tailor the indicator to various trading styles and preferences.
Filtered signal display:
Option to show filtered-out signals, providing insight into the indicator's decision-making process.
Morning Star
Is a bearish reversal (or continuation) pattern consisting of three candles:
A large bearish candle
A small-bodied candle like a Doji or Pin bar
A bullish candle
Evening Star
Is a bullish reversal (or continuation) pattern consisting of three candles:
A large bullish candle
A small-bodied candle like a Doji or Pin bar
A bearish candle
Key differences in this implementation
The middle candle can be either a Doji or a Pin bar, expanding the traditional definition.
The second candle can be a Pin bar, and the third candle can be an outside bar reversal, allowing for more flexibility in pattern recognition.
What makes this indicator unique
Comprehensive pattern analysis:
Goes beyond simple price action by considering multiple factors such as candle body ratios, wick lengths, and relative positions to previous candles.
Adaptive to market conditions:
Uses dynamic thresholds based on recent volatility (ATR) to adjust pattern detection criteria.
Educational value:
The option to display filtered signals helps traders understand why some patterns are rejected, aiding in skill development.
How to Trade with this Indicator:
This indicator often catches the absolute top or bottom of a move and is a reliable reversal indicator. It also provides excellent entries in a trending market. For example, in a strong uptrend you can use morning star signals to enter in a pullback.
Bullish Opportunities:
Look for Morning Star patterns (aqua-colored candles and labels) as potential buy signals.
Bearish Opportunities:
Watch for Evening Star patterns (orange-colored candles and labels) as potential sell signals.
Entry: At next bar open (after the aqua-colored candle for bullish or orange-colored candle for bearish completes)
Stop loss: 2 ticks below/above the pattern's low/high.
Stop loss alternative: If the colored candle is a very strong candle (e.g. for morning star a candle with almost no down wick and a close near the top) the stop goes 2 ticks below/above the colored candle.
Take profit: 3R or use a trailing stop.
Trend Alignment:
For conservative trading, only take trades in the direction of the overall trend as indicated by the SMA.
Note: if you want to see candle coloring of the morning and evening star, you must put the indicator to the top of the object tree.

Market Waves [BigBeluga]MARKET WAVES
Market Waves The Market Waves [ BigBeluga ] is an all in one toolkit focusing on trends, accumulations and identifying market structures right on your chart. It is lightweight and powerful in its approaches, taking unique mathematical approaches to classical tools.
⬤ Signals
The Beluga Signals combine tested powerful ideas into a single tool. They are designed to follow trends and reduce noise in the market using low pass filtering methods. There are two types of signals founds in this toolkit; normal and power signals. Power signals are signals with a + in them indicating that the signal may be more likely to play out.
These are great when used in confluence with other trend following tools to filter them for even greater performance. Naturally traders will want to use these with confluence to confirm the trend identification.
The signals come with take profits built in. Ticks are placed on the chart indicating a potential areas to be taking profit. Using these as exits can be powerful especially when using confluence. Max Profit labels are also produced suggesting it really is the ideal time to be exiting the market before a reversal comes.
By leveraging unique low lag methods and filtering approaches, these signals offer a unique edge when compared to classical TSL such as a SuperTrend or PSAR.
⬤ Smooth Trend
The Smooth Trend (shown here with green and red shadows) also focuses on low lag noise filtering. This unique system is perfect when used for entries or as a filter. Users are able to adjust how fast or slow the trend is identified.
In the example above, we see a sell signal during the time the smooth trend is green. Therefore using confluence we can filter out the signal and proceed to take our power buy signal.
Percentages are also provided at the start of the trend. These indicate the probability this really is a new trend. In the image above we again see the trends are both labelled as 100% and the system is fully confident what we were seeing was indeed a trend reversal.
Although it may appear as a classical trend following tool, again it's uniqueness lies in its ability to locate market bottoms and respond to trends.
⬤ The Trend Accumulations
This feature focuses on elegant trend and range identification making trader's lives easier. By not cluttering the chart this system allows traders to see an asset's behavior without overlays.
Uptrends, downtrends and ranges are identified with uptrends showing with a green base line, downtrends with a red one and ranges/accumulations in blue. As shown in the image above; this is a powerful system to avoid trading ranges/chop in the market. We see a blue accumulation zone, this means the market is best to avoid. We then transition to a faint green suggesting the market is starting to move upwards.
Leveraging range detection techniques, this gives responsive market structure identification at a glance.
⬤ Voltix Bands
The Voltix Bands are a type of volatility-based band used to gauge market volatility and identify potential trading opportunities. These bands consist of two components: an upper band and a lower band. The distance between the bands fluctuates based on market volatility. When the market is highly volatile, the bands widen, and when volatility is low, the bands contract. They are unique as they uniquely apply distributions and weight volatility accordingly.
How to Use Voltix Bands:
When the price moves outside the Voltix Bands, it often signals a potential breakout. A close above the upper band may indicate the start of an upward trend, while a close below the lower band might signal the beginning of a downward trend.
Traders often use these breakout signals to enter trades in the direction of the breakout.
Detecting Overbought and Oversold Conditions:
When the price touches or moves beyond the upper Voltix Band, it can suggest that the market is overbought, indicating a potential reversal or pullback.
Conversely, when the price touches or drops below the lower Voltix Band, it may indicate an oversold condition, suggesting a possible price increase or trend reversal.
Volatility Contraction and Expansion:
Tightening Voltix Bands (when the bands contract) often precedes a significant price movement. This phenomenon is known as the "squeeze." When the bands tighten, it indicates a period of low volatility, and traders often anticipate an imminent breakout in either direction.
Widening Voltix Bands (when the bands expand) signal increasing volatility. Traders can use this as a cue to either ride the trend or be cautious of potential reversals.
Trend Following:
In trending markets, the price often stays close to the upper or lower band for extended periods. Traders can use this characteristic to follow the trend, staying long when the price is near the upper band and short when it is near the lower band. The bands also provide color coding and are green during an uptrend and purple during a downtrend.
⬤ Candle Coloring
1. Volume-Based Candle Coloring
Volume-based candle coloring mode changes the color of each candlestick according to the trading volume associated with that period. This method helps traders quickly identify periods of high or low market activity and understand the strength behind price movements.
How It Works:
High Volume: Candles are colored differently (red bearish, bright blue for bullish) when the trading volume is significantly higher than the average. This indicates strong buying or selling interest.
This mode is useful for identifying potential breakouts or fakeouts. For example, a price breakout accompanied by high volume suggests a strong move, while a breakout on low volume might indicate a lack of conviction, potentially leading to a false breakout.
2. Trend-Based Candle Coloring
Trend-based candle coloring mode changes the color of candlesticks depending on the current market trend, helping traders visually distinguish between bullish and bearish phases and neutral periods.
How It Works:
Bullish Trend: Candles are colored green when the price is in an uptrend.
Bearish Trend: Candles are colored red when the price is in a downtrend.
Usage:
This mode is beneficial for trend-following strategies, allowing traders to quickly assess the overall market direction and align their trades with the prevailing trend.
3. Momentum-Based Candle Coloring
In this momentum-based candle coloring mode, candlesticks are colored yellow for strong bullish momentum and pink for strong bearish momentum. This visual approach highlights the intensity of market movements, helping traders quickly identify prevailing momentum and potential trend shifts.
How It Works:
Strong Bullish Momentum (Yellow Candles):
Candles turn yellow when the market exhibits strong upward momentum. This might be triggered by a proprietary technique that detects when buying pressure is significantly driving prices higher, indicating that the market is experiencing robust bullish activity.
Yellow candles suggest that the price is likely to continue rising, and traders may look to capitalize on this momentum.
Strong Bearish Momentum (Pink Candles):
Candles turn pink when strong downward momentum is detected. The same technique identifies when selling pressure is dominant, pushing prices lower at a significant pace.
Pink candles indicate that bearish forces are strong, with the price likely to keep declining, making it a potential opportunity for short-selling or exiting long positions.
This color scheme is particularly beneficial for traders who prioritize momentum-based strategies. The clear distinction between strong bullish (yellow) and bearish (pink) momentum provides an instant visual cue, enabling quick decision-making.
Entering Trades:
Traders might choose to enter long positions when a series of yellow candles appears, indicating strong bullish momentum.
Alternatively, pink candles may signal an opportune moment to enter short positions, capturing the market's downward momentum.
Exiting Trades:
A shift from pink to yellow candles in a previously bearish trend could indicate a reversal, prompting traders to exit short positions.
The Market Waves toolkit is a powerful collection of unique and powerful tools. Please use DD when trading and always manage risk.
Script a pagamento

Big Candle HighlighterBig Candle Highlighter
The Big Candle Highlighter indicator highlights significant candles based on their percentage difference between the open and close prices. This tool helps traders quickly identify candles with substantial price movements, which can be crucial for spotting key price action, potential reversals, or significant market events.
Key Features:
Percentage Threshold : Customize the minimum percentage difference from open to close required to mark a candle as "big."
Bullish and Bearish Markers : Bullish big candles are marked with a label below the bar in green, while bearish big candles are marked with a label above the bar in red.
Background Highlighting : Optionally highlight the background of big candles for better visual emphasis.
Inputs:
Percentage Threshold (% ): Set the percentage threshold to define what constitutes a "big" candle. For example, a threshold of 2.0 means that only candles with a 2% or more difference between open and close will be marked.
Color for Big Bullish Candle : Choose the color for labeling and highlighting bullish big candles.
Color for Big Bearish Candle : Choose the color for labeling and highlighting bearish big candles.
Usage :
This indicator is useful for traders looking to identify significant price movements and potential trading opportunities. By focusing on candles that show substantial changes from open to close, you can better understand market dynamics and make more informed trading decisions.
Add the Big Candle Marker to your charts to enhance your technical analysis and stay ahead of market trends.

BCA Candlestick Pattern Condition BuilderThe "Candlestick Pattern Condition Builder" is an indicator developed for traders who want to create and customize their own trading strategies based on candlestick patterns. It allows users to set specific conditions for entering and exiting trades, both long and short. By enabling traders to define up to five conditions based on various price points (Open, High, Low and Close) and logical operators, it provides a flexible framework for building complex trading strategies tailored to individual preferences and market behavior.
Now traders can easily configure their favorite candlestick patterns like Doji, three white soldiers, three black crows or any other pattern using this indicator.
Here are the settings to customize the indicator:
Intraday Setting:
The indicator supports time-based trading by allowing users to define specific intraday sessions. Traders can set the start and end times for trading activities, ensuring that the strategy only executes trades within the defined market hours. This feature is particularly useful for intraday traders who want to avoid overnight positions and focus on capturing intraday price movements. Users can toggle the time-based entry and exit settings on or off, providing additional flexibility in managing their trading sessions.
Long and Short Candle Configuration:
"Condition Builder" enables users to configure conditions for both long and short trades using historical candle data. Traders can select different price points (open, high, low, close) from the past five bars to create their conditions. Each condition can be set with logical operators such as greater than, less than, greater than or equal to, less than or equal to, and equal to. This allows for detailed and precise condition-building, enabling traders to tailor their strategies to specific market patterns and behaviors. Note that between any two candlestick conditions "AND" operator is used.
Candle number representation as follows:
0 - N candle (current candle)
1 - N-1 candle (previous candle)
2 - N-2 candle
3 - N-3 candle
4 - N-4 candle
Stoploss and Target Options:
The indicator allows users to set stop-loss and target levels based on various criteria. Traders can choose to set these levels as a percentage, a fixed number of points, or based on the highest or lowest prices of selected candles. Additionally, the indicator supports risk
targets, providing a method to calculate targets in relation to the stop-loss distance. These features help traders manage their risk effectively and ensure that their strategies have well-defined exit points.
Stoploss Options:
1. Percentage Stoploss:
This option allows traders to set a stop-loss level as a percentage of the entry price. For example, if the stop-loss is set at 2%, the trade will close if the price moves 2% against the entry price. This dynamic approach adjusts the stop-loss level based on the trade's entry price, providing flexibility and proportional risk management.
2. Points Stoploss:
With this option, traders specify a fixed number of points for the stop-loss. For instance, if the stop-loss is set to 50 points, the trade will close if the price moves 50 points against the entry price. This fixed approach is straightforward and easy to implement, offering a clear and consistent risk threshold.
3. Highest/Lowest of Selected Candles:
This stop-loss method uses the highest or lowest prices of selected historical candles to determine the stop-loss level. Traders can select specific past bars, and the stop-loss will be set at the highest high (for short trades) or the lowest low (for long trades) of those bars. This method is useful for incorporating recent price action into risk management.
Target Options:
1. Percentage Target:
Similar to the percentage stop-loss, this option sets the target level as a percentage of the entry price. If the target is set at 5%, the trade will aim to close when the price moves 5% in favor of the entry price. This approach ensures that the target is proportionally related to the entry price, aligning with the trader’s desired profit margin.
2. Points Target :
This target option allows traders to set a specific number of points as the target. For example, if the target is set to 100 points, the trade will aim to close when the price moves 100 points in favor of the entry price. This method provides a clear and fixed profit goal, making it easy to implement and understand.
3. Risk:Reward :
The Risk:Reward sets the target level based on a multiple of the stop-loss distance. For example, with a risk ratio of 1:2 and a stop-loss distance of 50 points, the target will be set at 100 points (2 times the stop-loss distance). This approach helps traders maintain a consistent risk profile, aiming for higher profits relative to the risk taken on each trade.
Best practice: Use it with other price action concepts or indicators to make it effective.

Shadow Increase SignalThis indicator Calculates the average upper shadow of the previous 200 candles for issuing SELL signals.
And calculates the average lower shadow of the previous 200 candles for issuing BUY signals.
If the upper shadow of the new candle is %1000 greater than the average upper shadow of the previous 200 candles, a SELL signal is issued and a red arrow appears above the candle.
If the lower shadow of the new candle is %1000 greater than the average lower shadow of the previous 200 candles, a BUY signal is issued and a green arrow appears below the candle.

EngulfScanEngulf Scan
Introduction:
The Engulf Scan indicator helps users identify bullish and bearish engulfing candlestick patterns on their charts. These patterns are often used as signals for trend reversals and are important indicators for traders. Engulf Scan signals are generated when an engulfing pattern is swallowed by another candlestick of the opposite color.The signal of a candle engulfment formation is generated when the 1st candle is engulfed by the 2nd candle and the 2nd candle is engulfed by the 3rd candle.
Features:
Bullish Engulfing Pattern: Indicates the start of an upward trend and typically signals that the market is likely to move higher.
Bearish Engulfing Pattern: Indicates the start of a downward trend and typically signals that the market is likely to move lower.
Color Coding: Users can customize the background colors for bullish and bearish engulfing patterns.
Usage Guide:
Adding the Indicator: Add the "Engulf Scan" indicator to your TradingView chart.
Color Settings: Choose your preferred colors for bullish and bearish engulfing patterns from the indicator settings.
Pattern Detection: View the engulfing patterns on the chart with the specified colors and symbols. These patterns help identify potential trend reversal points.
Parameters and Settings:
Bullish Engulfing Color: Background color for the bullish engulfing pattern.( Green)
Bearish Engulfing Color: Background color for the bearish engulfing pattern. (Red)
Examples:
Bullish Engulfing Example: On the chart below, you can see bullish engulfing patterns highlighted with a green background. (Green)
Bearish Engulfing Example: On the chart below, you can see bearish engulfing patterns highlighted with a red background. (Red)
Frequently Asked Questions (FAQ):
How are engulfing patterns detected?
Engulfing patterns are formed when a candlestick completely engulfs the previous candlestick. For a bullish engulfing pattern, a bullish candlestick follows a bearish one. For a bearish engulfing pattern, a bearish candlestick follows a bullish one.
Which timeframes work best with this indicator?
Engulfing patterns are generally more reliable on daily and higher timeframes, but you can test the indicator on different timeframes to see if it fits your trading strategy.
Can I detect a reversal or trend?
As can be seen in the image, it sometimes appears as a return signal and sometimes as a harbinger of an ongoing trend.But it may be a mistake to use the indicator only for these purposes. However, this indicator may not be sufficient when used alone. It can be combined with different indicators from the Tradingview library.
Updates and Changelog:
v1.0: Initial release. Added detection and color coding for bullish and bearish engulfing patterns.
-Please feel free to write your valuable comments and opinions. I attach importance to your valuable opinions so that I can improve myself.

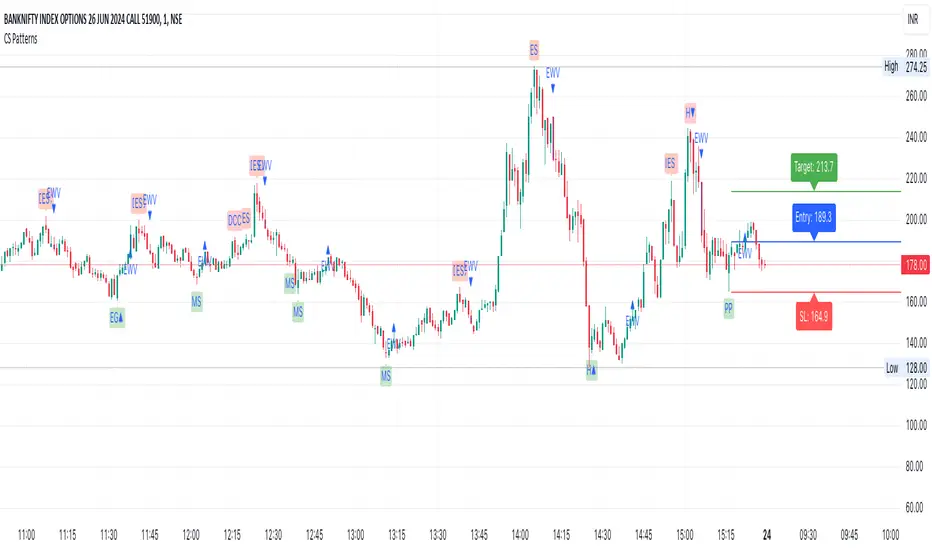
CS PatternsOverview
The CS Patterns indicator is designed to identify and highlight various candlestick patterns on a trading chart. Candlestick patterns are a crucial tool for traders as they help in predicting market movements and potential reversals. This indicator includes single, double, and triple candlestick patterns without revealing the source code, making it an ideal tool for traders who want to utilize advanced pattern recognition while keeping the script proprietary.
Candlestick Patterns Included
Single Candlestick Patterns
Bullish Hammer:
Found at the bottom of a downtrend.
Features a small body, long lower shadow, and little to no upper shadow.
Indicates potential reversal to an uptrend.
Bearish Hanging Man:
Found at the top of an uptrend.
Similar structure to the Bullish Hammer but indicates a potential reversal to a downtrend.
Bullish Inverted Hammer:
Found at the bottom of a downtrend.
Features a small body, long upper shadow, and little to no lower shadow.
Suggests a potential reversal to an uptrend.
Bearish Shooting Star:
Found at the top of an uptrend.
Indicates a potential reversal to a downtrend.
Dragonfly Doji:
Small or non-existent upper shadow and long lower shadow.
Indicates a potential reversal when found at the bottom of a trend.
Gravestone Doji:
Long upper shadow and small or non-existent lower shadow.
Indicates a potential reversal when found at the top of a trend.
Standard Doji:
Very small body, indicates indecision in the market.
Can signal reversals when found at the tops or bottoms of trends.
Long-Legged Doji:
Long upper and lower shadows with a small body.
Indicates a potential market reversal.
Double Candlestick Patterns
Bullish Engulfing:
A smaller bearish candle followed by a larger bullish candle that engulfs it.
Indicates a potential reversal to an uptrend.
Bearish Engulfing:
A smaller bullish candle followed by a larger bearish candle that engulfs it.
Indicates a potential reversal to a downtrend.
Bullish Harami:
A large bearish candle followed by a smaller bullish candle within its range.
Indicates a potential reversal to an uptrend.
Bearish Harami:
A large bullish candle followed by a smaller bearish candle within its range.
Indicates a potential reversal to a downtrend.
Bullish Piercing Line:
A bearish candle followed by a bullish candle that closes above the midpoint of the previous candle.
Indicates a potential reversal to an uptrend.
Bearish Dark Cloud Cover:
A bullish candle followed by a bearish candle that closes below the midpoint of the previous candle.
Indicates a potential reversal to a downtrend.
Bullish Inside Bar:
A smaller bullish or bearish candle completely within the range of the previous bearish candle.
Indicates a potential continuation or reversal to an uptrend.
Bearish Inside Bar:
A smaller bullish or bearish candle completely within the range of the previous bullish candle.
Indicates a potential continuation or reversal to a downtrend.
Triple Candlestick Patterns
Bullish Morning Star:
A bearish candle followed by a smaller-bodied candle (bullish or bearish), and then a larger bullish candle.
Indicates a potential reversal to an uptrend.
Bearish Evening Star:
A bullish candle followed by a smaller-bodied candle (bullish or bearish), and then a larger bearish candle.
Indicates a potential reversal to a downtrend.
How to Use?
Adding the Indicator:
Open TradingView and go to the Pine Script Editor.
Copy and paste the provided code into a new script.
Save and add the script to your chart.
Interpreting the Signals:
The indicator will highlight the patterns on the chart with specific labels.
Use these visual cues to make informed trading decisions based on potential reversals or continuations indicated by the patterns.
Customizing the Settings:
The indicator allows for customization of various settings through input options.
Adjust these settings according to your trading strategy and preferences.
Trend Bars Pro (HTF PO3)Hello Traders!
The innovative TRN Trend Bars Pro are designed to help traders to analyze markets in an intuitive way and provide high probability entry and exit signals. It combines three core concepts:
TRN Trend Bars to see the current trend and reversals (replaces the default chart bars)
Bar Ranges to highlight consolidations
Dynamic Trend to see the overall trend.
First, let's have a look at each of these concepts individually. Afterwards, we describe how a combination of all three gives you a crystal-clear picture of the market.
TRN Trend Bars Pro
They show bullish and bearish trends and reversals based on color coding the bars and give high probability trade opportunities with special colors. The trend analysis is based on a new algorithm that includes several different inputs:
classical and advanced bar patterns and their statistical frequency
probability distributions of price expansions after certain bar patterns
bar information such as wick length in %, overlapping of the previous bar in % and many more
historical trend and consolidation analysis
The algorithm weighs these concepts and outputs a color scheme for the chart bars or candlesticks.
Bar Types
Trend bars in green and red
Reversal Bars in blue and fuchsia
Continuation Bars in turquoise and orange
Breakout Bars in dark green and pink
Green Bars signify a sustained uptrend, indicating bullish market sentiment. On the other hand, Red Bars indicate a persistent downtrend, representing bearish market sentiment. The transition from red to green denotes a bullish trend reversal, suggesting a shift from bearish to bullish sentiment. Conversely, the shift from green to red signals a bearish trend reversal, indicating a transition from bullish to bearish sentiment. By monitoring these color changes, traders can identify potential trend reversals and make informed trading decisions.
The presence of gray and black bars indicates a neutral market state, often observed before an impending color change from red to green or green to red. These neutral bars serve as a transition phase between the previous trend and the potential reversal.
The TRN Trend Bars Pro incorporate signal bars, distinguished by their distinct colors, to offer potential buy and sell signals and deeper insights into market dynamics.
Reversal Bars
The presence of blue Reversal Bars indicates a trend reversal to the upside, while pink Reversal Bars indicate a reversal to the downside. These bars not only serve as signals for potential trend shifts but also present favorable opportunities to enter the market or increase one's position size.
Continuation Bars
In addition to the reversal bars, the indicator also includes bullish continuation bars (colored turquoise) and bearish continuation bars (colored orange). These bars act as signals for the continuation of an existing trend. Like the reversal bars, they can be utilized as entry points or opportunities to augment one's position size.
Breakout Bars
The dark green breakout bars within TRN Trend Bars Pro show a powerful breakout from a price range detected by our integrated bar range feature. They signify the continuation or potential change in a trend following a consolidation phase. As such, these bars hold dual functionality, serving as reversal signals and validating the persistence of an ongoing trend.
Bar Ranges
The bar range feature automatically finds consolidations where the price range of several consecutives bars is rather small. The detection of the bar ranges includes among other things the overlapping percentage of these bars.
How to Use Price Ranges
Here are a few ways you can use the bar ranges in your trading:
Identify Support and Resistance Levels
The price ranges can help you identify key support and resistance levels on a chart. By observing price ranges and identifying these levels, you can make more informed decisions about entering or exiting trades.
Breakout Trading
Price ranges can also provide insights into potential breakout opportunities. Breakouts occur when the price breaks out of a defined range, signaling a potential shift in market sentiment and the start of a new trend. The Color highlighted Breakout Bars from the TRN Trend Bars Pro are signaling a powerful breakout of a price range. Traders can enter positions in the direction of the breakout and set appropriate stop-loss orders to manage risk. Note that not every price range is left by a powerful breakout.
Dynamic Trend
The Dynamic Trend combines elements from standard trend strength indicators (e.g. DI-, DI+, Parabolic SAR) and volatility indicators (e.g. ATR, Standard Deviation). It produces a moving average line that adapts to changing market volatility. It is inspired by the ideas of the programmer and trader Fat Tails. The adaptive behavior provides more relevant information for traders when compared to traditional moving averages which do not consider volatility and trend strength together. This makes the Dynamic Trend completely unique, and no other moving average indicator can give you this precision.
How to use Dynamic Trend
Generally, a rising Dynamic Trend line, displayed in green, indicates that an uptrend is strong, while a falling Dynamic Trend, displayed in red, suggests that the downtrend is sharp. The Dynamic Trend turns gray when there is insufficient clarity to establish a distinct trend and especially when there is not volatility in the market.
Identify potential trade entries and exits: When used in conjunction with price action, the Dynamic Trend can provide potential trade signals. For example, if the price crosses above the Dynamic Trend, it may be a bullish sign, suggesting a potential buy entry. Conversely, if the price crosses below the Dynamic Trend, it may indicate bearish conditions and a potential sell signal.
Trend Identification and Pullback trading
Observe the Dynamic Trend's color. When it's on the rise and appears green, it indicates a bullish trend. Conversely, if it's in decline and displayed in red, it signals a bearish trend.
If Dynamic Trend is green and price pulls from above back to the Dynamic Trend, then this can be considered as a bullish signal.
If Dynamic Trend is red and price pulls from below back to the Dynamic Trend, then this can be considered as a bearish signal.
In the event of a bearish signal, such as a bearish TRN Signal Bar, and the Dynamic Trend is red, it provides additional confirmation to the bearish signal. Likewise, bullish signals gain added conviction when the Dynamic Trend is green.
Crossovers
As with other moving averages, crossovers between the Dynamic Trend and the price can be significant.
If price is crossing above the Dynamic Trend, then this can be considered as a bullish signal.
If price is crossing below the Dynamic Trend, then this can be considered as a bearish signal.
If you currently hold a position, both bullish and bearish crossovers can serve as potential exit signals. For instance, in the case of a long position, a bearish crossover can indicate a potential shift in sentiment, signaling a bearish reversal and a potential opportunity to close your long position.
Filtering Noise
Due to its adaptive nature, the Dynamic Trend can be a useful tool to filter out market noise. When the market is choppy or consolidating, the Dynamic Trend tends to remain flat and colored gray, signaling traders to potentially stay out of the market.
Stop Losses
The Dynamic Trend can also be used as a dynamic stop loss. For instance, in a long trade, traders can use the Dynamic Trend as a trailing stop, selling their position if the price crosses below the Dynamic Trend.
Combining TRN Trend Bars Pro, Bar Ranges and Dynamic Trend together
Combining all three concepts gives you a crystal-clear picture of the market. The Dynamic Trend shows you the overall trend. If price pulls back to the dynamic trend line and then price picks up the trend direction again, then the TRN Trend Bars Pro immediately switches the color to the trend direction. Therefore, you can easily identify high probability entry signals based on the bar color.
As a simple trading model, you can set the stop loss below the last swing or below a TRN signal bar (vice versa for short entries) and use 2.5 R or 3 R as target.
You can increase the success rate of the high probability TRN signal bars entries even more if they are in line with the Dynamic Trend line.
On the other hand, the TRN Bar Ranges help you to stay out of the market in case the price does not really change. As a confluence signal to stay flat in this period the dynamic trend line tends to be grey as well. If the price breaks out of the range, then the indicator prints a breakout bar which serves as a high probability entry signal.
Although it is possible to switch off any of these concepts, it is highly recommended to use all three in combination to get a crystal-clear picture of the market.
Alerts
Experience the power of our TRN Trend Bars Pro alerts, delivering real-time notifications for trend changes, price range breakouts, and signal bar formations or confirmations. Stay on top of the market with these versatile alerts, customizable to your preferred assets and timeframes.
Conclusion
While signals from TRN Trend Bars Pro can be informative, it is important to recognize that their reliability may vary. Various external factors can impact market prices, and it is essential to consider your risk tolerance and investment goals when executing trades.
Risk Disclaimer
The content, tools, scripts, articles, and educational resources offered by TRN Trading are intended solely for informational and educational purposes. Remember, past performance does not ensure future outcomes.

Candlestick Reversal and Trend Signals [AlgoAlpha]🚀 Unleash your charting capabilities with the Candlestick Reversal and Trend Signals indicator by AlgoAlpha, your go-to tool for spotting pivotal market movements! This script enhances your trading experience by identifying key candlestick patterns and trend changes, perfect for traders aiming for precision in their technical analysis.
🛠 Key Features:
- 🔄 Multi-Timeframe Analysis : Leverages a timeframe multiplier to analyze levels on higher timeframes, enhancing the depth and applicability of insights.
- 🧩 Diverse Pattern Detection : Capable of detecting a wide array of patterns including Bull/Bear Engulfings, Dojis, Haramis, Piercing Lines, Dark Cloud Covers, and Morning/Evening Stars, each contributing to a robust trading strategy.
- 🔍 Dynamic Trend Filters : Utilizes three exponential moving averages (EMAs) and volume filters to decisively confirm trend directions and strength, providing a clearer picture of market dynamics.
- ⚙️ Customizable Settings : Features adjustable settings for filter period, signal thresholds, and appearance, allowing for a tailored analysis experience to fit individual trading styles.
- 📉 Swing Levels Identification : Marks significant high and low swing points on the chart, highlighting potential pivot points and trend reversals for strategic trading decisions.
📈 Quick Guide to Using the Candlestick Reversal and Trend Signals Indicator
1. 🛠 Add the Indicator : Add the indicator to your favorites. Adjust the settings to match your analysis needs.
2. 📊 Analysis : Keep an eye out for the specific symbols plotted on your chart that indicate various candlestick patterns. Use these signals to enhance your market analysis.
3. 🔔 Set Alerts : Enable alerts for the patterns you are most interested in to get notified of potential trading opportunities without needing to monitor the charts constantly.
Embark on your enhanced trading journey with this powerful tool! 🚀✨ Happy trading!
🧐 How It Works:
The Candlestick Reversal and Trend Signals indicator operates by integrating several candlestick patterns and trend analysis features to assist in making informed trading decisions. Initially, it gathers user-defined settings like the period for filtering, signal thresholds, and the desired patterns to detect. It analyzes candlestick formations such as Bull/Bear Engulfings, Dojis, Haramis, and more, by comparing the current candlestick's attributes (such as body length and direction) with previous data to identify potential market reversals or confirmations. The indicator enhances its accuracy through additional filters like volume ratios and exponential moving averages (EMAs) that help validate the strength and direction of trends. By marking these patterns and trends visually on the chart, it provides clear signals that aid traders in identifying significant market movements efficiently. The script is then complemented with the 3 EMA indicator for trend detection and swing levels for added confluence.

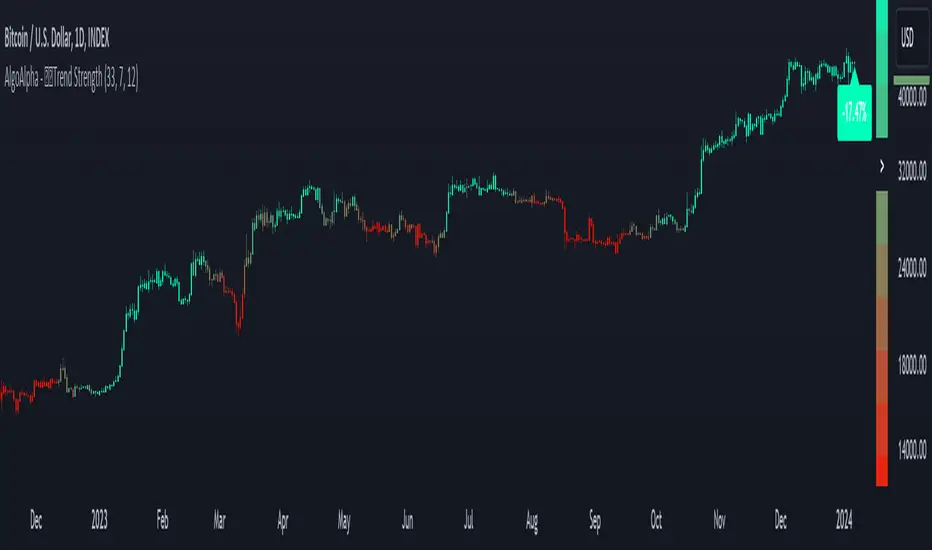
Candlestick Trend Strength [AlgoAlpha]🚀🎉 Introducing the Candlestick Trend Strength by AlgoAlpha, a dynamic TradingView indicator designed to visually communicate the strength and direction of market trends right on your charts! 🕯️💪
Key Features:
🌈 Visual gauge for trend strength, color-coded for intuitive insights.
⏳ Customizable trend detection and normalization periods to match your trading strategy.
🎨 Flexible color settings for both uptrend (green) and downtrend (red).
🔔 Real-time alerts for trend reversals, helping you stay ahead of market moves.
How to Use:
🛠 Add the Indicator: Add the indicator to favorites and customize it to suit your needs.
🔍 Analyze the Trends: Monitor the color changes in the gauge and bar color to identify strengthening or weakening trends.
🔔 Set Alerts: Configure alerts to notify you of trend changes, allowing you to react swiftly to trading opportunities without constant monitoring.
Basic Logic Explained:
The "Candlestick Trend Strength" indicator calculates the trend strength score by analyzing the ratio of the candle's wick to its body, alongside the direction of the candle (up or down). It uses a normalization period to adjust the sum of the trend score into a scale from -1 to 1, which is then plotted as a color gradient gauge from red (downtrend) to green (uptrend) on the chart. This representation helps traders quickly assess whether a trend is gaining or losing strength, and it updates in real-time with each new bar, providing a highly responsive tool for technical analysis.
Embrace the power of visual trend analysis with the "Candlestick Trend Strength" by AlgoAlpha and transform your trading experience today! 🌟📈
Bullish Candlestick Patterns With Filters [TradeDots]The "Bullish Candlestick Patterns With Filters" is a trading indicator that identifies 6 core bullish candlestick patterns. This is further enhanced by applying channel indicator as filters, designed to further increase the accuracy of the recognized patterns.
6 CANDLESTICK PATTERNS
Hammer
Inverted Hammer
Bullish Engulfing
The Piercing Line
The Morning Star
The 3 White Soldiers
SIGNAL FILTERING
The indicator incorporates with 2 primary methodologies aimed at filtering out lower accuracy signals.
Firstly, it comes with a "Lowest period" parameter that examines whether the trough of the bullish candlestick configuration signifies the lowest point within a specified retrospective bar length. The longer the period, the higher the probability that the price will rebound.
Secondly, the channel indicators, the Keltner Channels or Bollinger Bands. This indicator examines whether the lowest point of the bullish candlestick pattern breaches the lower band, indicating an oversold signal. Users have the flexibility to modify the length and band multiplier, enabling them to custom-tune signal sensitivity.
Without Filtering:
With Filtering
RISK DISCLAIMER
Trading entails substantial risk, and most day traders incur losses. All content, tools, scripts, articles, and education provided by TradeDots serve purely informational and educational purposes. Past performances are not definitive predictors of future results.

Morning & Evening Star [TradingFinder] Stock Indices Gap Candle🔵 Introduction
In "technical analysis", there are certain reversal patterns that alert us to a potential reversal of a stock's previous trajectory.
Two significant patterns in this regard are the "Morning Star" pattern and the "Evening Star" pattern, which are formed by a combination of three different candlesticks and are considered as reversal patterns.
Here, we will examine how to identify these patterns and how to respond to them.
🟣 Morning Star Pattern
This pattern forms at the end of a downtrend and indicates the beginning of an uptrend.
The pattern consists of three candlesticks in the following order :
1.A large bearish candlestick
2.A candlestick with a short body
3.A bullish candlestick
With the formation of the morning star pattern, it is expected that the stock price will change direction and continue to rise. Therefore, in such situations, it is advisable to enter a long position and follow the uptrend.
Signs of the morning star pattern :
•The first sign of this pattern is the presence of a small-bodied candlestick at the end of the trend, accompanied by a gap from the previous candlestick (a bearish candlestick with a large body). Therefore, the bodies of the first and second candlesticks do not overlap.
•The second candlestick indicates market confusion and uncertainty. The color of the middle candlestick is not significant.
•The third candlestick must be positive and have a higher price than the previous candlestick (i.e., the small-bodied candlestick).
•The closing price of the third candlestick must be higher than half of the first candlestick.
🟣 Evening Star Pattern
This pattern forms at the end of an uptrend and indicates the beginning of a downtrend.
The pattern consists of three candlesticks in the following order :
1.A large bullish candlestick
2.A candlestick with a short body
3.A bearish candlestick
With the formation of the evening star pattern, it is expected that the stock price will change direction and continue to fall. Therefore, in such situations where this pattern is identified, it is advisable to refrain from entering a long position.
If the stock is traded in a two-way market, it is possible to profit by taking a short position after the formation of the evening star pattern.
Signs of the evening star pattern :
•The first sign of this pattern is the presence of a small-bodied candlestick at the end of the trend, accompanied by a gap from the previous candlestick (a bullish candlestick with a large body). Therefore, the bodies of the first and second candlesticks do not overlap.
•The second candlestick indicates market confusion and uncertainty. The color of the middle candlestick is not significant.
•The third candlestick must be negative and have a lower price than the previous candlestick (i.e., the small-bodied candlestick).
•The closing price of the third candlestick must be lower than half of the first candlestick.
🔵 How to Use
The "Filter" and "Market" features are available in the settings section, allowing you to customize the output of the indicator according to your needs.
With the "Filter" feature, you can filter the "Morning Star" and "Evening Star" patterns as "strong" or "weak." The difference between strong and weak patterns lies in their "Candle Body."
In strong patterns, the candle bodies account for more than 80% of the total candle range, while in weak patterns, the bodies comprise between 60% to 80% of the candle range.
If the "Filter" feature is set to "On," only strong patterns will be displayed. If it's set to "Off," all patterns will be displayed. By default, it's set to "Off."
The "Market" feature allows you to include "gaps" in your pattern identification calculations. You can choose between "Forex" and "Stock" modes. In the Forex pattern, calculations are performed without considering gaps since there are fewer gaps in the Forex market.
If gap calculations were to be part of the pattern identification conditions, only a very small number of patterns would be identified. However, in the "Stock" mode, gaps are considered as part of the identification conditions.
