Commodity Channel IndexThe Commodity Channel Index (CCI) is a technical indicator that measures the strength of the momentum in the market, it is calculated using a Moving average (default 20 SMA, users can change the legth and the type of the MA from dashboard) using formula: cci = (src - ma) / (0.015 * ta.dev(src, ccilength)).
When CCI is under -100 that indicates a strong downtrend, and above +100 level a strong uptrend, above 0 level a bullish trend start and bellow 0 level bearish momentum.
Crossing back above -100 and bellow + 100 levels not means it is a reversal of the trend, could be just a pullback or a bounce before trend continuation.
The indicator display on the main chart a color coded moving average with the length and type selected by users for CCI calculation.
The CCI Moving average and the CCI lines in oscillator are both color coded :
1. CCI and MA both red = > Bearish trend
2. CCI and MA both green = > Bullish trend
3. MA color turn yellow or the CCI turn blue that means a possible consolidation will be next or trend change.
4 type of Divergences are detected by the script Bullish, Bearish, Hidden Bullish and Hidden bearish divergences, users can setup alarms for them, by default the divergences ae not displayed, users need to select them to be displayed on the oscillator.
A table displaying the vurrent timeframe and 2 higher timeframes of the stats of CCI and its MA.
There are 13 alerts that users can setup akarms:
Alert for Regular Bullish Divergence
Alert for Hidden Bullish Divergence
Alert for Regular Bearish Divergence
Alert for Hidden Bearish Divergence
Alert for CCI Back Above -100
Alert for CCI Back Bellow 100
Alert for CCI Extreme Overbought
Alert for CCI Extreme Oversold
Alert for trend change by CCI MA => Moving Average Color turned to yellow, that means sideways or possible trend change
Alert for CCI Crossing Above CCI MA
Alert for CCI Crossing Bellow CCI MA
Alert for cci Crossing Above 0
Alert for CCI Crossing Bellow 0
Ccidivergence
CCI [Hash Adaptive]Adaptive CCI Pro: Professional Technical Analysis Indicator
The Commodity Channel Index is a momentum oscillator developed by Donald Lambert in 1980. CCI measures the relationship between an asset's price and its statistical average, identifying cyclical turns and overbought/oversold conditions. The indicator oscillates around zero, with values above +100 indicating overbought conditions and values below -100 suggesting oversold conditions.
Standard CCI Formula: (Typical Price - Moving Average) / (0.015 × Mean Deviation)
This indicator transforms the traditional CCI into a sophisticated visual analysis tool through several key enhancements:
Implements dual exponential moving average smoothing to eliminate market noise
Preserves signal integrity while reducing false signals
Adaptive smoothing responds to market volatility conditions
Dynamic Color Visualization System
Continuous gradient transitions from red (bearish momentum) to green (bullish momentum)
Real-time color intensity reflects momentum strength
Eliminates discrete color jumps for fluid visual interpretation
Adaptive Intelligence Features
Dynamic overbought/oversold thresholds adapt to market conditions
Reduces false signals during high volatility periods
Maintains sensitivity during low volatility environments
Momentum Vector Analysis
Incorporates velocity calculations for early trend identification
Crossover detection with momentum confirmation
Advanced signal filtering reduces market noise
Extreme Level Analysis
Values above +100: Strong overbought conditions, potential reversal zones
Values below -100: Strong oversold conditions, potential buying opportunities
Zero-line crossovers: Momentum shift confirmation
Optimization Parameters
CCI Period (Default: 14)
Shorter periods (10-12): Increased sensitivity, more signals
Standard periods (14-20): Balanced responsiveness and reliability
Longer periods (21-30): Reduced noise, stronger signal confirmation
Smoothing Factor (Default: 5)
Lower values (1-3): Maximum responsiveness, suitable for scalping
Medium values (4-6): Balanced approach for swing trading
Higher values (7-10): Institutional-grade smoothness for position trading
Signal Sensitivity (Default: 6)
Conservative (7-10): High-probability signals, reduced frequency
Balanced (5-6): Optimal risk-reward ratio
Aggressive (1-4): Maximum signal generation, requires additional confirmation
Strategic Implementation
Oversold reversals in red zones with momentum confirmation
Zero-line breaks with sustained color transitions
Extreme readings followed by momentum divergence
Risk Management
Use extreme levels (+100/-100) for position sizing decisions
Monitor color intensity for momentum strength assessment
Combine with price action analysis for comprehensive market view
Market Context Application
Trending markets: Focus on momentum direction and extreme readings
Range-bound markets: Utilize overbought/oversold levels for mean reversion
Volatile markets: Increase smoothing parameters and signal sensitivity
Professional Advantages
Instantaneous momentum assessment through color visualization
Reduced cognitive load compared to traditional oscillators
Professional presentation suitable for client reporting
Adaptive Technology
Self-adjusting parameters reduce manual optimization requirements
Consistent performance across varying market conditions
Advanced mathematics eliminate common CCI limitations
The Adaptive CCI Pro represents the evolution of momentum analysis, combining Lambert's foundational CCI concept with modern computational techniques to deliver institutional-grade market intelligence through an intuitive visual interface.

CCI Divergence Detector
A technical analysis tool that identifies divergences between price action and the Commodity Channel Index (CCI) oscillator. Unlike standard divergence indicators, this system employs advanced gradient visualization, multi-layer wave effects, and comprehensive customization options to provide traders with crystal-clear divergence signals and market momentum insights.
Core Detection Mechanism
CCI-Based Analysis: The indicator utilizes the Commodity Channel Index as its primary oscillator, calculated from user-configurable source data (default: HLC3) with adjustable length parameters. The CCI provides reliable momentum readings that effectively highlight price-momentum divergences.
Dynamic Pivot Detection: The system employs adaptive pivot detection with three sensitivity levels (High/Normal/Low) to identify significant highs and lows in both price and CCI values. This dynamic approach ensures optimal divergence detection across different market conditions and timeframes.
Dual Divergence Analysis:
Regular Bullish Divergences: Detected when price makes lower lows while CCI makes higher lows, indicating potential upward reversal
Regular Bearish Divergences: Identified when price makes higher highs while CCI makes lower highs, signaling potential downward reversal
Strength Classification System: Each detected divergence is automatically classified into three strength categories (Weak/Moderate/Strong) based on:
-Price differential magnitude
-CCI differential magnitude
-Time duration between pivot points
-User-configurable strength multiplier
Advanced Visual System
Multi-Layer Wave Effects: The indicator features a revolutionary wave visualization system that creates depth through multiple gradient layers around the CCI line. The wave width dynamically adjusts based on ATR volatility, providing intuitive visual feedback about market conditions.
Professional Color Gradient System: Nine independent color inputs control every visual aspect:
Bullish Colors (Light/Medium/Dark): Control oversold areas, wave effects, and strong bullish signals
Bearish Colors (Light/Medium/Dark): Manage overbought zones, wave fills, and strong bearish signals
Neutral Colors (Light/Medium/Dark): Handle table elements, zero line, and transitional states
Intelligent Color Mapping: Colors automatically adapt based on CCI values:
Overbought territory (>100): Bearish color gradients with increasing intensity
Neutral positive (0 to 100): Blend from neutral to bearish tones
Oversold territory (<-100): Bullish color gradients with increasing intensity
Neutral negative (-100 to 0): Transition from neutral to bullish tones
Key Features & Components
Advanced Configuration System: Eight organized input groups provide granular control:
General Settings: System enable, pivot length, confidence thresholds
Oscillator Selection: CCI parameters, overbought/oversold levels, normalization options
Detection Parameters: Divergence types, minimum strength requirements
Sensitivity Tuning: Pivot sensitivity, divergence threshold, confirmation bars
Visual System: Line thickness, labels, backgrounds, table display
Wave Effects: Dynamic width, volatility response, layer count, glow effects
Transparency Controls: Independent transparency for all visual elements
Smoothing & Filtering: CCI smoothing types, noise filtering, wave smoothing
Professional Alert System: Comprehensive alert functionality with dynamic messages including:
-Divergence type and strength classification
-Current CCI value and confidence percentage
-Customizable alert frequency and conditions
Enhanced Information Table: Real-time display showing:
-Current CCI length and value
-Market status (Overbought/Normal/Oversold)
-Active sensitivity setting
Configurable table positioning (4 corner options)
Visual Elements Explained
Primary CCI Line: Main oscillator plot with gradient coloring that reflects market momentum and CCI intensity. Line thickness is user-configurable (1-8 pixels).
Wave Effect Layers: Multi-layer gradient fills creating a dynamic wave around the
CCI line:
-Outer layers provide broad market context
-Inner layers highlight immediate momentum
-Core layers show precise CCI movement
-All layers respond to volatility and momentum changes
Divergence Lines & Labels:
-Solid lines connecting divergence pivot points
-Color-coded based on divergence type and strength
-Labels displaying divergence type and strength classification
-Customizable transparency and size options
Reference Lines:
-Zero line with neutral color coding
-Overbought level (default: 100) with bearish coloring
-Oversold level (default: -100) with bullish coloring
Background Gradient: Optional background coloring that reflects CCI intensity and market conditions with user-controlled transparency (80-99%).
Configuration Options
Sensitivity Controls:
Pivot sensitivity: High/Normal/Low detection levels
Divergence threshold: 0.1-2.0 sensitivity range
Confirmation bars: 1-5 bar confirmation requirement
Strength multiplier: 0.1-3.0 calculation adjustment
Visual Customization:
Line transparency: 0-90% for main elements
Wave transparency: 0-95% for fill effects
Background transparency: 80-99% for subtle background
Label transparency: 0-50% for text elements
Glow transparency: 50-95% for glow effects
Advanced Processing:
Five smoothing types: None/SMA/EMA/RMA/WMA
Noise filtering with adjustable threshold (0.1-10.0)
CCI normalization for enhanced gradient scaling
Dynamic wave width with ATR-based volatility response
Interpretation Guidelines
Divergence Signals:
Strong divergences: High-confidence reversal signals requiring immediate attention
Moderate divergences: Reliable signals suitable for most trading strategies
Weak divergences: Early warning signals best combined with additional confirmation
Wave Intensity: Wave width and color intensity provide real-time volatility and momentum feedback. Wider, more intense waves indicate higher market volatility and stronger momentum.
Color Transitions: Smooth color transitions between bullish, neutral, and bearish states help identify market regime changes and momentum shifts.
CCI Levels: Traditional overbought (>100) and oversold (<-100) levels remain relevant, but the gradient system provides more nuanced momentum reading between these extremes.
Technical Specifications
Compatible Timeframes: All timeframes supported
Maximum Labels: 500 (for divergence marking)
Maximum Lines: 500 (for divergence drawing)
Pine Script Version: v5 (latest optimization)
Overlay Mode: False (separate pane indicator)
Usage Recommendations
This indicator works best when:
-Combined with price action analysis and support/resistance levels
-Used across multiple timeframes for confirmation
-Integrated with proper risk management protocols
-Applied in trending markets for divergence-based reversal signals
-Utilized with other technical indicators for comprehensive analysis
Risk Disclaimer: Trading involves substantial risk of loss. This indicator is provided for analytical purposes only and does not constitute financial advice. Divergence signals, while powerful, are not guaranteed to predict future price movements. Past performance is not indicative of future results. Always use proper risk management and never trade with capital you cannot afford to lose.

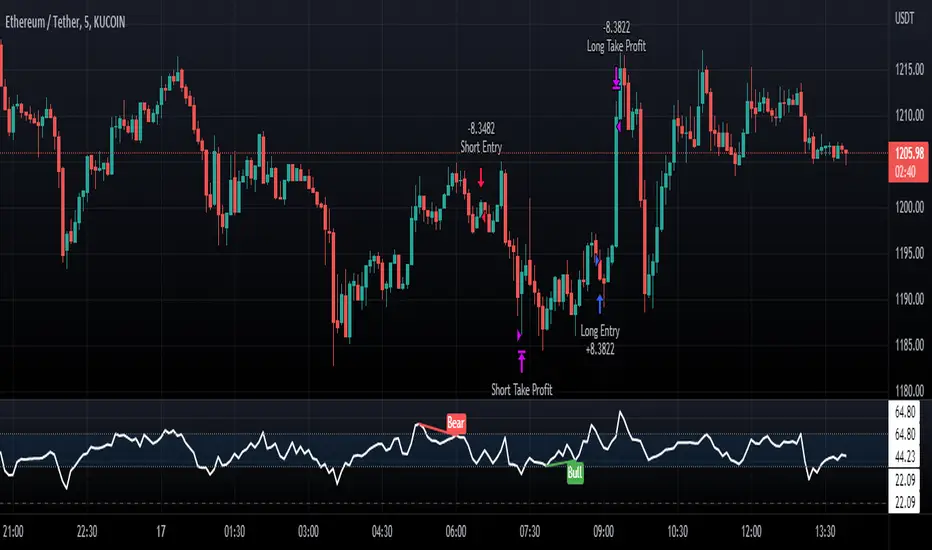
OnePunch Algo Scalper V6Overview:
OnePunch Algo Scalper V6 is an invite-only script designed for short-term trend scalping and extreme reversal detection. It uniquely combines classic momentum and volume indicators, enhanced with multi-time session awareness, to deliver precise high-probability entry alerts.
Core Concepts:
RSI and CCI are used together to identify momentum exhaustion points for early reversal spotting.
CMF is integrated to filter buy signals only when volume flow confirms bullish intent, avoiding weak uptrends.
SMA overlays track medium to long-term trends to confirm direction bias for safer scalping entries.
MACD Histogram weakness detection adds a momentum weakening filter to confirm whether bullish/bearish pressure is losing strength — improving risk-reward setups.
Stochastic crossovers help predict short-term pullbacks, allowing for precision "Prepare for CALL/PUT" signals.
Session-based background coloring indicates high-probability trading windows (Morning, Midday, Afternoon), guiding users to focus on optimal times.
Signals Generated:
✅ "Trending Up": Momentum acceleration uptrend signal (RSI + CCI crossover with volume confirmation).
✅ "Trending Down": Momentum deceleration sell signal.
✅ "Reversal Up" / "Bearish Down": Extreme oversold/overbought reversals.
✅ "Prepare for PUTs/CALLs": Anticipation signals based on stochastic weakening + MACD histogram convergence.
Chart Setup:
The script draws clean shape labels on the chart for each event (e.g., "Up Trend", "Bearish") for clarity.
Background highlights show different sessions to help traders recognize the most liquid periods.
No other indicators are required on the chart.
Usage Notes:
This script is ideal for scalping or short intraday swing trades on liquid assets like indices, crypto, or forex.
Best results when combined with manual Support/Resistance marking (use "Prepare for PUTs/CALLs" near S/R zones).

HTC peppermint_07 CCI w signal + s&r RSI
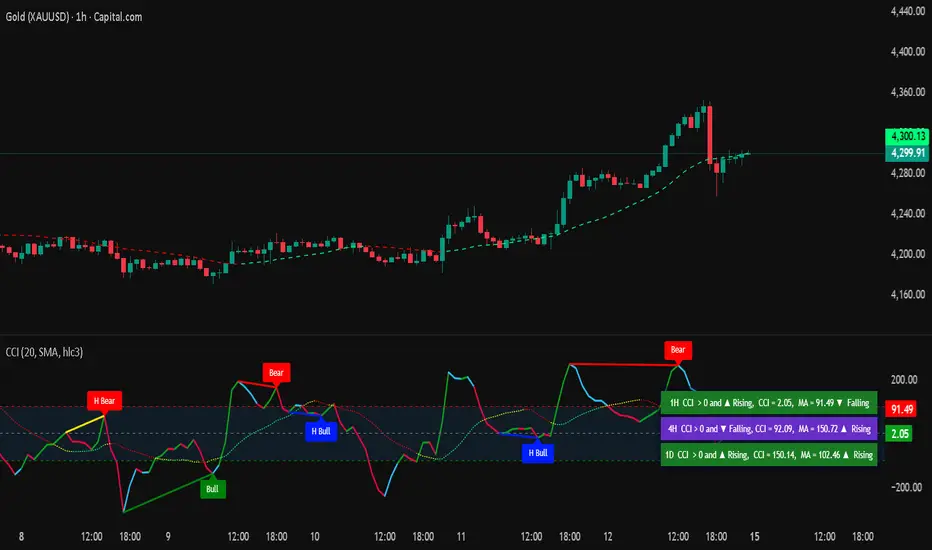
This CCI version enhances the traditional Commodity Channel Index (CCI) by integrating a dynamically calculated Relative Strength Index (RSI) that acts as support and resistance as shown in the screenshot, it can add as a confirmation to the divergence found in the CCI.
Key Features:
Enhanced CCI: The primary plot (black line but customizable) represents the standard CCI, providing insight into price momentum and potential overbought/oversold conditions.
Dynamic RSI Support/Resistance: The upper and lower bands (medium cyan line) are derived from a smoothed RSI, dynamically adjusting to the current market volatility. These bands serve as potential support and resistance levels for the CCI as additional confirmation for the divergence.
Overbought/Oversold Zones: The traditional overbought (+100) and oversold (-100) levels for CCI are marked with horizontal dotted lines.
Benefits:
Improved Entry/Exit Signals: Combining CCI with dynamic RSI support/resistance may offer more precise trading signals compared to using CCI alone.
Dynamic Adaptation: The RSI-based bands adapt to changing market conditions, potentially providing more relevant support and resistance levels.
Divergence Confirmation: dynamic s&r RSI adds confluence to potential trend reversals identified by the CCI.
Potential Usage:
Traders might use this indicator to:
Identify potential overbought/oversold conditions using the CCI and its relationship to the dynamic RSI bands.
Look for breakouts beyond the dynamic support/resistance levels as potential entry points.
Confirm potential trend reversals using RSI divergence (cyan and red label above divergence) signals.
Further Development Considerations:
Customizable Parameters: Allowing users to adjust the CCI length, RSI periods, and smoothing factors would enhance flexibility.
Alert Conditions: Adding alerts for breakouts, overbought/oversold conditions, and divergence signals would improve usability.
Backtesting: Thoroughly backtesting the indicator's performance across different assets and timeframes is essential before using it for live trading.
DISCLAIMER: !!
indicator is a custom technical analysis tool designed for educational and informational purposes only. It should not be construed as financial advice or a recommendation to buy or sell any security. Trading involves substantial risk of loss and may not be suitable for all investors.
Key Points to Consider:
No Guarantee of Profitability: The indicator's past performance is not indicative of future results. No trading strategy can guarantee profits or eliminate the risk of losses. You could lose some or all of your investment.
Use at Your Own Risk: Use of this indicator is solely at your own discretion and risk. You are responsible for your trading decisions. The developers and distributors of this indicator are not liable for any losses incurred as a result of using it.
Not Financial Advice: This indicator does not provide financial advice. Consult with a qualified financial advisor before making any investment decisions.
Backtesting Limitations: Backtested results, if presented, should be viewed with caution. Past performance may not reflect future results due to various factors, including changing market conditions and the limitations of backtesting methodologies.
Indicator Limitations: Technical indicators, including this one, are not perfect. They can generate false signals, and their effectiveness can vary depending on market conditions and the specific parameters used.
Parameter Optimization: Optimizing indicator parameters for past performance can lead to overfitting, which may not translate to future profitability.
No Warranty: The indicator is provided "as is" without any warranty of any kind, either express or implied, including but not limited to warranties of merchantability, fitness for a particular purpose, or non-infringement.
Changes and Updates: The developers may make changes or updates to the indicator without notice.
By using the "HTC peppermint_07 CCI w signal + s&r RSI" indicator, you acknowledge and agree to the terms of this disclaimer. If you do not agree with these terms, do not use the indicator.

Divergence Scaner 3D Dynamic_tHello MY friend
divergence scanner 3D dynamic
It is a dynamic 3D scanner for identifying positive and negative divergences in 10 indicators.
This indicator can identify the types of Regular_Hidden_Exaggerated divergences for bullish and bearish states in the following indicators.
(MACD_L, MACD_H, RSI, Stochastic, Volume, CCI, MFI, Momentum, OBV, ADX)
This indicator is able to identify the mentioned divergences in the desired price source and in the desired settings for each indicator.
This can be done in up to 3 scans with different sensitivities at the same time. Therefore, the chances of identifying different price points are increased.
Also, the price point for each scan is determined and drawn separately.
This is a dynamic indicator.
That is, the divergence is not misdiagnosed at any moment, and it expresses the presence or absence of divergence for each indicator, and at the first moment of divergence in each sweep, it informs the user of its existence. And if the divergence disappears at the first instant, the label text is corrected.
That is why we say it is dynamic.
This indicator can calculate and identify the divergence with the percentage of allowed deviation both in the price and in the indicator if the user needs.
This indicator has an alert function to inform about the formation of divergence in one scan with desired settings for all divergence modes and for all 10 indicators.
This indicator can label the last 5 divergences for positive and negative divergences and for all three scans. Also display the Fibonacci level for the last divergence.
According to your needs, you can activate only a number of scans that you want or activate only a number of indicators that you want.
The logic of calculation and identification of divergence in the indicator:
As you know, divergences are more valid if they occur between two consecutive peaks and valleys.
In this indicator, three scans are considered, and the user can identify tiny and small pivots according to his needs and strategy by entering different degrees of sensitivity for each scan.
The indicator identifies the desired divergences for 2 consecutive valleys and 2 consecutive peaks in each scan separately and displays them to the user.
Important note:
This indicator is not limited to identifying the indicator points only in line with the price points, that is, the price points and the indicator may not be in the same line.
The higher the sensitivity of your scan, the smaller waves will be detected, and the lower the selection number, the larger waves will be detected.
By enabling pints you can see detected pivots and also by enabling Fibonacci you can see the value of the Fibonacci number for the last detected divergence.
You can see the deviations with the allowed deviation rate if needed and You can also get midpoint error and midline error.(More details are given in the clip.)
This indicator can be customized according to your needs and will identify the divergences of your choice for active scans.
For better display in label printing, the indicator tries to print the output of all active scans in one label, provided that the label printing location is the same.
Note that divergence label printing is done only with the lowest and highest price.
However, drawing the divergence line and printing the point labels depends on the price source you select in each scan.
You can see the scan number written in front of the marker name on the printed label to identify which scan this divergence is for.
Also, before the name of the indicator, an abbreviation related to the type of divergence is also written so that you can understand the type of divergence. For example, H stands for HD divergence.
It is better to consider a color for each scan so that it remains easily in your mind and you can easily recognize the points of each scan.
It is better to adjust the detection sensitivity in scans so that small and large spots are detected simultaneously to increase the performance of the marker.
last word :
Due to the capability of three simultaneous scans as well as dynamics at any moment, we think that the error in detecting the divergence in this indicator is below 1% and also the error in finding the divergence is below 3%. Also, the chances of identifying different price points are increased.
This can be said. It is a very good implementation. You can experience it in back test and forward test.
I tried to show you the full explanation with details in the form of a few clips. You can refer to my YouTube channel for a better introduction of the indicator and to know how to set the settings correctly.
Be careful to experience better execution speed ,Run the indicator when the market is open.
thank you

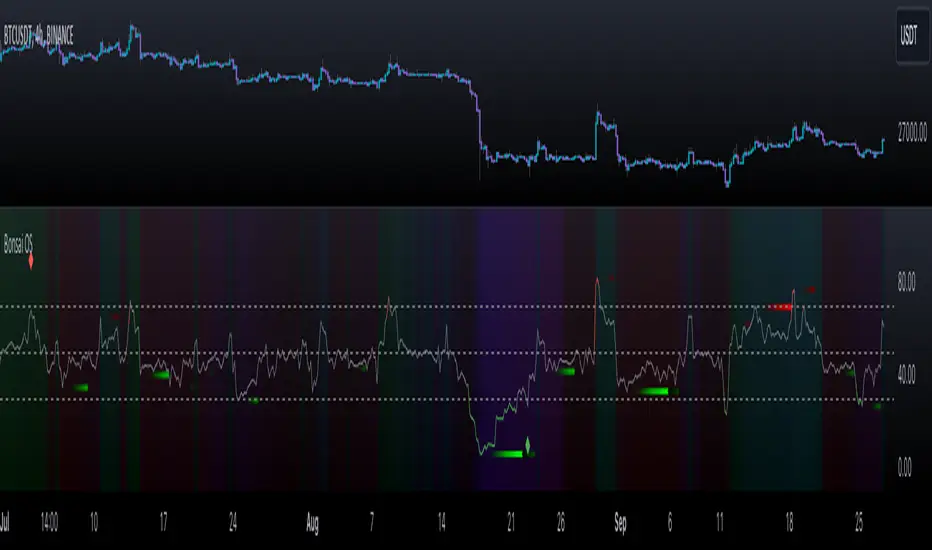
Bonsai OS (Oscillators)Bonsai OS combines four oscillators (RSI, CCI, Stochastic, MACD) in one interface. Features divergence detection, color-intensity, and insights into divergences. Assists traders in spotting potential pivot points.
═════════════════════════════════════════════════════════════════════════
🌳 Bonsai OS 🌳 Advanced Oscillator Suite
📘 Overview
Bonsai OS is a tool tailored for traders focusing on reversal strategies and those keen on identifying market divergences. Combining multiple oscillators into one unified interface, it aids traders in pinpointing potential pivot reversal points.
📌 Algorithm Logic
• Multi-Oscillator Integration: Bonsai OS calculates and integrates the values from four standard oscillators: RSI, CCI, Stochastic, and MACD. Each oscillator's value is derived from its respective mathematical formula, analyzing historical data points.
• Divergence Detection: The tool runs a series of comparisons between price action and oscillator values. When discrepancies (divergences) are observed, they are highlighted, suggesting potential market reversals.
• Price Strength Visualization: A gradient background that is determined by an average of the oscillator values in relation to their historical norms, thereby providing a visual cue about the current price strength, whether it is strong or weak.
• Alerts: Users can set up notifications based on specific divergence insights. Once set criteria are met, alerts are triggered.
🎯 Purpose
• For Professionals: Bonsai OS offers integrated oscillator readings, allowing a more in-depth market analysis.
• For Beginners: Simplified readings and visual cues make it easier for newcomers to understand oscillator indicators and market conditions.
🛠 Distinctive Elements
• Oscillator Fusion: Bonsai OS goes beyond just grouping oscillators. It looks for matching divergences across them, aiming to find stronger signals for market reversals.
• Divergence Indicators: Bonsai OS identifies divergence patterns between price trends and oscillator readings, highlighting their intensity with color variations.
• Insight into Failed Divergences: Recognizing not all divergences lead to reversals, Bonsai OS provides markers for potential false signals, helping traders exercise caution and fine-tune their strategies.
Getting Bullish/Bearish and Divergences
📊 Features
• Data Source Customization: Users have the flexibility to choose between default data inputs or adjust to their preferred price points (like High & Low).
• Combined Divergence Signals: Beyond individual oscillator divergences, Bonsai OS identifies instances when several oscillators indicate divergence at the same time.
• Adaptable Outputs: Outputs like 'Bullish Divergence ▲', 'Getting Bullish ▲', 'Getting Bearish ▼' and 'Bearish Divergence ▼' are plotted as non-displayable 1 or 0 for seamless integration into other custom indicators, ensuring a harmonious integration.
Here's an example of a custom indicator that can be used for inputting data from external sources:
//@version=5
indicator("My Script Template", overlay = true)
group_name = "External Source"
external = input.source(title = "Source", defval = close, inline = "external", group = group_name)
val = input.int(title = ">", defval = 0, inline = "external", group = group_name)
// Your logic follows here...
Bonsai OS as External Source
🎛 How To Use Bonsai OS
1. Select the desired oscillator.
2. Monitor the color changes for market condition insights.
3. Look out for divergence markers to anticipate potential market shifts.
4. If required, set up alerts for real-time updates.
Indicator Settings Menu
📜 Feedback & Continual Development
We welcome your feedback. It's essential for the continuous improvement of Bonsai OS and to better serve the TradingView community.
❗️ Disclaimer
Trading involves risks. Bonsai OS aims to provide an analytical tool to support traders, but it's essential to complement its insights with other research. Always seek advice from financial professionals and trade responsibly.
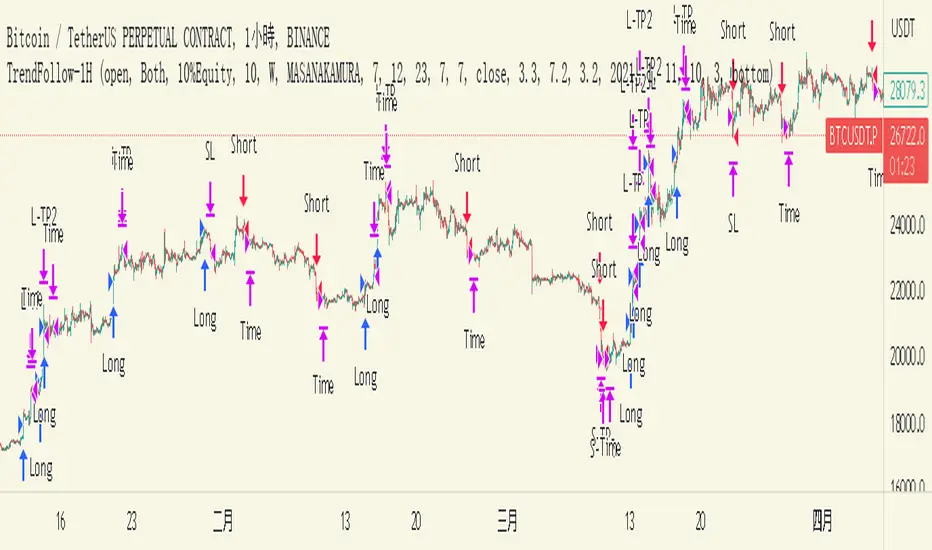
TrendFollow-1HThis is a trading strategy specially used on btcusdtperp in binance 1H chart
The most important part of this strategy is to use Support and Resistance with trading volume
Auxiliary indicators are include Directional Movement Index, trading volume, Commodity Channel Index,volume-weighted average price,Range Filter
Why is it not applicable to other trading varieties or exchanges?
Because the activity of each trading target is different from the trading volume, this strategy is very focused on the change of trading volume, so it may not be applicable to every trading variety
The idea of this strategy is to chase when the trend in the market is clear
Determine whether to break support or resistance to identify trends
But the market is full of false breakouts
Therefore, trading volume is an important indicator for judging the true and false.
Therefore, when the price breaks through support or resistance, accompanied by a huge trading volume, and forms a resonance with auxiliary indicators, the strategy will follow the trend, a time stop loss is also set. After entering the market, if there is no immediate profit to the stop profit, you will leave the market first.
But the market is always random, so the profit and loss ratio must be taken into account
Use a fixed stop loss space in exchange for a larger profit space, and ensure that the expected value is positive to make stable profits in the market
Therefore, this strategy uses 3.2% stop loss, 3.3% Take profit1 and 7.2% take profit2
About 1.5:1 profit and loss ratio to ensure positive expected value
Because the market has a clear trend only about 10% of the time
So the trading frequency of this strategy is very low
According to the backtest of up to 2021-01-01 till now , it takes about 5 days to make a transaction
User can choose their own leverage to obtain higher returns. But be sure to prioritize risk.
In order to prevent you from using this strategy without knowing it, the trading date of this strategy is only executed until the release date, and positions will not be opened and closed for subsequent markets.
You can contact me if you want to know more about this strategy
這是專門用於幣安1H圖表中btcusdtperp的交易策略
本策略最重要的部分是將支撐和阻力與交易量一起使用
輔助指標包括ADX,成交量,CCI,VWAP,Range Filter等
為什麼不適用於其他交易品種或交易所?
由於每個交易標的的活躍度與交易量不同,本策略非常注重交易量的變化,因此不一定適用於每個交易品種
這個策略的方法是在趨勢明朗的時候進行趨勢跟隨
確定是否打破支撐或阻力以識別趨勢
但市場充滿假突破
因此,成交量是判斷真假的重要指標。
當價格突破支撐位或阻力位,伴隨著巨大的成交量,並與輔助指標形成共振時,策略會順勢而為,同時設置時間止損。進場後,如果沒有立即獲利到止盈,就離場。
但市場總是隨機的,所以必須考慮盈虧比
用固定的止損空間換取更大的盈利空間,保證預期值為正,才能在市場中穩定獲利
因此,該策略使用 3.2% 止損、3.3% 止盈1 和 7.2% 止盈2
約1.5:1盈虧比,確保正期望值
因為市場只有大約 10% 的時間有明顯的趨勢
所以這個策略的交易頻率很低
根據2021-01-01至今的回測,交易頻率大約5天一次
用戶也可以選擇適合自己的槓桿以獲得更高的收益。但一定要優先考慮風險。
為防止您在不知情的情況下使用本策略,本策略的運行交易的日期僅至2023-05-30止,後續日期將不開倉和平倉。
如果您想了解更多有關此策略的信息,可以聯繫我。
Normalized CCI Divergence StrategyStrategy Overview:
This script takes the Commodity Channel Index and normalizes the equation to be read easier by the user. Bullish, Bearish, Hidden Bullish, and Hidden Bearish divergences are identified and displayed in the underlay. Hidden Bullish and Hidden Bearish are turned off by default, but can be turned on in the user settings. The strategy itself signals long or short based on the appearance of these divergences in addition to previous CCI values being above or below a threshold. *Shorter timeframes such as 5M are recommended.* Take profit, stop loss, and trailing percentages are also included, found at the bottom of the Input tab under “TT and TTP” as well as “Stop Loss”. Make sure to understand the TP/SL ratio that you desire before use, as the desired hit rate/profitability percentage will be affected accordingly. This strategy does NOT guarantee future returns. Apply caution in trading regardless of discretionary or algorithmic. Understand the concepts of risk/reward and the intricacies of each strategy choice before utilizing them in your personal trading.
Profitview Settings
If you wish to utilize Profitview’s automation system, find the included “Profitview Settings” under the Input tab of the strategy settings menu. If not, skip this section entirely as it can be left blank. Options will be “OPEN LONG TITLE”, “OPEN SHORT TITLE”, “CLOSE LONG TITLE”, and “CLOSE SHORT TITLE”. If you wished to trade SOL, for example, you would put “SOL LONG”, “SOL SHORT”, “SOL CLOSE LONG”, and “SOL CLOSE SHORT” in these areas. Within your Profitview extension, ensure that your Alerts all match these titles. To set an alert for use with Profitview, go to the “Alerts” tab in TradingView, then create an alert. Make sure that your desired asset and timeframe are currently displayed on your screen when creating the alert. Under the “Condition” option of the alert, select the strategy, then select the expiration time. If using TradingView Premium, this can be open-ended. Otherwise, select your desired expiration time and date. This can be updated whenever desired to ensure the strategy does not expire. Under “Alert actions”, nothing necessarily needs to be selected unless so desired. Leave the “Alert name” option empty. For the “Message”, delete the generated message and replace it with {{strategy.order.alert_message}} and nothing else.
Fisherized CCIIntroduction
This here is a non-repainting indicator where I use inverse Fisher transformation and smoothing on the well-known CCI (Commdity Channel Index) momentum indicator.
"The Inverse Fisher Transform" describes the calculation and use of the inverse Fisher transform by Dr . Ehlers in 2004. The transform is applied to any indicator with a known probability distribution function. It enables to transform an indicator signal into the range between +1 and -1. This can help to eliminate the noise of an indicator.
The CCI is an momentum indicator which describes the distance of the price to the average price.
For smoothing I used the Hann Window and NET (Noise Elimination Technique) methods.
Additional Features
Divergence Analysis
Trend-adaptive Histogram
Timeframe selection
Usage
It is usually used to spot potential trend reverals or mean-reversion (against the trend) trades on lower timeframes. IMO it can be even used to spot trend-following trades. It always depends on which settings you have, which timeframe do you use and which indicators you combine with it.
The suggested timeframe for this indicator is 15 min (with the length setting on 50).
The histogram with adaptive mode enabled could be used as filter applied on the buy and sell signals.
The divergence analysis can help to spot additional entries/exits or confirm the buy and sell signals.
Always try to find the best settings! This indicators has a lot of customization options you should take advantage of.
Signals
The indicator uses the following logic to generate the buy and sell signals:
Normal
Buy -> When CCI and MA go above the top band (usually +100) and cross
Sell -> When CCI and MA go below the the bottom band (usually -100) and cross
Fisherized
Buy -> When CCI and MA go above the the zero line and cross
Sell -> When CCI and MA go below the the zero line and cross
Have fun with the indicator! I am open for feedback and questions. :)

Strength of Divergence Across Multiple IndicatorsOverview:
One-stop shop for all your divergence needs, including:
(1) A single metric for divergence strength across multiple indicators.
(2) Labels that make it easy to spot where the truly strong divergence is by showing the overall divergence strength value along with the number of divergent indicators. Hovering over the label shows a breakdown of each divergent indicator and its individual divergence strength value.
(3) Fully customizable, including inputs for pivot lengths, divergence types, and weights for every component of the divergence strength calculation. This allows you to quickly and easily optimize the output for any chart. Don't worry, the default settings will have you covered if you're not interested in what's going on under the hood.
The Divergence Strength Calculation:
The total divergence strength value is the sum of the divergence strengths of all indicators for which divergence was detected at a given bar. Each indicator's individual divergence strength is comprised of two basic components: (1) |ΔPrice| - the magnitude of the change in price over the divergence period (pivot-to-pivot), and (2) |ΔIndicator| - the magnitude of the change in indicator value over the divergence period.
Because different indicators' scales and volatility can vary greatly, the Δ values are expressed in terms of standard deviation to ensure that the values are meaningful and equitable across all indicators and assets/instruments/currency pairs, etc:
|ΔIndicator| = |indicator_value_1 - indicator_value_2| / 2 * StDev(indicator_series,100)
Calculation Weights:
All components of the calculation are weighted and can be modified on the Inputs page in settings (weights are simply multipliers). For example, if you think hidden divergence should carry less weight than regular divergence, you can assign it a lesser weight. Or if you think RSI divergence is worth more than OBV divergence, you can adjust their weights accordingly. List of weights:
Regular divergence weight - default = 1
Hidden divergence weight - default = 1
ΔPrice weight - default = 0.5 (multiplied by the ΔPrice component)
ΔIndicator weight - default = 1.5 (multiplied by the ΔIndicator component)
RSI weight - default = 1.1
OBV weight - default = 0.8
MACD weight - default = 0.9
STOCH weight - default = 0.9
Development for additional indicators is ongoing, as is research into the optimal weight configuration(s).
Other Inputs:
Pivot lengths - specify the number of bars before and after each pivot high/low to consider it a valid candidate for divergence.
Lookback bars and Lookback pivots - specify the number of bars or the number of pivots to look back across.
Price sources - specify separate price sources for bullish and bearish divergence
Display settings - specify how lines and labels should display, including which divergence strength values should show the largest labels. Include/exclude specific divergence types and indicators.
Please report any bugs, or let me know if you have any enhancement suggestions or requests for additional indicators.
@reees

resistances and divergence[zavaUnni]
Select from selectable settings: rsi, cci, mfi, or stochstic
The default indicator is set to cci.
When you select an indicator in Settings, you can see the diversity that occurs in that indicator.
Resistance fills the histogram in yellow; the stronger the resistance, the higher the saturation.
If the volume is large but the change rate of candlestic(spred_rate) is not large, it means resistance has occurred.
It is a method of finding anomalies in the spred_rate and volume relationship.
After obtaining the accumulated spred_raterelative to the accumulatedvolume value,
we calculated that the larger the difference is, the larger the resistance value.
The formula with the resistanc
a_sma = ta.cum(spred_rate)/ta.cum(volume)
ifpricebull = open+(open*a_sma * volume)
ifpricebear = open-(open*a_sma * volume)
bullD = close>ifpricebull or closeifpricebull or close

Bogdan Ciocoiu - Code runnerDescription
The Code Runner is a hybrid indicator that leverages other pre-configured, integrated open-source algorithms to help traders spot regular and continuation divergences.
The Code Runner specialises in integrating some of the most popular oscillators well known for their accuracy when scalping using divergence strategies.
Uniqueness
The Code Runner stands out as a one-stop-shop pack of oscillator algorithms that traders can further customise to spot divergences.
The indicator's uniqueness stands from its capability to recast each algorithm to apply to the same scale. This feature is achieved by manually adjusting the outputs of each algorithm to fit on a scale between +100 and -100.
Another benefit of the Code Runner comes from its standardisation of outputs, mainly consisting of lines. Showing lines enables traders to draw potential regular and continuation divergences quickly.
The indicator has been pre-configured to support scalping at 1-5 minutes.
Open-source
The Code Runner uses the following open-source scripts and algorithms:
www.tradingview.com
www.tradingview.com
www.tradingview.com
www.tradingview.com
www.tradingview.com
www.tradingview.com
www.tradingview.com
www.tradingview.com
These algorithms are available in the public domain either in TradingView space or outside (given their popularity in the financial markets industry).

Bogdan Ciocoiu - MoonshotDescription
Moonshot is an indicator that encapsulates the value delivered by the TSI, MACD, Awesome Oscillator and CCI algorithms to produce signals to enable users to enter positions in ideal market conditions. Moonshot integrates the value delivered by the above four algorithms into one script.
This indicator is particularly useful when trading continuation/reversal divergence strategies.
Uniqueness
The Moonshot's uniqueness stands from integrating the above algorithms into the same visual area and leveraging preconfigured parameters suitable for 1-3 minute scalping techniques.
In addition, Moonshot allows swapping or furthermore configuring the above four algorithms in such a way to align signals by colour-coding or shape thickness to aid the users with identifying any emerging patterns quicker.
Furthermore, Moonshot's uniqueness is also reflected in the way it has standardised the outputs of each algorithm to look and feel the same (including the scale at which the shapes are shown) and, in doing so, enables users to plug them in/out as needed.
Open-source
The indicator leverages the following open-source scripts/algorithms:
www.tradingview.com
www.tradingview.com
www.tradingview.com
www.tradingview.com

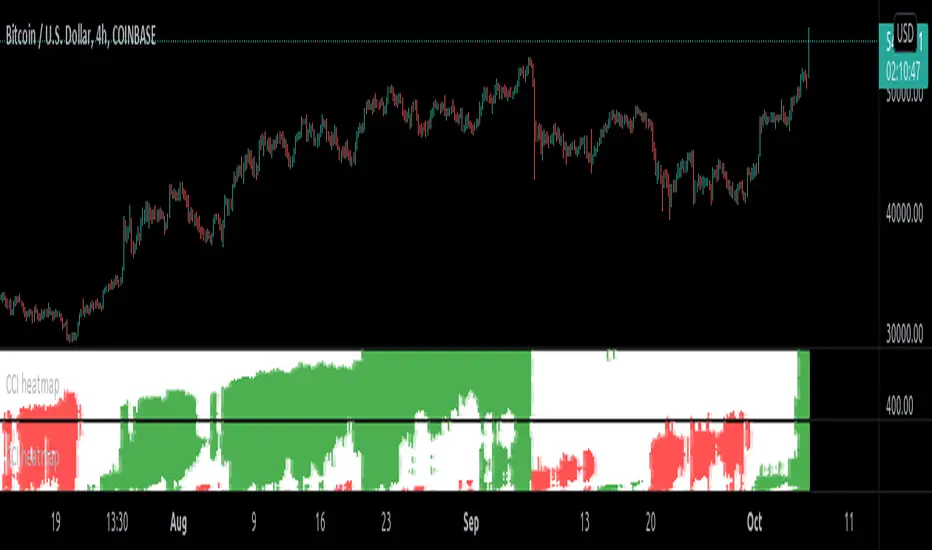
CCI heatmap(15-170)This is CCI (Commodity channel index) heatmap for the period lengths (15 to 170).
How to use :
1.) When overwhelming green appears, it means price is supposed to be trending up.
2.) When white appears, it means price is supposed to be neutral.
3.) When overwhelming red appears, it means price is supposed to be trending down.
Note: This indicator is supposed to be used with CCI heatmap(175-330) and CCI heatmap(335-490) aligned in increasing order of period lengths for higher resolution of period lengths. Otherwise use CCI heatmap(low resolution) indicator in which these 3 high resolution indicator is adjusted to a single indicator.
(Expect remaining indicator to be published to the public in mid of march 2021)
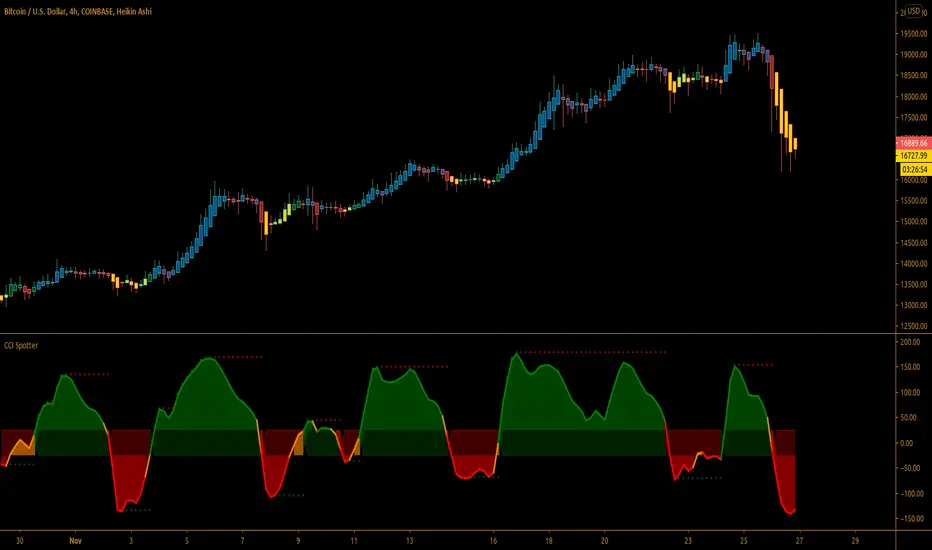
Simple CCI Spotter™TradeChartist Simple CCI Spotter is an elegant version of the classic CCI indicator and helps spot price trends using visually engaging and appealing CCI plot and background. The Bull and the Bear background fills are highly useful for traders who like to visually understand areas of entry and exit based on CCI .
===================================================================================================================
What does Simple CCI Spotter do?
Plots CCI with visually engaging colours for Bull and Bear zones (Green and Red) with optional background fill.
Plots CCI coloured bars on main chart based on user preferred Upper and Lower CCI bands (Default - 25/-25).
Plots CCI based on EMA smoothing (1 for Regular CCI without smoothing).
Plots Heikin Ashi CCI if enabled from indicator settings.
Plots CCI highs of Bull Zone and RSI lows of Bear Zone. Helps visually spot divergences.
===================================================================================================================
Note:
Default Settings:
5 period EMA Smoothed CCI .
For Heikin Ashi CCI on normal bars, enable ᴜsᴇ ʜᴇɪᴋɪɴ ᴀsʜɪ ᴄᴄɪ and change EMA CCI sᴍᴏᴏᴛʜɪɴɢ to 1.
===================================================================================================================
[NLX-L2] Oscillator Divergences MTF- Oscillator Divergences -
This indicator give you signals on various oscillator divergences (Regular/Hidden Bull/Bear) you can choose from:
CCI
Donchian
Fisher Transform
MACD
MFI
Momentum
OBV
QQE
RSI
RSX
TSI
- How to Use -
1. Add a Trend Indicator like Trend Index MTF to your chart
2. Add this Oscillator Divergences Indicator to your Chart and select the Trend Index MTF with Type L1 in the Settings as Signal Source
3. Add the Backtest Module to your Chart and select the Signal with Type L2 as Source
The Hurst Exponent Signal Filter can be used as well to filter some of the noise (release coming soon)!
- Alerts for Automated Trading -
See my signature below. Contact me for the Alert module.

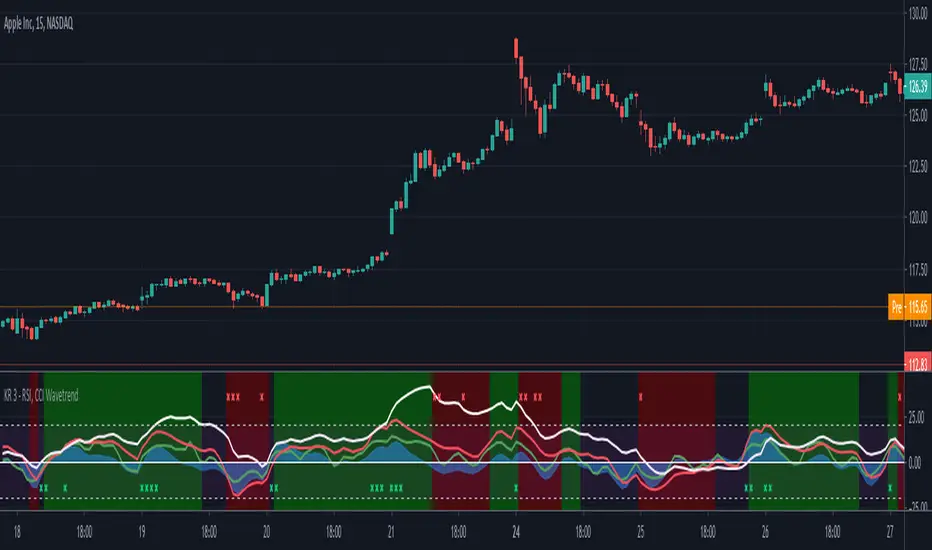
RSI, CCI WaveTrend God by Keiron RichieThis script uses Relative Strength Index ( RSI ), Commodity Channel Index ( CCI ) and WaveTrend (WT) together as an oscillator with an additional custom RSI rate of change indicator and buy/sell background color zones derived from a complex combination of these indicators.
The White line shows the moving average of RSI as an oscillator
The Green line is the fast Exponential Moving Average ( EMA ) of CCI & the Red line is the slow EMA of CCI .
The Blue area is the EMA of WaveTrend WT
How to read:
If the RSI , CCI or WT crosses above a programmed threshold and the other lines are also within a pre-defined buy range then the background will change to green for buy.
If the RSI , CCI or WT crosses below a programmed threshold and the other lines are also within a pre-defined sell range then the background will change to red for sell.
Where requirements are not met, the background is neither green nor red.
There are also red and green indicator x’s at the top/bottom of the indicator. They show a drastic change in Relative strength within a short period. This often indicates an immediate buy or sell opportunity.
Buy, Sell, Exit Buy and Exit Sell alerts are included.
Use the link below to obtain access to this indicator.
[CryptoWho] Multi DivergencesThis script looks for divergences on up to six indicators, sums them up and draw a histogram below the chart.
You have several options to customize the output:
1. indicators: RSI, Stoch RSI, MACD, CCI, OBV, WaveTrend (LazyBear)
2. Divergences: Regular, hidden, both
3. Lookback period for divergences
BITSTAMP:BTCUSD

CCI Divergence PointerThis script points regular and optionally hidden types of bullish and bearish CCI divergences on the chart by drawing the divergence lines and optionally labels.
Hidden divergence is disabled by default, it can be enabled over settings window.
Regular divergence is enabled by default, it can be disabled over settings window.
There is an option to display the price channel additionally.
Added alerts for all types of divergences.

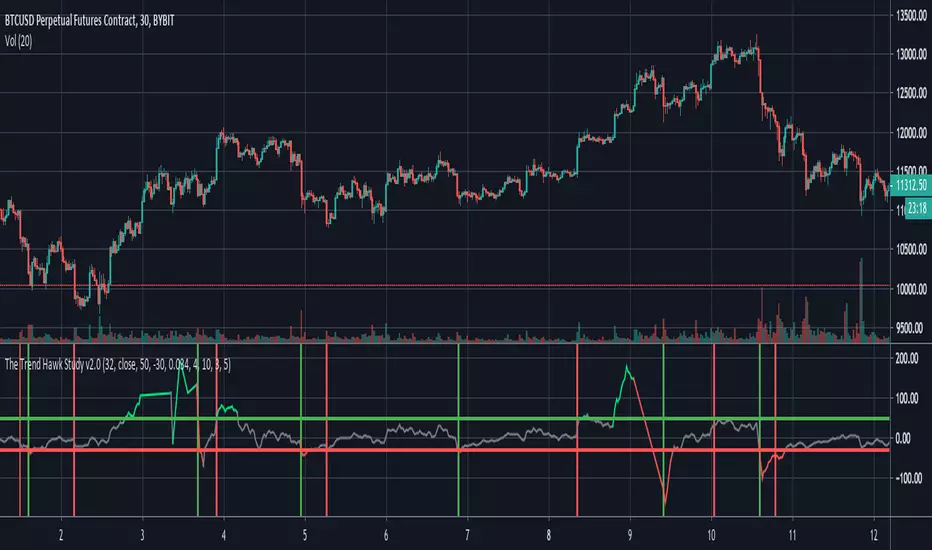
The Trend Hawk Study v2.0Study Version of the TrendHawk Strategy based on Commodity Channel Index(CCI). Comes with built-in alerts and stop loss.