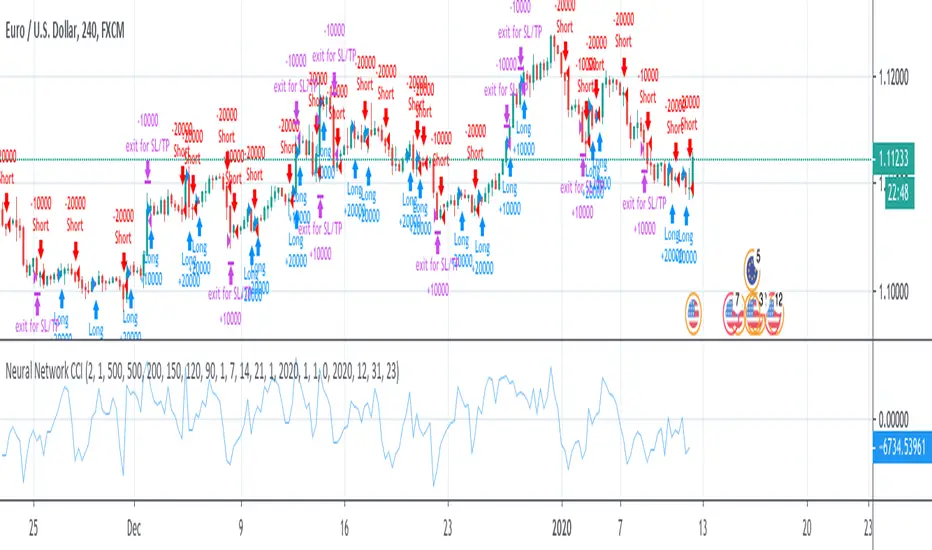
Neural Network CCI - RSIThis is a test of neural network with one layer.
Two layers will follow soon.
Signals are given by CCI or RSI.
Method 1 triggers a change of oscillator (buy if >0)
Method 2 triggers oscillator over 0 (for CCI only)
How to use:
1- launch the strategy on a chart,
2- open "Strategy Tester" tab
3- open startegy option panel
4- modify x11, x12, x13 and x14 to get the best results (net profit, profit factor, drawdown, etc...)
5- repeat once a week
Need help with self-optimization: I couldn't yet found a formula to optimize profit or win% or whatever changing values of x11, x12, x13 and x14 inside the strategy.
Oscillatori centrati
RSI-VWAPBacktest script based on the previous RSI-VWAP indicator:
It's the popular RSI indicator with VWAP as a source instead of close:
- RSI_VWAP = rsi(vwap(close), RSI_VWAP_length)
What is the Volume Weighted Average Price ( VWAP )?
VWAP is calculated by adding up the dollars traded for every transaction (price multiplied by the number of shares traded) and then dividing by the total shares traded.
Trades are laddered to improve the average entry price and each entry is increased, improving the entry but increasing the risk of being liquidated.
It can be easily converted to study (alerts)
Settings for BINANCE:BTCUSDT at 30m

RSI-VWAP INDICATORThis simple indicator provides great results.
It is the popular RSI indicator with VWAP as a source instead of close.
What is the Volume Weighted Average Price (VWAP)?
VWAP is calculated by adding up the dollars traded for every transaction (price multiplied by the number of shares traded) and then dividing by the total shares traded. That is, volume.
On the Backtest, trades are laddered to improve the average entrance price.

MACD 4H StrategyThis strategy is a basic example of using MACD AND the instrument must be found an appropriate timeframe (4H recommended) before being tested with.

Multi-Oscillator Divergence StrategyNote: This is a modified version of TradingView's built-in "Divergence Indicator" and applied in "Strategy" format to show back testing results
It finds bullish and bearish divergence in a selection of well known MA formulas: MACD, RSI, STOCH, DETRENDED PRICE OSCILLATOR, MOMENTUM.
I've found good results even on 1 minute charts!
In this example the chart backtest is utilizing the detrended price oscillator (DPO)
There are multiple variables, so the ability to find good back test can sometimes be "time consuming"
And please note that if you increase "Pivot LookBack Right" variable too high, then you will increase chance of repaint. Keep this variable as low as possible
I've also drawn my own solutions on the chart (red and green trend lines) to find good take profit and safe stop loss. In order to study this properly you need the own the chart. Scripts don't give you this option.
See private chart publication link to "own" the chart for yourself. Simply click on the "Share" button (it's the megaphone icon) and click on "Make it Mine"
I've found the best approach is to create 5 copies of indicator on 1 chart and have each running with different MA formula. This will give you a majority consensus type environment.
I will post study with alert conditions next
Good luck and enjoy!

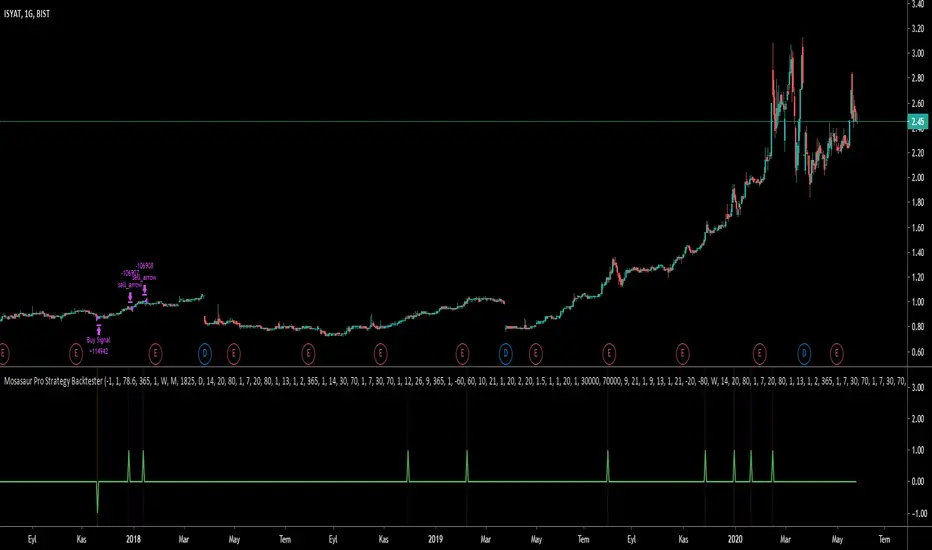
Mosasaur Pro BacktesterBacktester indicator for Mosasaur ◬ | Comprehensive & Profitable Trading Setup Builder available for free here.
Scroll all the way down in the setting menu to adjust the backtesting strategy.
Current features:
Find out the backtesting results for your customized strategy.
Set alerts for strong buy, buy, strong sell and sell signals.
Option for waiting fractal candle stick pattern before entering or exiting.
All features and setups used can be found on this tradingview page.
This backtester has settings of:
Setting 1 lets user select the source for putting a buy order.
Setting 2 lets user select the source for putting a sell order.
Setting 3 defines how much percent user wants to risk per trade to buy.
Setting 4 defines maximum possible trades for buying.
Setting 5 lets user only buy with fractal bottom after a buy signal has been found.
Setting 6 lets user only sell with fractal top after a sell signal has been found.
Setting 7 lets user only buy if the pre defined time period has elapsed on the chart.
Setting 8 lets user only sell if the pre defined time period has elapsed on the chart.
Setting 9 lets user only buy with a strong buy signal (orange color).
Setting 10 lets user only sell with a strong sell signal (purple color).
Setting 11 defines the time period to be elapsed to trigger a buy.
Setting 12 defines the time period to be elapsed to trigger a sell.
Upcoming features:
Advanced pre-defined strategies for user to select from. This will also auto adjust the setups and time frames being combined.
Stop Loss and Stop to Trailing options for the strategy.
Stop Loss and Stop to Trailing alerts.
Defining risk/reward ratio before entering the trade.
~Bo
Founder of Megalodon Indicators
Squeeze Momentum Strategy based on Indicator [LazyBear][Bitduke]I improved Squeeze Momentum Indicator by LazyBear (momentum filter, changed data source to ohlc4) and transformed it into a strategy, adding a risk management system + ability to customize time frames for backtest.
Shortly about Squeeze Momentum Indicator:
This is a derivative of John Carter's "TTM Squeeze" volatility indicator, as discussed in his book "Mastering the Trade" (chapter 11).
Backtested on XBTUSD, ETHUSD (Bitmex). As you may notice it shows good results on 1h - 4h timeframes on these timeframes among these pairs. Relatively low drawdown ~ 12% (to date).

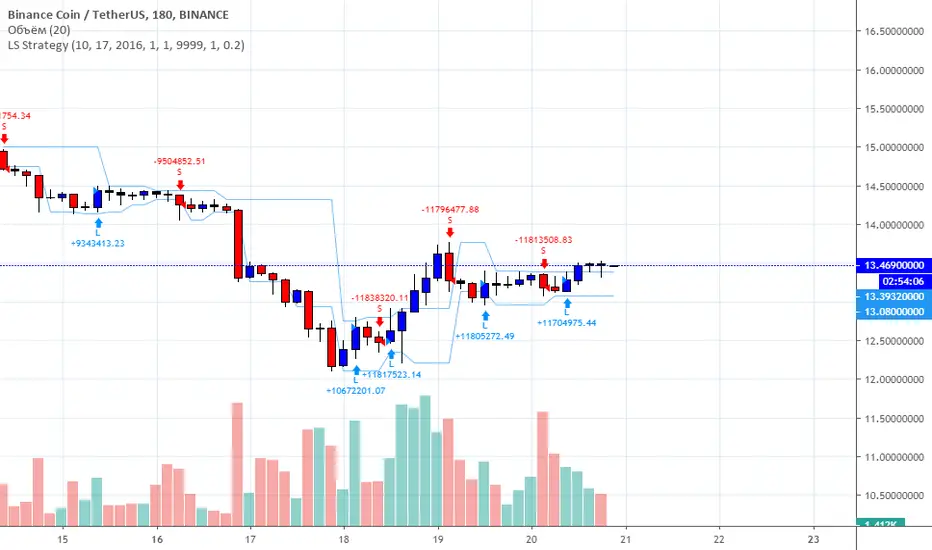
LS Strategy final version 1Hello. Strategy for timeframe 4 hours and up to 24 hours. for couples with a dollar. Good results for bnbusdt , btcusdt , ethusdt , eosusdt, ltcusdt , neousdt pairs. Suitable for exchange Binance, Bitmex.
Closing trades on the reverse signal.
first position 2019-01-17 19:00
Do not have code security
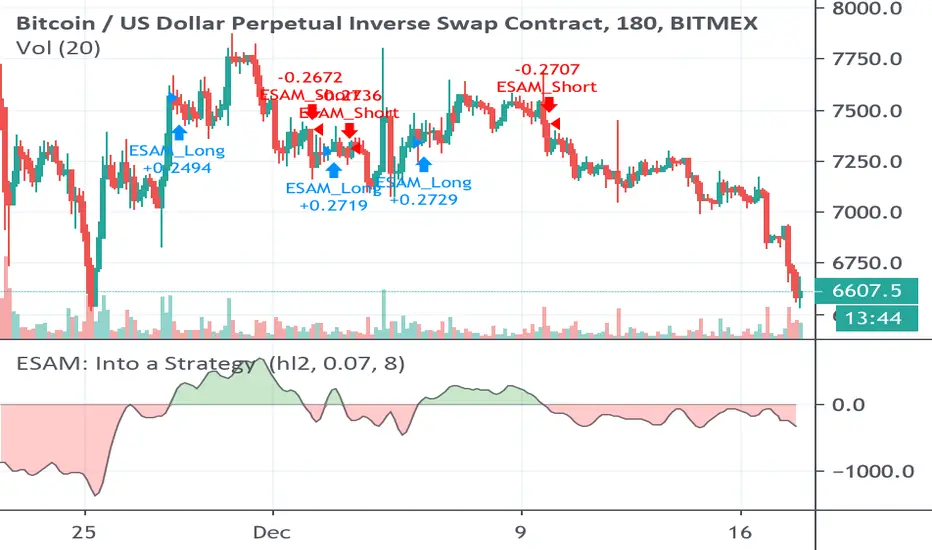
Strategy based on Ehlers Smoothed Adaptive Momentum [LazyBear]Strategy based on Ehlers Smoothed Adaptive Momentum (ESAM) indicator by LazyBear, slightly improved.
Indicator itself was developed and described by John F. Ehlers in his book "Cybernetic Analysis for Stocks and Futures" (2004, Chapter 12: Adapting to the Trend).
Backtesting: XBTUSD (Bitmex): 2h, 3h, 4h
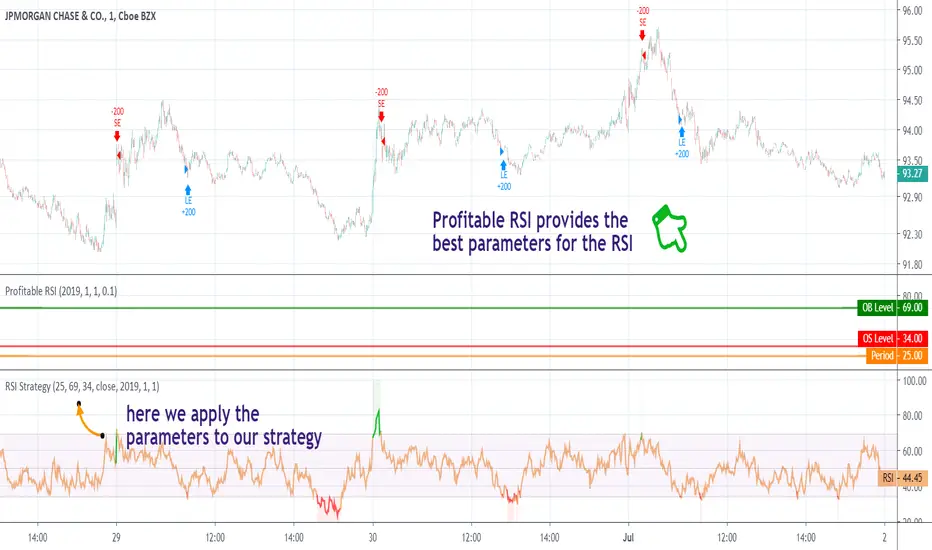
[STRATEGY] Jurik RSXA private strategy from the Profitable Jurik RSX preview for backtesting purposes.

Crypto Ingenius Breakout w AlertsThis is a breakout strategy designed for crypto currency markets with alerts for buy and sell entries as well as buy and sell exits. It is designed primarily to work on 1 hour and 4 hour charts. Message me for a free 7-day trial and for pricing
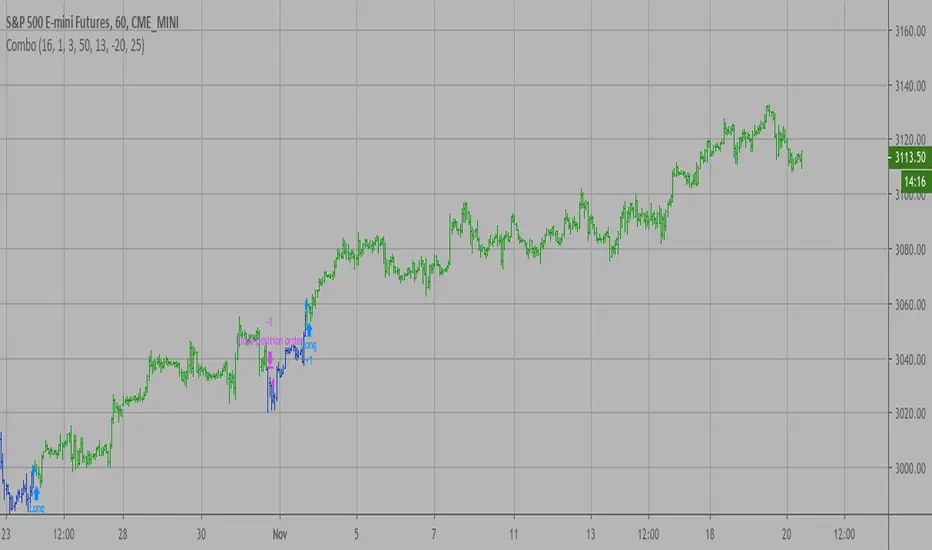
Combo Backtest 123 Reversal & D_Three Ten OscThis is combo strategies for get a cumulative signal.
First strategy
This System was created from the Book "How I Tripled My Money In The
Futures Market" by Ulf Jensen, Page 183. This is reverse type of strategies.
The strategy buys at market, if close price is higher than the previous close
during 2 days and the meaning of 9-days Stochastic Slow Oscillator is lower than 50.
The strategy sells at market, if close price is lower than the previous close price
during 2 days and the meaning of 9-days Stochastic Fast Oscillator is higher than 50.
Second strategy
TradeStation does not allow the user to make a Multi Data Chart with
a Tick Bar Chart and any other type a chart. This indicator allows the
user to plot a daily 3-10 Oscillator on a Tick Bar Chart or any intraday interval.
Walter Bressert's 3-10 Oscillator is a detrending oscillator derived
from subtracting a 10 day moving average from a 3 day moving average.
The second plot is an 16 day simple moving average of the 3-10 Oscillator.
The 16 period moving average is the slow line and the 3/10 oscillator is
the fast line.
For more information on the 3-10 Oscillator see Walter Bressert's book
"The Power of Oscillator/Cycle Combinations"
WARNING:
- For purpose educate only
- This script to change bars colors.

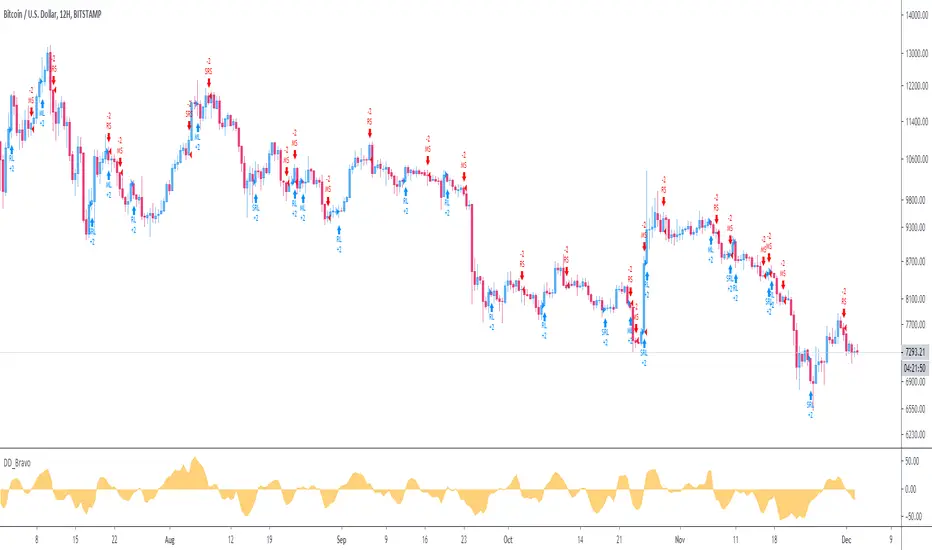
DD_Bravo_StrategyThe DD_Bravo_Strategy is a mean reversal strategy that captures oversold or overbought levels, and accordingly goes long or short. It is based on price difference between successive candles and normalization of this difference. It works best on 12H timeframe for BTCUSD.
DM me for details for access.
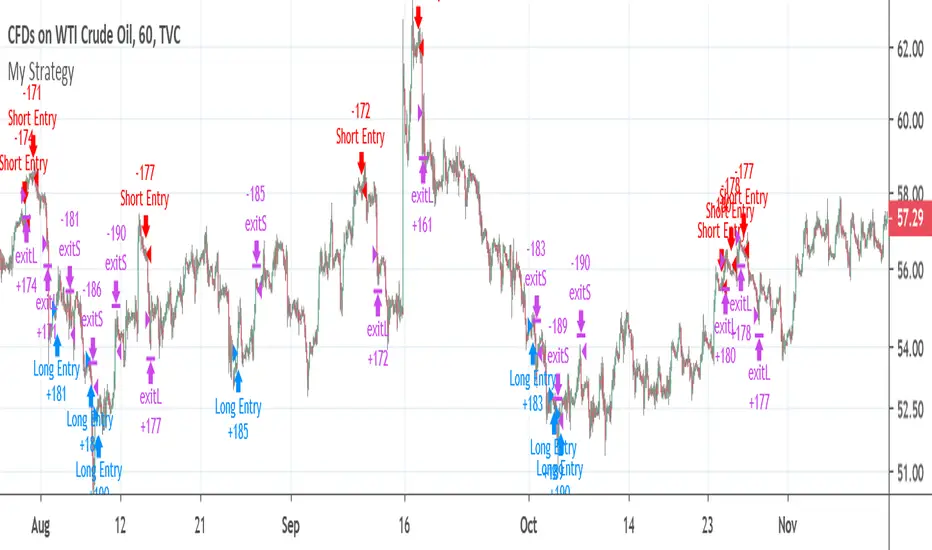
CCI strategy on OIL1HThis indicator is based on Commodity Channel Index.
It buys when CCI on period 200 is under -130 and it´s rising last 12 bars. It closes the position by hitting Take Profit, Stop Loss or opening short position.
It sells when CCI on period 200 is over 130 and it´s falling last 12 bars. It closes the position by hitting Take Profit, Stop Loss or opening short position.
This strategy seems to working just on USOIL on 1 hour chart. This can predict that it´s just luck and not proper strategy or indicator I would use for trading.
This script is just for educational purposes and that´s why the script is open. I will be happy if you will leave comment and try to come up with some ideas how to improve this strategy, so it can be used also on other commodities/forex pairs.
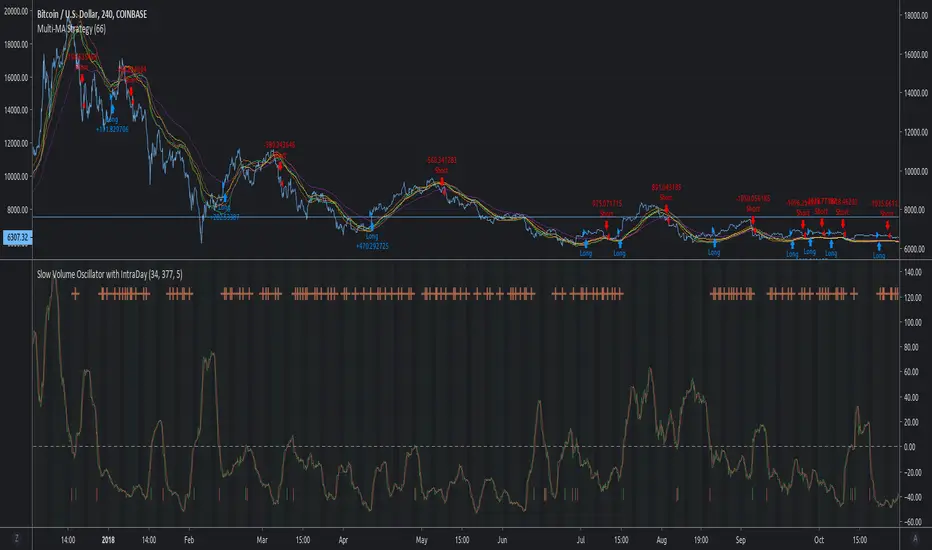
MACD Multi-MA StrategyThis script applies the average of each major MA (SMA, RMA, EMA, WVMA, WMA) to the MACD formula.
The logic is simple. When all 5 MA's are in agreement in direction, then then script will notify users of change.
I posted this as a strategy to help show how logic does in back test. If you use my simple yet effective solution to find take profit locations, you can blow this back testing out of the water!!!
To set alerts simply turn script into study
//@version=2
study(title="MACD Multi-MA Study", overlay=false)
src = close
len1 = input(8, "FAST LOOKBACK")
len2 = input(144, "SLOW LOOKBACK")
/////////////////////////////////////////////
length = len2-len1
ma = vwma(src, length)
plot(ma, title="VWMA", color=lime)
length1 = len2-len1
ma1 = rma(src, length1)
plot(ma1, title="RMA", color=purple)
length2 = len2-len1
ma2 = sma(src, length2)
plot(ma2, title="SMA", color=red)
length3 = len2-len1
ma3 = wma(src, length3)
plot(ma3, title="WMA", color=orange)
length4 = len2-len1
ma4 = ema(src, length4)
plot(ma4, title="EMA", color=yellow)
long = ma > ma and ma1 > ma1 and ma2 > ma2 and ma3 > ma3 and ma4 > ma4
short = ma < ma and ma1 < ma1 and ma2 < ma2 and ma3 < ma3 and ma4 < ma4
alertcondition(long == true, title='MACD LONG SIGNAL', message='MACD LONG!')
alertcondition(short == true, title='MACD SHORT SIGNAL', message='MACD SHORT!')
Pro CryptoSolver Strategy [Jwammo12]This is a pro strategy for trading crypto pairs. It trades both long and short and includes an adjustable stop loss.
Lowering the activity parameter increases the number of trades and is not bounded by zero.
Message me for a free 7-day trial and pricing for lifetime access.

Combo Backtest 123 Reversal & Detrended Synthetic Price V 2 This is combo strategies for get a cumulative signal.
First strategy
This System was created from the Book "How I Tripled My Money In The
Futures Market" by Ulf Jensen, Page 183. This is reverse type of strategies.
The strategy buys at market, if close price is higher than the previous close
during 2 days and the meaning of 9-days Stochastic Slow Oscillator is lower than 50.
The strategy sells at market, if close price is lower than the previous close price
during 2 days and the meaning of 9-days Stochastic Fast Oscillator is higher than 50.
Second strategy
Detrended Synthetic Price is a function that is in phase with the
dominant cycle of real price data. This DSP is computed by subtracting
a half-cycle exponential moving average (EMA) from the quarter cycle
exponential moving average.
See "MESA and Trading Market Cycles" by John Ehlers pages 64 - 70.
WARNING:
- For purpose educate only
- This script to change bars colors.
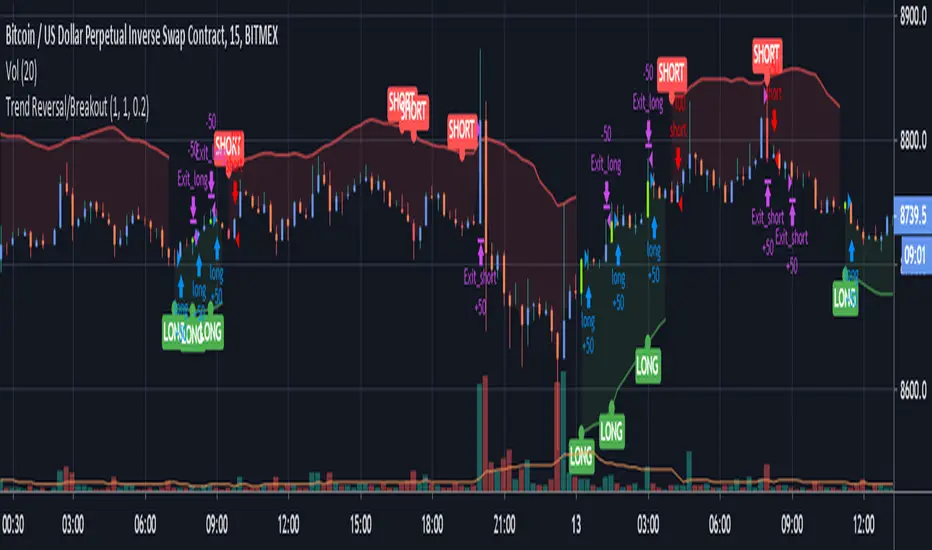
Trend Reversal/BreakoutThis is an strategy for trading low timeframes. It have better performance on 15min XBTUSD after parameter optimization.
It is generic and configurable meaning you can use it not only on XBT, but alos ETH, LTC etc.
Automatic trading can be achieved if used in conjunction with alert and webhook .
It does not repaint! Try it by yourself!!
MACD Indikator v1If you make a loss, I am not responsible for it. Please use this with caution.
==================================================================================================================================================
MACD - Strategy
Considering cross the lines and Top / Buttoms.
==================================================================================================================================================
Do realize that the indicator is not 100% accurate and please use this with caution. Please read the disclaimer below before using this indicator or the services (Telegram/ Twitter , Trading View etc.) services associated with this indicator:
Disclaimer:
No Investment Advice Provided
Any opinions, chats, messages, news, research, analyses, prices, or other information contained here are provided as general information for educational and entertainment purposes only and do not constitute investment advice. My bullshit statements should not be relied upon as a substitute for an extensive independent market research before making your actual trading decisions. Opinions, market data, recommendations or any other content is subject to change at any time without notice. I will not accept liability for any loss or damage, including without limitation any loss of profit, which may arise directly or indirectly from use of or reliance on such information.
I do not recommend the use of technical analysis or any analysis as a sole means of trading decisions. I do not recommend making hurried trading decisions. I have no clue about PAST PERFORMANCE or any INDICATIVE FUTURE RESULTS.
THE script and its associated services ARE PROVIDED "AS IS", WITHOUT WARRANTY OF ANY KIND, EXPRESS OR IMPLIED, INCLUDING BUT NOT LIMITED TO THE WARRANTIES OF MERCHANTABILITY, FITNESS FOR A PARTICULAR PURPOSE AND NONINFRINGEMENT. IN NO EVENT SHALL THE AUTHORS OR COPYRIGHT HOLDERS BE LIABLE FOR ANY CLAIM, DAMAGES OR OTHER LIABILITY, WHETHER IN AN ACTION OF CONTRACT, TORT OR OTHERWISE, ARISING FROM, OUT OF OR IN CONNECTION WITH THE SOFTWARE OR THE USE OR OTHER DEALINGS IN THE SOFTWARE, WEBSITE, SCRIPT, SIGNALS.

EVWMA VWAP MACD Strategy [QuantNomad]Based on comment of @coondawg71 I tried to compare VWAP and EVWMA.
Both are sort of moving averages so I decided to create a MACD based on these 2 indicators.
In parameters you can set EVWMA Length and 2 smoothing lengths for "macd" and "signal".
Strategy seems to work pretty good at 2h-8h timeframes for crypto.
What do you thing about it?

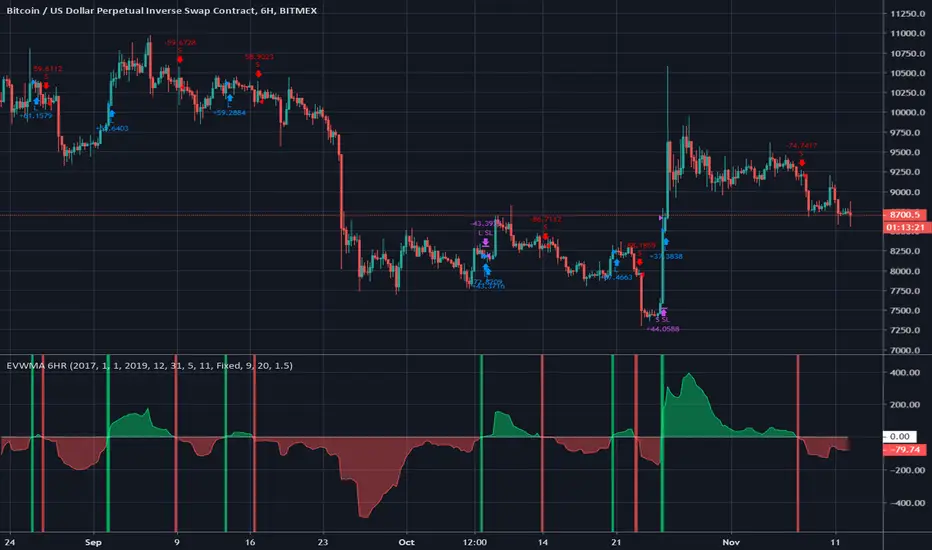
EVWMA 6HR BFCredit goes to QuantNomad for the idea behind this code. Here
is the original script.
This strategy simply goes long on a cross above zero of the calculated delta line and short on a cross down below zero.
The delta line is calculated using 2 volume based moving averages.
There is a fixed 9% stop loss but you can change this to an ATR Derived stop in the settings.
QuantNomad - EVWMA MACD StrategyPretty simple EVWMA (Elastic Volume Weighted Moving Average ) MACD Strategy.
EVWMA is a quite interesting moving average where the period of the MA is defined from the volume itself.
It incorporates volume information in a natural and logical way. The EVWMA can be looked at as an approximation to the average price paid per share.
As a volume period, you can use sum of the last x bars volumes.
Here are other EVWMA indicators/strategies:
EVWMA indicator:
EVWMA Cross strategy:
