AB=CD Fibonacci Strategy (One Trade at a Time)
AB=CD Fibonacci Strategy - Harmonic Pattern Trading Bot
Description
An automated trading strategy that identifies and trades the classic AB=CD harmonic pattern, one of the most reliable geometric price formations in technical analysis. This strategy detects perfectly proportioned Fibonacci retracement setups and executes trades with precise risk-reward management.
How It Works
The indicator scans for the AB=CD pattern structure:
Leg AB: Initial swing from pivot point A to pivot point B
Leg BC: Retracement to point C (customizable Fibonacci levels)
Leg CD: Mirror projection equal to the AB leg length
When price touches point D, the strategy automatically enters a position with predefined take-profit and stop-loss levels based on your risk-reward ratio.
Key Features
One Trade at a Time: Ensures disciplined position management by allowing only one active trade per pattern
Customizable Fibonacci Retracement: Set your preferred retracement range for point C (default 50% - 78.6%)
Risk-Reward Control: Adjust stop-loss and take-profit multiples to match your trading plan
Visual Pattern Display: Clear labeling of A, B, C, D points with pattern lines for easy identification
Both Directions: Identifies bullish and bearish AB=CD patterns automatically
Ideal For
Swing traders on higher timeframes (4H, Daily, Weekly)
Harmonic pattern traders seeking automation
Traders wanting precise entry and exit rules based on Fibonacci geometry
Those looking to reduce emotional trading and increase consistency
Default Settings Optimized For
NASDAQ futures and currency pairs
Medium timeframe analysis
Conservative risk management (10% position size per trade)
Pattern grafici

Ultra Reversion DCA Strategy with Manual Leverage - V.1Ultra Reversion DCA Strategy with Manual Leverage - V.1
2025-10-27

Trendshift [CHE] StrategyTrendshift Strategy — First-Shift Structural Regime Trading
Profitfactor 2,603
Summary
Trendshift Strategy implements a structural regime-shift trading model built around the earliest confirmed change in directional structure. It identifies major swing highs and lows, validates breakouts through optional ATR-based conviction, and reacts only to the first confirmed shift in each direction. After a regime reversal, the strategy constructs a premium and discount band between the breakout candle and the previous opposite swing. This band is used as contextual bias and may optionally inform stop placement and position sizing.
The strategy focuses on clear, interpretable structural events rather than continuous signal generation. By limiting entries to the first valid shift, it reduces false recycles and allows the structural state to stabilize before a new trade occurs. All signals operate on closed-bar logic, and the strategy avoids higher-timeframe calls to stabilize execution behavior.
Motivation: Why this design?
Many structure-based systems repeatedly trigger as price fluctuates around prior highs and lows. This often leads to multiple flips during volatile or choppy conditions. Trendshift Strategy addresses this problem by restricting execution to the first confirmed structural event in each direction. ATR-based filters help differentiate genuine structural breaks from noise, while the contextual band ensures that the breakout is meaningful in relation to recent volatility.
The design aims to represent a minimalistic structural trading framework focused on regime turns rather than continuous trend signaling. This reduces chart noise and clarifies where the market transitions from one regime to another.
What’s different vs. standard approaches?
Baseline reference
Typical swing-based structure indicators report every break above or below recent swing points.
Architecture differences
First-shift-only regime logic that blocks repeated signals until direction reverses
ATR-filtered validation to avoid weak or momentum-less breaks
Premium and discount bands derived from breakout structure
Optional band-driven stop placement
Optional band-dependent position-sizing factor
Regime timeout system to neutralize structure after extended inactivity
Persistent-state architecture to prevent re-triggering
Practical effect
Only the earliest actionable structure change is traded
Fewer but higher-quality signals
Premium/discount tint assists contextual evaluation
Stops and sizing can be aligned with structural context rather than arbitrary volatility measures
Improved chart interpretability due to reduced marker frequency
How it works (technical)
The algorithm evaluates symmetric swing points using a fixed bar window. When a swing forms, its value and bar index are stored as persistent state. A structural shift occurs when price closes beyond the most recent major swing on the opposite side. If ATR filtering is enabled, the breakout must exceed a volatility-scaled distance to prevent micro-breaks from firing.
Once a valid shift is confirmed, the regime is updated to bullish or bearish. The script records the breakout level, the opposite swing, and derives a band between them. This band is checked for minimum size relative to ATR to avoid unrealistic contexts.
The first shift in a new direction generates both the strategy entry and a visual marker. Additional shifts in the same direction are suppressed until a reversal occurs. If a timeout is enabled, the regime resets after a specified number of bars without structural change, optionally clearing the band.
Stop placement, if enabled, uses either the opposite or same band edge depending on configuration. Position size is computed from account percentage and may optionally scale with the price-span-to-ATR relationship.
Parameter Guide
Market Structure
Swing length (default 5): Controls swing sensitivity. Lower values increase responsiveness.
Use ATR filter (default true): Requires breakouts to show momentum relative to ATR. Reduces false shifts.
ATR length (default 14): Volatility estimation for breakout and band validation.
Break ATR multiplier (default 1.0): Required breakout strength relative to ATR.
Premium/Discount Framework
Enable framework (default true): Activates premium/discount evaluation.
Persist band on timeout (default true): Keeps structural band after timeout.
Min band ATR mult (default 0.5): Rejects narrow bands.
Regime timeout bars (default 500): Neutralizes regime after inactivity.
Invert colors (default false): Color scheme toggle.
Visuals
Show zone tint (default true): Background shade in premium or discount region.
Show shift markers (default true): Display first-shift markers.
Execution and Risk
Risk per trade percent (default 1.0): Determines position size as account percentage.
Use band for size (default false): Scales size relative to band width behavior.
Flat on opposite shift (default true): Forces reversal behavior.
Use stop at band (default false): Stop anchored to band edges.
Stop band side: Chooses which band edge is used for stop generation.
Reading & Interpretation
A green background indicates discount conditions within the structural band; red indicates premium conditions. A green triangle below price marks the first bullish structural shift after a bearish regime. A red triangle above price marks the first bearish structural shift after a bullish regime.
When stops are active, the opposite band edge typically defines the protective level. Band width relative to ATR indicates how significant a structural change is: wider bands imply stronger volatility structure, while narrow bands may be suppressed by the minimum-size filter.
Practical Workflows & Combinations
Trend following: Use first-shift entries as initial regime confirmation. Add higher-timeframe trend filters for additional context.
Swing trading: Combine with simple liquidity or fair-value-gap concepts to refine entries.
Bias mapping: Use higher timeframes for structural regime and lower timeframes for execution within the premium/discount context.
Exit management: When using stops, consider ATR-scaling or multi-stage profit targets. When not using stops, reversals become the primary exit.
Behavior, Constraints & Performance
The strategy uses only confirmed swings and closed-bar logic, avoiding intrabar repaint. Pivot-based swings inherently appear after the pivot window completes, which is standard behavior. No higher-timeframe calls are used, preventing HTF-related repaint issues.
Persistent variables track regime and structural levels, minimizing recomputation. The maximum bars back setting is five-thousand. The design avoids loops and arrays, keeping performance stable.
Known limitations include limited signal density during consolidations, delayed swing confirmation, and sensitivity to extreme gaps that stretch band logic. ATR filtering mitigates some of these effects but does not eliminate them entirely.
Sensible Defaults & Quick Tuning
Fewer but stronger entries: Increase swing length or ATR breakout multiplier.
More responsive entries: Reduce swing length to capture earlier shifts.
More active band behavior: Lower the minimum band ATR threshold.
Stricter stop logic: Use the opposite band edge for stop placement.
Volatile markets: Increase ATR length slightly to stabilize behavior.
What this indicator is—and isn’t
Trendshift Strategy is a structural-regime trading engine that evaluates major directional shifts. It is not a complete trading system and does not include take-profit logic or prediction features. It does not attempt to forecast future price movement and should be used alongside broader market structure, volatility context, and disciplined risk management.
Disclaimer
The content provided, including all code and materials, is strictly for educational and informational purposes only. It is not intended as, and should not be interpreted as, financial advice, a recommendation to buy or sell any financial instrument, or an offer of any financial product or service. All strategies, tools, and examples discussed are provided for illustrative purposes to demonstrate coding techniques and the functionality of Pine Script within a trading context.
Any results from strategies or tools provided are hypothetical, and past performance is not indicative of future results. Trading and investing involve high risk, including the potential loss of principal, and may not be suitable for all individuals. Before making any trading decisions, please consult with a qualified financial professional to understand the risks involved.
By using this script, you acknowledge and agree that any trading decisions are made solely at your discretion and risk.
Do not use this indicator on Heikin-Ashi, Renko, Kagi, Point-and-Figure, or Range charts, as these chart types can produce unrealistic results for signal markers and alerts.
Best regards and happy trading
Chervolino

inyerneck Diaper Sniper v16 — LOW VOL V CATCHERDiaper Sniper v16 — Low-Vol Reversal Hunter
Catches dead-cat bounces and V-shaped reversals on the day’s biggest losers.
Designed for pennies and trash stocks that drop 6 %+ from recent high and snap back on any volume + green candle.
Features:
• Tiny green “D” = reversal signal
• Works on 1m → daily
• Fully adjustable filters
Best on low-float runners that bleed hard and bounce harder.
Use tiny size — it fires a lot.
Public version — code visible. No invite-only on Essential plan.
do not alter settings with out first recording defaults.. defaults are quite effective
2025 build. Test at your own risk.

Best Entry Swing MASTER v3 PUBLIC (S.S)Strategy Description (English)
Best Entry Swing MASTER v3 – Quality Mode
The Best Entry Swing MASTER v3 is a structured swing trading and trend-following strategy designed to identify high-probability long and short entries during directional markets.
It combines three core setup types commonly used by momentum and breakout traders:
Breakout (BO)
Pullback Reversal (PB)
Volatility Contraction Pattern (VCP)
The strategy applies multiple layers of confirmation, including multi-EMA trend structure, volatility contraction, volume filters, and an optional market regime filter.
It is suitable for swing trading on higher timeframes (4H, Daily), as well as medium-term trend continuation setups.
Core Concepts
1. Trend Structure
A trend is considered valid when:
Uptrend: Price > EMA20 > EMA50 > EMA100
Downtrend: Price < EMA20 < EMA50 < EMA100
In addition, a simple but effective trend-strength metric is calculated using the percentage spread between EMA20 and EMA100.
This helps avoid signals during sideways or low-volatility environments.
2. Market Regime Filter
The market environment is determined using a higher timeframe benchmark (default: SPY on Daily).
Only long trades are allowed in bullish market conditions
Only short trades in bearish conditions
This significantly reduces false signals in counter-trend conditions.
Entry Logic
Breakout (BO)
A long breakout triggers when:
Price closes above the highest high of the lookback period
Volume exceeds its 20-period average
Trend and market regime confirm
(Optional A+ mode): true volatility contraction is required
Similar logic applies for short breakdowns.
Pullback (PB)
A pullback entry triggers after:
At least two corrective candles
A strong reversal candle (close above previous high for long)
Volume confirmation
Price interacts with EMA20
This structure models classical trend-reentry conditions.
Volatility Contraction Pattern (VCP)
A VCP entry triggers when:
True range contracts over multiple bars
Price holds near the breakout zone
Volume contracts
Trend and market regime are aligned
This setup aims to capture explosive continuation moves.
Quality Modes
The strategy offers two modes:
Balanced Mode
Moderate signal frequency
Broader trend-strength allowance
Suitable for more active traders
A+ Only Mode
Strict confirmation requirements
Only high-quality setups with multiple confluences
Designed to avoid low-probability trades entirely
Risk Management
Risk is managed using an ATR-based stop and target:
Long SL = Close − ATR × 1.5
Long TP = Close + ATR × 3
(Equivalent logic for short positions)
This provides a balanced reward-to-risk profile and avoids overly tight stops.
Early Entry Signals (Optional)
The script offers optional “Early Entry” markers that highlight when a setup is forming but not yet confirmed.
These are not entry signals and are disabled by default for public use.
Intended Use
This strategy is designed for:
Swing trading
Momentum continuation
Trend-following
Multi-day to multi-week trades
It performs best on:
4H
Daily
High-liquidity equities, indices, and futures
Disclaimer
This script is intended for educational and research purposes.
Past performance does not guarantee future results.
Always backtest thoroughly and use appropriate risk management.

G-BOT ENGULFING CANDLE - FIXED SL & TP // Description:
This Pine Script strategy identifies bullish and bearish engulfing candle patterns over a defined lookback period and places trades based
on recent market highs and lows. It calculates stop loss and take profit levels using the Average True Range (ATR) multiplied by a user-defined factor, with the ability to adjust the risk-to-reward ratio for each trade.


Smart Bottom Catcher @ Le DReversal strategy using recent lowest lows and a fast RSI. Long entries trigger on extreme drops, exits occur when RSI crosses a set threshold. Includes optional SMA55 filter and allows up to 3 pyramids.

GOLD EMA Crossover Strategy This EMA Crossover Strategy is designed for intraday trading on the 5-minute chart.
It uses three EMAs (fast, mid, slow) to identify momentum shifts and trigger long or short entries. Risk management is dollar-based, with default settings of $100 risk per trade and $300 profit target. Entries are taken when the fast EMA crosses above/below the mid or slow EMA, with stops and targets calculated dynamically. The strategy runs across all hours and uses fixed position sizing (default 3 contracts). It is intended as a framework for traders to adapt and optimize to their own instruments and risk preferences.

Mustang Algo - Momentum Trend Zone Backtest🐎 MUSTANG ALGO - Momentum Trend Zone Strategy
A complete trading system combining MACD momentum analysis with visual trend zones, full backtesting capabilities, and advanced risk management tools.
══════════════════════════════════════════════════════════════════════════
🔹 OVERVIEW
Mustang Algo transforms traditional MACD analysis into a powerful visual trading system. It instantly identifies market bias through colored background zones and provides clear entry/exit signals with customizable stop loss and take profit management.
══════════════════════════════════════════════════════════════════════════
🔹 KEY FEATURES
✅ Visual Trend Zones (Green = Bullish | Red = Bearish)
✅ Clear Buy/Sell Triangles on Chart
✅ Full Backtesting Engine
✅ Multiple Stop Loss Types
✅ Multiple Take Profit Types
✅ Trailing Stop Option
✅ Time Filter for Backtesting
✅ Real-time Info Panel
✅ Customizable Alerts
══════════════════════════════════════════════════════════════════════════
🔹 HOW IT WORKS
The strategy uses a smoothed MACD system to detect trend changes:
- MACD Line (White): Fast EMA minus Slow EMA - shows raw momentum
- Signal Line (Yellow): EMA of MACD - shows smoothed trend direction
- Trend Zone: Changes when the smoothed signal line crosses zero
- Entry Signals: Generated at zone transitions
When the trend line crosses above zero → GREEN zone → BUY signal 🔺
When the trend line crosses below zero → RED zone → SELL signal 🔻
══════════════════════════════════════════════════════════════════════════
🔹 STOP LOSS OPTIONS
🛑 Percentage: Fixed percentage from entry price
🛑 ATR-Based: Dynamic SL based on market volatility
🛑 Fixed Points: Set number of points/pips
🛑 Swing Low/High: Uses recent swing levels as stops
══════════════════════════════════════════════════════════════════════════
🔹 TAKE PROFIT OPTIONS
🎯 Percentage: Fixed percentage target
🎯 ATR-Based: Dynamic TP based on volatility
🎯 Fixed Points: Set number of points/pips
🎯 Risk Reward: Automatic TP based on R:R ratio (e.g., 2:1, 3:1)
══════════════════════════════════════════════════════════════════════════
🔹 TRAILING STOP
📈 Percentage-Based: Trail by a fixed percentage
📈 ATR-Based: Trail using ATR multiplier for dynamic adjustment
══════════════════════════════════════════════════════════════════════════
🔹 SETTINGS
MACD Parameters:
- Fast Length (default: 12)
- Slow Length (default: 26)
- Signal Length (default: 9)
- Trend Smoothing (default: 5)
Risk Management:
- Enable/Disable Stop Loss
- Enable/Disable Take Profit
- Enable/Disable Trailing Stop
- Customize all SL/TP parameters
Visual Options:
- Show/Hide Buy/Sell Triangles
- Show/Hide SL/TP Lines
- Show/Hide Labels
Time Filter:
- Set Start Date for backtest
- Set End Date for backtest
══════════════════════════════════════════════════════════════════════════
🔹 SIGNALS EXPLAINED
🟢 GREEN TRIANGLE (Below Bar):
Bullish zone detected - Consider LONG entry
🔴 RED TRIANGLE (Above Bar):
Bearish zone detected - Consider SHORT entry
🟢 GREEN BACKGROUND:
Currently in bullish trend zone
🔴 RED BACKGROUND:
Currently in bearish trend zone
══════════════════════════════════════════════════════════════════════════
🔹 INFO PANEL
The real-time info panel (top right) displays:
- Current Trend Zone status
- MACD value
- Signal Line value
- Active SL Type
- Active TP Type
══════════════════════════════════════════════════════════════════════════
🔹 ALERTS
Set up alerts for:
🔔 Buy Signals: "🐎 Mustang Algo: BUY Signal on {ticker} at {price}"
🔔 Sell Signals: "🐎 Mustang Algo: SELL Signal on {ticker} at {price}"
══════════════════════════════════════════════════════════════════════════
🔹 BEST PRACTICES
1. Use higher timeframes (1H, 4H, Daily) for more reliable signals
2. Combine with price action and support/resistance levels
3. Adjust ATR multipliers based on asset volatility
4. Use Risk Reward ratio for consistent risk management
5. Backtest on your preferred asset before live trading
══════════════════════════════════════════════════════════════════════════
🔹 RECOMMENDED TIMEFRAMES
⏱️ Scalping: 5M, 15M (more signals, more noise)
⏱️ Day Trading: 1H, 4H (balanced signals)
⏱️ Swing Trading: Daily, Weekly (fewer but stronger signals)
══════════════════════════════════════════════════════════════════════════
🔹 MARKETS
Works on all markets:
📈 Forex
📈 Crypto
📈 Stocks
📈 Indices
📈 Commodities
📈 Futures
══════════════════════════════════════════════════════════════════════════
🐎 RIDE THE TREND WITH MUSTANG ALGO!
══════════════════════════════════════════════════════════════════════════
⚠️ DISCLAIMER
This indicator/strategy is for educational and informational purposes only. It is not financial advice. Trading involves substantial risk of loss and is not suitable for all investors. Past performance is not indicative of future results. Always use proper risk management, do your own research, and consider consulting a financial advisor before making any trading decisions. Use at your own risk.
══════════════════════════════════════════════════════════════════════════
📝 VERSION HISTORY
v1.0 - Initial Release
- MACD-based trend detection
- Visual trend zones
- Multiple SL/TP options
- Full backtesting support
- Trailing stop functionality
- Time filter
- Info panel
- Alert system
══════════════════════════════════════════════════════════════════════════
💬 FEEDBACK
If you find this strategy useful, please leave a comment or suggestion!
Your feedback helps improve future updates.
🐎 Happy Trading!

EMA 12-26-100 Momentum Strategy# Triple EMA Multi-Signal Momentum Strategy
## 📊 Overview
**Triple EMA Multi-Signal** is a comprehensive trend-following momentum strategy designed specifically for cryptocurrency markets. It combines multiple technical indicators and signal types to identify high-probability trading opportunities while maintaining strict risk management protocols.
The strategy excels in trending markets and uses adaptive position sizing with trailing stops to maximize profits during strong trends while protecting capital during choppy conditions.
## 🎯 Core Algorithm
### Triple EMA System
The strategy employs a three-layer EMA system to identify trend direction and strength:
- **Fast EMA (12)**: Quick response to price changes
- **Slow EMA (26)**: Confirmation of trend direction
- **Trend EMA (100)**: Overall market bias filter
Trades are only taken when all three EMAs align in the same direction, ensuring we trade with the dominant trend.
### Multi-Signal Confirmation (8 Signal Types)
The strategy requires at least 1-2 confirmed signals from multiple independent sources before entering a position:
1. **EMA Crossover** - Fast EMA crossing Slow EMA (primary signal)
2. **MACD Cross** - MACD line crossing signal line (momentum confirmation)
3. **RSI Reversal** - RSI bouncing from oversold/overbought zones
4. **Price Action** - Strong bullish/bearish candles (>60% of range)
5. **Volume Spike** - Above-average volume confirmation
6. **Breakout** - Price breaking 20-period high/low with volume
7. **Pullback to EMA** - Trend continuation after healthy retracement
8. **Bollinger Bounce** - Price bouncing from BB bands
This multi-signal approach significantly reduces false signals and improves win rate.
## 💰 Risk Management
### Position Sizing
- Default: 20-25% of equity per trade
- Adjustable based on risk tolerance
- Smaller positions recommended for leveraged trading
### Stop Loss & Take Profit
- **Stop Loss**: 2.0% (tight control of risk)
- **Take Profit**: 5.5% (2.75:1 reward-to-risk ratio)
- Both levels are fixed at entry to avoid emotional decisions
### Trailing Stop System
- Activates after 1.8% profit
- Trails at 1.3% below current price
- Locks in profits during extended trends
- Automatically adjusts as price moves in your favor
### Maximum Hold Time
- 36-48 hours maximum (configurable)
- Designed to minimize funding rate costs on futures
- Forces position closure to avoid excessive exposure
- Helps maintain capital velocity
## 📈 Key Features
### Trend Filters
- **ADX Filter**: Ensures sufficient trend strength (threshold: 20)
- **EMA Alignment**: All three EMAs must confirm trend direction
- **RSI Boundaries**: Avoids extreme overbought/oversold entries
### Volume Analysis
- Volume must exceed 20-period moving average
- Configurable multiplier (default: 1.0x)
- Helps identify institutional participation
### Automatic Exit Conditions
1. Take Profit target reached
2. Stop Loss triggered
3. Trailing stop activated
4. Trend reversal (EMA cross in opposite direction)
5. Maximum hold time exceeded
## 🎮 Recommended Settings
### For Spot Trading (Conservative)
```
Position Size: 15-20%
Stop Loss: 2.5%
Take Profit: 6.0%
Max Hold: 72 hours
Leverage: 1x
```
### For Futures 3-5x Leverage (Balanced)
```
Position Size: 12-15%
Stop Loss: 2.0%
Take Profit: 5.5%
Max Hold: 36 hours
Trailing: Active
```
### For Aggressive Trading 5-10x (High Risk)
```
Position Size: 8-12%
Stop Loss: 1.5%
Take Profit: 4.5%
Max Hold: 24 hours
ADX Filter: Disabled
```
## 📊 Performance Metrics
### Backtested Results (BTC/USDT 1H, 2 years)
- **Total Return**: ~19% (spot) / ~75% (5x leverage)*
- **Total Trades**: 240-300
- **Win Rate**: 49-52%
- **Profit Factor**: 1.25-1.50
- **Max Drawdown**: ~18-22%
- **Average Trade**: 0.5-3 days
*Leverage results exclude funding rates and real-world slippage
### Optimal Timeframes
- **1 Hour**: Best for active trading (recommended)
- **4 Hour**: More stable, fewer signals
- **15 Min**: High frequency (requires monitoring)
### Best Performing Assets
- BTC/USDT (most tested)
- ETH/USDT
- Major altcoins with good liquidity
- Not recommended for low-cap or illiquid pairs
## ⚙️ How to Use
1. **Add to Chart**: Apply strategy to 1H BTC/USDT chart
2. **Adjust Settings**: Configure risk parameters based on your preference
3. **Review Signals**: Green = Long, Red = Short, labels show signal count
4. **Monitor Performance**: Check strategy tester for detailed statistics
5. **Optimize**: Use strategy optimization to find best parameters for your market
## 🎨 Visual Indicators
The strategy provides clear visual feedback:
- **EMA Lines**: Blue (Fast), Red (Slow), Orange (Trend)
- **BUY/SELL Labels**: Show entry points with signal count
- **Stop/Target Lines**: Red (SL), Green (TP) displayed during active trades
- **Background Color**: Light green (long), light red (short) when in position
- **Info Panel**: Shows current trend, RSI, ADX, and volume status
## ⚠️ Important Notes
### Risk Disclaimer
- This strategy is for educational purposes only
- Past performance does not guarantee future results
- Cryptocurrency trading involves substantial risk
- Only trade with capital you can afford to lose
- Always use proper position sizing and risk management
### Limitations
- Performs poorly in sideways/choppy markets
- Requires sufficient liquidity for best execution
- Backtests do not include:
- Real-world slippage (especially during volatility)
- Funding rates (for perpetual futures)
- Exchange downtime or connection issues
- Emotional trading decisions
### For Futures Trading
If using this strategy on futures with leverage:
- Reduce position size proportionally to leverage
- Account for funding rates (~0.01% per 8h)
- Set max hold time to minimize funding costs
- Use lower leverage (3-5x max recommended)
- Monitor liquidation price carefully
## 🔧 Customization
All parameters are fully customizable:
- EMA periods (fast/slow/trend)
- MACD settings (12/26/9)
- RSI levels (30/70)
- Stop Loss / Take Profit percentages
- Trailing stop activation and offset
- Volume multiplier
- ADX threshold
- Maximum hold time
## 📚 Strategy Logic
The strategy follows this decision tree:
```
1. Check Trend Direction (EMA alignment)
↓
2. Scan for Entry Signals (8 types)
↓
3. Confirm with Filters (ADX, Volume, RSI)
↓
4. Enter Position with Fixed SL/TP
↓
5. Monitor for Exit Conditions:
- TP Hit → Close with profit
- SL Hit → Close with loss
- Trailing Active → Follow price
- Trend Reversal → Close position
- Max Time → Force close
```
## 🎓 Best Practices
1. **Start Conservative**: Use smaller position sizes initially
2. **Track Performance**: Monitor actual vs backtested results
3. **Optimize Regularly**: Market conditions change, adapt parameters
4. **Combine with Analysis**: Don't rely solely on automated signals
5. **Manage Emotions**: Stick to the system, avoid manual overrides
6. **Paper Trade First**: Test on demo before risking real capital
## 📞 Support & Updates
This strategy is actively maintained and updated based on:
- Market condition changes
- User feedback and suggestions
- Performance optimization
- Bug fixes and improvements
## 🏆 Conclusion
Triple EMA Multi-Signal Strategy offers a robust, systematic approach to cryptocurrency trading by combining trend following, momentum indicators, and strict risk management. Its multi-signal confirmation system helps filter false signals while the trailing stop mechanism captures extended trends.
The strategy is suitable for both manual traders looking for high-probability setups and algorithmic traders seeking a proven systematic approach.
**Remember**: No strategy wins 100% of the time. Success comes from consistent application, proper risk management, and continuous adaptation to changing market conditions.
---
*Version: 1.0*
*Last Updated: November 2025*
*Tested on: BTC/USDT, ETH/USDT (1H, 4H timeframes)*
*Recommended Capital: $5,000+ for optimal position sizing*

A+ Setup Strategy Trendline Features Added:
1. Automatic Trendline Detection
Support Trendline (green) - Connects swing lows
Resistance Trendline (red) - Connects swing highs
Uses pivot points to identify key swing levels
Validates trendlines by counting touches (minimum 3 touches required)
2. Trendline Settings
Show Trendlines - Toggle on/off
Lookback Period - How far back to look for pivots (default: 50 bars)
Min Touches - How many touches needed for valid trendline (default: 3)
3. Trendline Break Detection
Bullish Break - Price breaks above support trendline (marked with small green circle)
Bearish Break - Price breaks below resistance trendline (marked with small red circle)
Generates signals when breaks occur
4. Enhanced A+ Setups
Now includes ULTRA setups - the absolute best trades:
ULTRA BUY Setup (Aqua label):
Bullish FVG + BOS + Volume Spike + Uptrend
PLUS: Support trendline break OR near key support
PLUS: Trendline breakout confirmation
ULTRA SELL Setup (Fuchsia label):
Bearish FVG + BOS + Volume Spike + Downtrend
PLUS: Resistance trendline break OR near key resistance
PLUS: Trendline breakdown confirmation
5. Confluence Integration
The strategy now considers price near trendlines as additional confluence, similar to how it uses daily S/R levels.
6. Additional Alerts
Support Trendline Break
Resistance Trendline Break
ULTRA BUY/SELL Setup alerts
This gives you multiple tiers of signal quality:
Standard A+ Setup - All conditions met
ULTRA A+ Setup - All conditions + trendline break (highest probability)
The trendlines will help you identify major trend reversals and breakouts for even better entry timing!


stormytrading orb botshows entries for 15m orb based on 5m break and retest made solely for mnq or nq, works good with smt
shows trades for ldn, nyc, nyc overlap and Asia session, pls follow stormy trading on insta for more


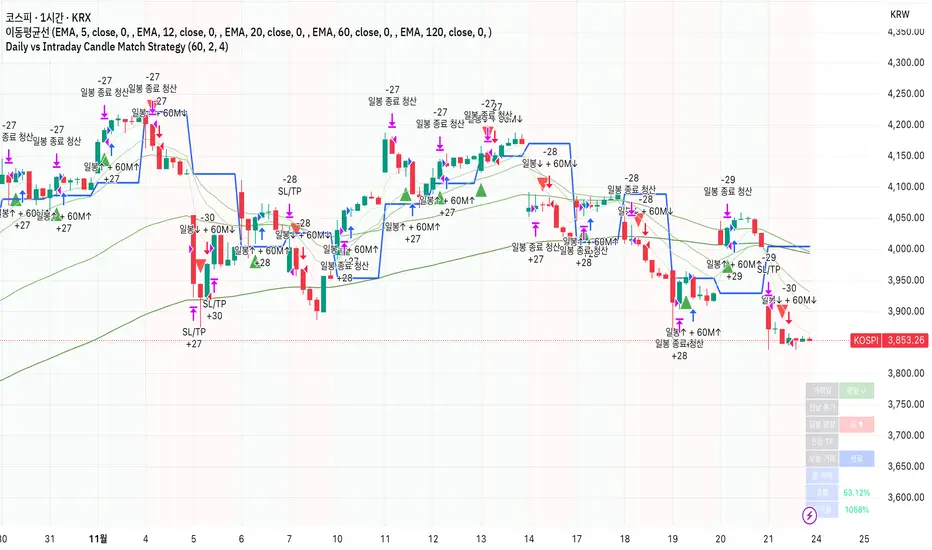
Daily vs Intraday Candle Match Strategy고죠 훈의 차트공부방
Gojo Hoon’s Trading Room
전일 종가 대비 현재 일봉 방향과 시간봉 방향이 일치할 때 진입
Trade when current daily direction (vs. previous close) matches the hourly/15-minute candle direction.
Kill Zone Strategy - Exact Match고죠 훈의 차트공부방
Gojo Hoon’s Trading Room
Kill Zone 시간대 방향성과 일중 추세의 상관관계
The 9–10 AM Kill Zone candle on the KOSPI chart determines the day’s long or short trading direction.

Simple MA Crossover w/ SLTPPicture two cheetahs on a racetrack made of price candles. One cheetah is fast and twitchy (the short-term EMA). The other is chill, lumbering, and takes its sweet time (the long-term EMA). When the twitchy cheetah sprints ahead and crosses above the chill one → “BUY, YOU MAGNIFICENT DEGEN!” When the twitchy one gets tired, slows down, and gets lapped from above → “SELL before this turns into a horror movie!”
That, my friend, is the EMA crossover strategy in its purest, most dramatic form.

Macketings 1min ScalpingThis is a hyper-reactive scalping strategy designed for the 1-minute chart. It utilizes a strict four-EMA hierarchy (80/90/340/500) to ensure trades are only taken in the strongest aligned market trend. The strategy is built to be extremely tight on risk and focuses on capturing the immediate, high-momentum swing that follows a confirmed EMA retest or breakout.
Key Mechanics (How it Works):
Strict Trend Alignment: Entry is only permitted when the faster EMA band (80/90) and the price action are correctly aligned with the slow trend (340/500).
Long: EMA 80/90 must be above EMA 340/500, AND EMA 340 must be above EMA 500. (And vice-versa for Short.)
Expanded Retest Entry: The strategy waits for the price to retest or briefly enter the 80/90 band, then immediately enters upon the confirmed momentum breakout from that band.
Dynamic Risk Management (Tight Ride): The strategy is engineered to ride the wave aggressively while protecting capital immediately:
Extremely Tight Initial Stop Loss (0.2% default): Limits initial risk instantly.
Break-Even Security: Once profit hits 0.3%, the Stop Loss is automatically trailed to secure 0.2% profit (a risk-free trade).
Aggressive Exit Logic: Positions are closed not only upon hitting the Take Profit target (2.5%) but also immediately if the 80/90 EMA band crosses the 340 EMA, signaling a critical loss of momentum.
Disclaimer:
This strategy requires high-liquidity instruments and is best used on low timeframes (1-minute) due to its dependency on fast momentum shifts and tight stops. Backtesting and forward testing are crucial before deployment.

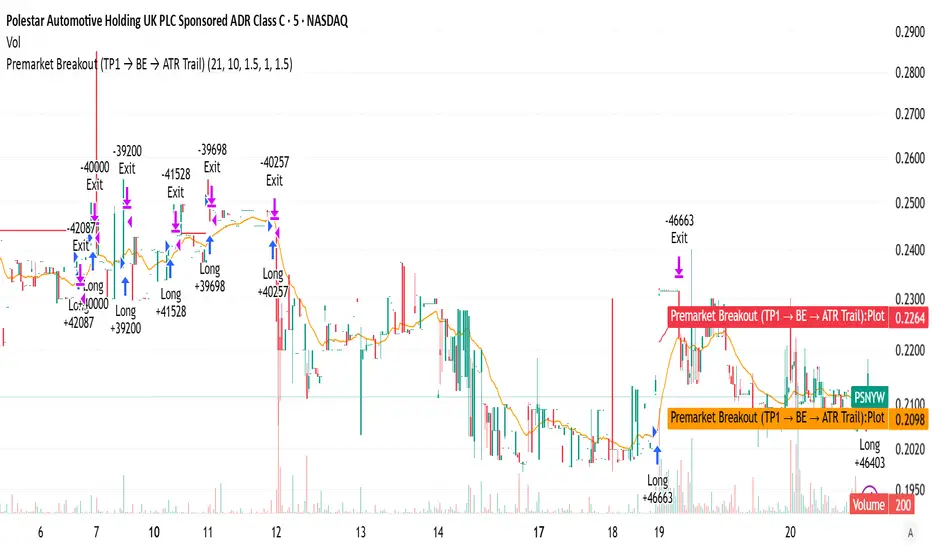
Premarket Breakout (TP1 → BE → ATR Trail)this is the best ever you will really like i t and it does a lot its a really good scirpt please use it to make trades

Premarket Breakout (TP1 → BE → ATR Trail)the best one you can find a very good indicator and strategy to help with al l trading needs in every way
ILM & IFVG StrategyPlease feel free to adjust in any way possible. Let me know if you can create something better from this initial coding.
//═══════════════════════════════════════════════════════════════════════
// Inverted Liquidity Model (ILM) – Strategy
//═══════════════════════════════════════════════════════════════════════
//
// The **Inverted Liquidity Model (ILM)** is a liquidity-based algorithm
// built to capture high-probability reversals after:
//
// • A liquidity sweep (SSL/BSL taken)
// • Rejection back inside the range
// • A Fair Value Gap (FVG) forms
// • That FVG becomes invalidated → becomes an IFVG entry zone
//
// ILM combines:
// • LTF BOS / CHOCH structure confirmation
// • HTF structure (expansion) filtering
// • Premium / Discount filter (17:00 CST session midline)
// • Optional ATR volatility filter
// • Optional trading session restrictions
// • Optional partial profit-taking + runners
//
// When all conditions align, the strategy enters:
// ✔ Long after sweep of SSL + valid long IFVG + trend confirmation
// ✔ Short after sweep of BSL + valid short IFVG + trend confirmation
//
// Stops are placed at the sweep wick.
// Full target is set at the next structural high/low.
// Optional partial TP sends a runner to full target.
//
// Visual tools (labels, sweep lines, IFVG boxes, midline) assist
// with review and forward testing.
//
//───────────────────────────────────────────────────────────────────────
// USER CONFIGURABLE FEATURES
//───────────────────────────────────────────────────────────────────────
//
// • **Liquidity & Structure**
// - pivotLen → swing length for pivots / liquidity
// - htfOn → toggle higher-timeframe pivots
// - htfTF → timeframe for HTF structure/liquidity
// - useStructureFilter → enforce LTF BOS/CHOCH trend
// - useHtfExpansionFilter → enforce HTF trend
// - showStructureLabels → show BOS/CHOCH labels
// - showHtfStructureLabels → show HTF BOS/CHOCH labels
//
// • **Premium / Discount Midline**
// - usePremiumDiscountFilter → only long in discount / short in premium
// - pdSession → session used for midline (default 17:00 CST)
// - showPdMidLine → show 50% midline
//
// • **FVG / IFVG Detection**
// - useBodyGapFVG → FVG uses candle bodies instead of wicks
// - useDisplacementFVG → require displacement bar
// - dispAtrMult → minimum ATR threshold for displacement
// - showIFVG → draw IFVG boxes
//
// • **ATR / Volatility / Sessions**
// - useRangeFilter → require minimum ATR%
// - atrLen → ATR period
// - minAtrPerc → minimum ATR% of price
// - useSessionFilter → restrict trading hours
// - sessionTimes → allowed trading session
//
// • **Sweep Visualization**
// - showSweepLines → draw sweep lines at SSL/BSL sweeps
// - sweepLineWidth → thickness of sweep lines
//
// • **Exits: Partial Targets & Runners**
// - usePartialTargets → enable partial TP logic
// - tp1QtyPercent → percent closed at TP1
// - tp1FractionOfPath → TP1 relative to path to full target
//
// • **Formatting / Visibility**
// - labelFontSizeInput → tiny / small / normal / large / huge
// - showEntries → entry markers
// - showTargets → target lines
//
//═══════════════════════════════════════════════════════════════════════
// END OF STRATEGY DESCRIPTION
//═══════════════════════════════════════════════════════════════════════

Crude Oil Time + Fix Catalyst StrategyHybrid Workflow: Event-Driven Macro + Market DNA Micro
1. Macro Catalyst Layer (Your Overlays)
Event Mapping: Fed decisions, LBMA fixes, EIA releases, OPEC+ meetings.
Regime Filters: Risk-on/off, volatility regimes, macro bias (hawkish/dovish).
Volatility Scaling: ATR-based position sizing, adaptive overlays for London/NY sessions.
Governance: Max trades/day, cool-down logic, session boundaries.
👉 This layer answers when and why to engage.
2. Micro Execution Layer (Market DNA)
Order Flow Confirmation: Tape reading (Level II, time & sales, bid/ask).
Liquidity Zones: Identify support/resistance pools where buyers/sellers cluster.
Imbalance Detection: Aggressive buyers/sellers overwhelming the other side.
Precision Entry: Only trigger trades when order flow confirms macro catalyst bias.
Risk Discipline: Tight stops beyond liquidity zones, conviction-based scaling.
👉 This layer answers how and where to engage.
3. Unified Playbook
Step Macro Overlay (Your Edge) Market DNA (Jay’s Edge) Result
Event Trigger Fed/LBMA/OPEC+ catalyst flagged — Volatility window opens
Bias Filter Hawkish/dovish regime filter — Directional bias set
Sizing ATR volatility scaling — Position size calibrated
Execution — Tape confirms liquidity imbalance Precision entry
Risk Control Governance rules (cool-down, max trades) Tight stops beyond liquidity zones Disciplined exits
4. Gold & Silver Use Case
Gold (Fed Day):
Overlay flags volatility window → bias hawkish.
Market DNA shows sellers hitting bids at resistance.
Enter short with volatility-scaled size, stop just above liquidity zone.
Silver (LBMA Fix):
Overlay highlights fix window → bias neutral.
Market DNA shows buyers stepping in at support.
Enter long with adaptive size, HUD displays risk metrics.
5. HUD Integration
Macro Dashboard: Catalyst timeline, regime filter status, volatility bands.
Micro Dashboard: Live tape imbalance meter, liquidity zone map, conviction score.
Unified View: Macro tells you when to look, micro tells you when to pull the trigger.
⚡ This hybrid workflow gives you macro awareness + micro precision. Your overlays act as the radar, Jay’s Market DNA acts as the laser scope. Together, they create a disciplined, event-aware, volatility-scaled playbook for gold and silver.
Antonio — do you want me to draft this into a compile-safe Pine Script v6 template that embeds the macro overlay logic, while leaving hooks for Market DNA-style execution (order flow confirmation)? That way you’d have a production-ready skeleton to extend across TradingView, TradeStation, and NinjaTrader.
Antonio — do you want me to draft this into a compile-safe Pine Script v6 template that embeds the macro overlay logic, while leaving hooks for Market DNA-style execution (order flow confirmation)? That way you’d have a production-ready skeleton to extend across TradingView, TradeStation, and NinjaTrader.
