Kaya RSI BASED INFLATION INDICATORUse your own risk.
This indicator aims look inflation of your emita according to the BTC and XAU. Also you can use Dxy too. The main idea of behind of this indicator is rsi. But not normal rsi :).
For example. If green(XAU) line upper then xau going to up better than BTC and your emita. If red line (BTC) is upper, thats mean buying BTC can be more profitably. Blue line (named Normal means this is your emita) is upper that mean your emita is can be more profitably than the others. You can think opposite for lower situations.
Be aware this is not mean percent rising or declining. This is just understanding for which of them (relatively) moving how according to the rsi.
Maybe it can using for positons too. But I didnt test it. So be carefull.
Best Regards.
Chf

CHF RSCCHF Relative Strength Comparison to the basket of other major currencies.
chf = (1/usdchf + chfjpy/100 + 1/cadchf + 1/gbpchf + 1/eurchf + 1/audchf + 1/nzdchf)/7

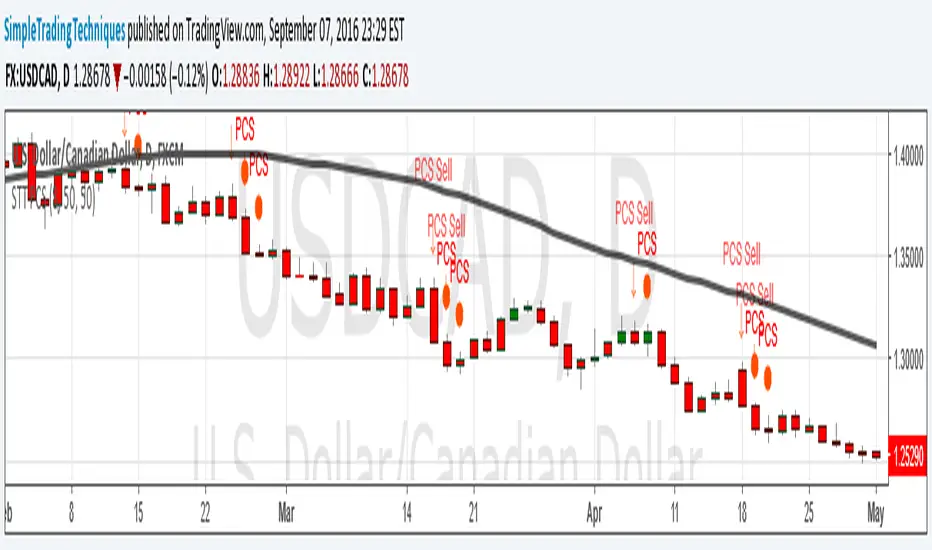
PULLBACK CANDLESTICK STRATEGY BY SIMPLE TRADING TECHNIQUESArrow represent trade setup
Circle represent triggering of the trade
--------------------------------------------------------------------
1. Where to place stop loss?
2. Where to exit the trade?
3. How to protect gains in your trade?
4. How to apply money management rule?
5. How to trade gap opening?